3D Neuroscience Market Overview and Analysis

The Global 3D Neuroscience Market was worth USD 37.6 billion in 2025, and is predicted to grow to USD 55.2 billion by 2035, with a CAGR of 7.8% from 2025-2032.

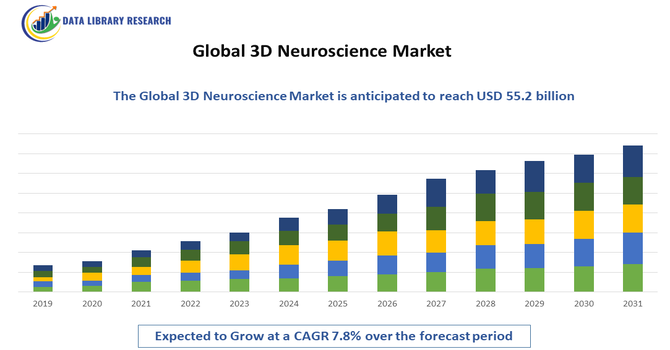
The Global 3D Neuroscience Market involves advanced three-dimensional technologies used to study, model, and visualize the structure and function of the nervous system. It includes 3D cell cultures, brain organoids, imaging, and modeling tools that support drug discovery, disease research, and neurodevelopment studies. The market is driven by rising neurological disorder prevalence, technological innovations, and increasing research investments worldwide.

The Global 3D Neuroscience Market is primarily driven by the rising prevalence of neurological disorders, including Alzheimer’s, Parkinson’s, and epilepsy, which has increased the demand for advanced research tools. Technological advancements in 3D cell cultures, brain organoids, and high-resolution imaging have enhanced the accuracy and efficiency of neuroscience studies. Additionally, growing investments in drug discovery, personalized medicine, and academic and pharmaceutical research, combined with increasing adoption of in vitro models over traditional animal testing, have further fueled market growth worldwide.

3D Neuroscience Market Latest Trends

The Global 3D Neuroscience Market has witnessed trends such as the adoption of 3D brain organoids, microfluidic platforms, and high-resolution imaging for modeling neurological diseases. Integration of artificial intelligence, machine learning, and computational modeling has improved predictive accuracy and data analysis. Researchers are increasingly shifting from traditional 2D cell cultures to 3D models for more physiologically relevant results. Collaborations between academic institutions, biotech companies, and pharmaceutical firms are driving innovation, product development, and commercialization in the market.

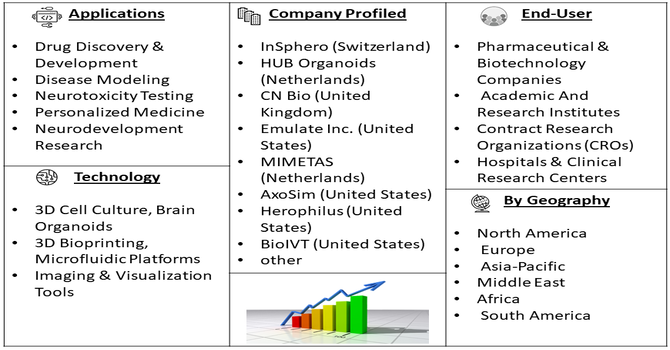
Segmentation: The Global 3D Neuroscience Market is segmented by Technologies (3D Cell Culture, Brain Organoids, 3D Bioprinting, Microfluidic Platforms, and Imaging & Visualization Tools), Applications (Drug Discovery & Development, Disease Modeling, Neurotoxicity Testing, Personalized Medicine, and Neurodevelopment Research), End-Users (Pharmaceutical & Biotechnology Companies, Academic And Research Institutes, Contract Research Organizations (CROs), and Hospitals & Clinical Research Centers) and Geography (North America, Europe, Asia-Pacific, Middle East and Africa, and South America). The report provides the value (in USD million) for the above segments.

Market Drivers:

  • Rising Prevalence of Neurological Disorders

The increasing prevalence of neurological disorders such as Alzheimer’s, Parkinson’s, epilepsy, and multiple sclerosis has significantly driven the demand for 3D neuroscience technologies. For instance, in March 2024, the Lancet Neurology, published a comprehensive study revealed that neurological conditions affected 43% of the global population (3.4 billion people) in 2021, causing 443 million disability-adjusted life years (DALYs) lost due to illness, disability, and premature death. This made neurological disorders the leading contributor to the global disease burden. The rising prevalence of these conditions increased demand for advanced research tools, driving growth and adoption of 3D neuroscience technologies worldwide.

Traditional 2D cell cultures and animal models often fail to replicate the complex architecture and functionality of human neural tissues, limiting research accuracy. 3D models, including brain organoids and 3D cell cultures, provide more physiologically relevant data for studying disease mechanisms, drug screening, and therapeutic development. The growing need to develop effective treatments and personalized medicine solutions has accelerated investment in 3D neuroscience research tools, leading to wider adoption in academic, pharmaceutical, and biotechnology sectors globally.

  • Technological Advancements and Integration

Technological innovations in 3D printing, microfluidics, high-resolution imaging, and computational modeling have enhanced the capabilities of 3D neuroscience research. Integration with artificial intelligence (AI) and machine learning allows for better data analysis, predictive modeling, and simulation of neural networks. Additionally, the development of more sophisticated brain organoids and multi-cellular 3D cultures has improved the physiological relevance of experimental results. These advancements have expanded applications in drug discovery, toxicity testing, and disease modeling, reducing reliance on animal testing. The combination of innovation, automation, and enhanced accuracy has encouraged pharmaceutical companies and research institutions to adopt 3D neuroscience technologies, boosting market growth.

Market Restraint

  • High Costs and Technical Complexity

Despite its benefits, the 3D neuroscience market faces restraints due to the high cost of advanced equipment, specialized reagents, and complex laboratory infrastructure. Developing and maintaining 3D models such as brain organoids requires skilled personnel, extended culture periods, and stringent quality control, which can be challenging for smaller laboratories. Additionally, integrating AI and imaging technologies demands substantial investment and technical expertise. These cost and complexity barriers limit adoption, especially in emerging markets and smaller research institutions, potentially slowing market growth despite the increasing demand for accurate and physiologically relevant neuroscience research models.

Socio Economic Impact on 3D Neuroscience Market

3D neuroscience technologies have significantly influenced healthcare and research by accelerating drug discovery, reducing reliance on animal testing, and improving understanding of complex neurological disorders. This has lowered costs and timelines for developing therapies and enhanced treatment efficacy. The technologies also support educational initiatives and workforce skill development in neuroscience research, contributing to broader scientific advancement. Thus, 3D neuroscience fosters better patient outcomes, economic efficiency, and healthcare innovation worldwide.

Segmental Analysis:

  • 3D Cell Culture Segment is Expected to Witness Significant Growth Over the Forecast Period

The 3D cell culture segment is anticipated to experience significant growth during the forecast period due to its ability to replicate in vivo cellular environments more accurately than traditional 2D cultures. These cultures allow for better modeling of neuronal networks, disease mechanisms, and drug responses, improving the predictability of preclinical studies. Pharmaceutical and biotechnology companies increasingly adopt 3D cell cultures for drug discovery, neurodegenerative disease research, and personalized medicine applications. Additionally, advancements in biomaterials, scaffold designs, and automation have made 3D cell culture more accessible and efficient, driving widespread adoption across academic, research, and industrial laboratories worldwide.

  • Neurotoxicity Testing Segment is Expected to Witness Significant Growth Over the Forecast Period

The neurotoxicity testing segment is projected to witness substantial growth over the forecast period due to rising demand for safer and more effective therapeutics. Regulatory agencies increasingly require comprehensive neurotoxicity evaluations, encouraging the adoption of advanced 3D models and brain organoids for testing chemical and drug effects on neural cells. These models provide physiologically relevant data, reducing reliance on animal testing and improving predictive accuracy for human responses. The growing prevalence of neurological disorders, coupled with innovations in imaging, computational modeling, and high-throughput screening, has further fueled the adoption of neurotoxicity testing platforms in pharmaceutical, biotechnology, and academic research settings globally.

  • Pharmaceutical & Biotechnology Companies Segment is Expected to Witness Significant Growth Over the Forecast Period

The pharmaceutical and biotechnology companies segment is expected to experience significant growth over the forecast period due to increasing investments in drug discovery, disease modeling, and personalized medicine. These companies are increasingly adopting 3D neuroscience technologies, including brain organoids, 3D cell cultures, and microfluidic platforms, to improve preclinical research and accelerate the development of novel therapeutics for neurological disorders. Rising demand for more predictive and physiologically relevant models, coupled with the need to reduce costs and timelines in drug development, has driven adoption across pharmaceutical and biotech sectors worldwide. Strategic partnerships, collaborations, and technology licensing further support market expansion.

  • North America Region is Expected to Witness Significant Growth Over the Forecast Period

North America is projected to witness significant growth in the 3D neuroscience market due to the presence of advanced research infrastructure, high adoption of innovative technologies, and substantial investments in neuroscience research. The U.S. dominates the regional market, driven by strong pharmaceutical and biotechnology sectors, increasing funding for neurological disease research, and the early adoption of brain organoids, 3D cell cultures, and imaging technologies. For instance, in August 2021, Researchers at UCLA’s Eli and Edythe Broad Center developed brain organoids from human stem cells that exhibited organized activity waves similar to living human brains. While studying organoids from Rett syndrome patients, they observed seizure-like electrical patterns. Published in Nature Neuroscience, the study highlighted organoids’ ability to model human brain function and diseases, enhancing research capabilities and accelerating adoption of 3D neuroscience technologies in North America’s research and pharmaceutical markets.

Government initiatives, academic collaborations, and favorable regulatory support have accelerated the use of 3D neuroscience platforms in drug discovery, neurotoxicity testing, and personalized medicine, positioning North America as a key growth region globally. For instance, in August 2024, The U.S. National Science Foundation invested USD 14 million in seven projects under the EFRI: Biocomputing through EnGINeering Organoid Intelligence program. Each team received USD 2 million to develop organoid intelligence systems—3D engineered tissue models replicating natural tissue functions—to advance biological computing. This funding supported ethically responsible R&D, addressed AI limitations, and promoted broader participation in biocomputing, strengthening government initiatives and accelerating growth of the 3D neuroscience market in North America. Thus, all such factors are together driving the market growth in above region.

3D Neuroscience Market Competitive Analysis

The 3D neuroscience market is highly competitive, with key players focusing on innovation, strategic partnerships, mergers, and acquisitions. Leading companies such as Thermo Fisher Scientific, STEMCELL Technologies, Axol Bioscience, 3D Biotek, and Emulate Inc. dominate through advanced product portfolios and strong R&D capabilities. Startups and emerging players are investing in niche 3D organoid models, microfluidic devices, and AI-driven analytics. Continuous technological advancements and collaborations among pharmaceutical companies, research institutions, and biotech firms intensify competition and accelerate market growth.

The major players for above market are:

  • Thermo Fisher Scientific (United States)
  • Corning Incorporated (United States)
  • Merck KGaA (Germany)
  • InSphero (Switzerland)
  • HUB Organoids (Netherlands)
  • CN Bio (United Kingdom)
  • Emulate Inc. (United States)
  • MIMETAS (Netherlands)
  • AxoSim (United States) 
  • Herophilus (United States)
  • BioIVT (United States)
  • Ncardia (Netherlands)
  • Axion BioSystems (United States)
  • STEMCELL Technologies (Canada)
  • GE Healthcare (United States)
  • Siemens Healthineers (Germany)
  • Doric Lenses Inc.
  • Laserglow Technologies
  • Neuronexus Technologies
  • Noldus Information Technology

Recent Development

  • In September 2025, Scientists from the Institute of Nano Science and Technology (INST) discovered that graphitic carbon nitride (g-C₃N₄) could stimulate brain cells without electrodes, lasers, or magnets. Published in ACS Applied Materials & Interfaces, the nanomaterial enhanced neuronal growth, maturation, and communication, increased dopamine production, and reduced Parkinson’s-related toxic proteins. By naturally interacting with neurons, it improved neural connectivity and function, offering a non-invasive alternative, which strengthened innovation and adoption in the global 3D neuroscience market.


  • In August 2025, Researchers at the University of California San Diego Sanford Stem Cell Institute developed a novel method using graphene to stimulate and mature human brain organoids. Published in Nature Communications, the Graphene-Mediated Optical Stimulation (GraMOS) technique provided a safe, non-genetic, and biocompatible approach to influence neural activity over time. This advancement accelerated organoid development, improved modeling of age-related conditions like Alzheimer’s, and enhanced real-time control of robotic devices, boosting growth and adoption in the global 3D neuroscience market. @@@@


Frequently Asked Questions (FAQ) :

Q1. What the main growth driving factors for this market?

The main growth driver is the critical need for more accurate and complex disease models for neurological conditions like Alzheimer's and Parkinson's. Traditional 2D cell cultures fail to replicate the complexity of the brain. Advances in 3D bioprinting technology and the development of new, compatible bio-inks allow researchers to create lifelike neural organoids and tissue constructs. This capability accelerates drug discovery, toxicity testing, and personalized medicine initiatives, fueling substantial investment and market expansion.

Q2. What are the main restraining factors for this market?

The market faces constraints primarily due to the high capital investment required for sophisticated 3D bioprinters, specialized materials, and lab infrastructure. Furthermore, there is a significant technical complexity involved in maintaining the viability and functionality of 3D-printed neural structures, demanding highly specialized technical expertise. Lack of standardized protocols across different labs and complex regulatory pathways for translating these models into clinical tools also limit faster market penetration globally.

Q3. Which segment is expected to witness high growth?

The 3D Bioprinting of Neural Organoids and Tissue Models segment is projected to experience the fastest growth. These miniature, self-assembled brain models, derived from patient stem cells, offer an unprecedented way to study disease mechanisms and test new compounds with high fidelity. Their ability to simulate in vivo human brain responses minimizes reliance on animal models and dramatically improves the efficiency and success rates of preclinical drug screening for complex brain disorders, attracting huge R&D capital.

Q4. Who are the top major players for this market?

The market is led by companies specializing in the core enabling technologies. Major players include BICO (CELLINK), a leader in bioprinting hardware and bio-inks, and Organovo Holdings, known for developing functional human tissues using bioprinting. Additionally, large imaging companies like Siemens Healthineers and General Electric (GE Healthcare) are crucial for the 3D visualization and diagnostic components, providing the advanced software necessary to analyze and model brain structure and disease progression.

Q5. Which country is the largest player?

The United States holds the largest market share in the Global 3D Neuroscience Market. This dominance is driven by the vast amount of venture capital funding flowing into biotechnology and neuro-research startups, particularly in states like Massachusetts and California. The presence of world-leading academic research institutions, coupled with heavy government investment (NIH) in brain-related initiatives, ensures the U.S. remains the primary hub for the development and commercialization of advanced 3D neuroscience tools.

3D Neuroscience MARKET STUDY GLOBAL MARKET ANALYSIS, INSIGHTS AND FORECAST, 2022-2029

    1. Introduction

    • 1.1. Research Scope
    • 1.2. Market Segmentation
    • 1.3. Research Methodology
    • 1.4. Definitions and Assumptions

    2. Executive Summary

      3. Market Dynamics

      • 3.1. Market Drivers
      • 3.2. Market Restraints
      • 3.3. Market Opportunities

      4. Key Insights

      • 4.1. Key Emerging Trends – For Major Countries
      • 4.2. Latest Technological Advancement
      • 4.3. Regulatory Landscape
      • 4.4. Industry SWOT Analysis
      • 4.5. Porters Five Forces Analysis

      5. Global 3D Neuroscience Market Analysis (USD Billion), Insights and Forecast, 2018-2029

      • 5.1. Key Findings / Summary
      • 5.2. Market Analysis, Insights and Forecast – By Segment 1
        • 5.2.1. Sub-Segment 1
        • 5.2.2. Sub-Segment 2
      • 5.3. Market Analysis, Insights and Forecast – By Segment 2
        • 5.3.1. Sub-Segment 1
        • 5.3.2. Sub-Segment 2
        • 5.3.3. Sub-Segment 3
        • 5.3.4. Others
      • 5.4. Market Analysis, Insights and Forecast – By Segment 3
        • 5.4.1. Sub-Segment 1
        • 5.4.2. Sub-Segment 2
        • 5.4.3. Sub-Segment 3
        • 5.4.4. Others
      • 5.5. Market Analysis, Insights and Forecast – By Region
        • 5.5.1. North America
        • 5.5.2. Latin America
        • 5.5.3. Europe
        • 5.5.4. Asia Pacific
        • 5.5.5. Middle East and Africa

      6. North America 3D Neuroscience Market Analysis (USD Billion), Insights and Forecast, 2018-2029

      • 6.1. Key Findings / Summary
      • 6.2. Market Analysis, Insights and Forecast – By Segment 1
        • 6.2.1. Sub-Segment 1
        • 6.2.2. Sub-Segment 2
      • 6.3. Market Analysis, Insights and Forecast – By Segment 2
        • 6.3.1. Sub-Segment 1
        • 6.3.2. Sub-Segment 2
        • 6.3.3. Sub-Segment 3
        • 6.3.4. Others
      • 6.4. Market Analysis, Insights and Forecast – By Segment 3
        • 6.4.1. Sub-Segment 1
        • 6.4.2. Sub-Segment 2
        • 6.4.3. Sub-Segment 3
        • 6.4.4. Others
      • 6.5. Market Analysis, Insights and Forecast – By Country
        • 6.5.1. U.S.
        • 6.5.2. Canada

      7. Latin America 3D Neuroscience Market Analysis (USD Billion), Insights and Forecast, 2018-2029

      • 7.1. Key Findings / Summary
      • 7.2. Market Analysis, Insights and Forecast – By Segment 1
        • 7.2.1. Sub-Segment 1
        • 7.2.2. Sub-Segment 2
      • 7.3. Market Analysis, Insights and Forecast – By Segment 2
        • 7.3.1. Sub-Segment 1
        • 7.3.2. Sub-Segment 2
        • 7.3.3. Sub-Segment 3
        • 7.3.4. Others
      • 7.4. Market Analysis, Insights and Forecast – By Segment 3
        • 7.4.1. Sub-Segment 1
        • 7.4.2. Sub-Segment 2
        • 7.4.3. Sub-Segment 3
        • 7.4.4. Others
      • 7.5. Insights and Forecast – By Country
        • 7.5.1. Brazil
        • 7.5.2. Mexico
        • 7.5.3. Rest of Latin America

      8. Europe 3D Neuroscience Market Analysis (USD Billion), Insights and Forecast, 2018-2029

      • 8.1. Key Findings / Summary
      • 8.2. Market Analysis, Insights and Forecast – By Segment 1
        • 8.2.1. Sub-Segment 1
        • 8.2.2. Sub-Segment 2
      • 8.3. Market Analysis, Insights and Forecast – By Segment 2
        • 8.3.1. Sub-Segment 1
        • 8.3.2. Sub-Segment 2
        • 8.3.3. Sub-Segment 3
        • 8.3.4. Others
      • 8.4. Market Analysis, Insights and Forecast – By Segment 3
        • 8.4.1. Sub-Segment 1
        • 8.4.2. Sub-Segment 2
        • 8.4.3. Sub-Segment 3
        • 8.4.4. Others
      • 8.5. Market Analysis, Insights and Forecast – By Country
        • 8.5.1. UK
        • 8.5.2. Germany
        • 8.5.3. France
        • 8.5.4. Italy
        • 8.5.5. Spain
        • 8.5.6. Russia
        • 8.5.7. Rest of Europe

      9. Asia Pacific 3D Neuroscience Market Analysis (USD Billion), Insights and Forecast, 2018-2029

      • 9.1. Key Findings / Summary
      • 9.2. Market Analysis, Insights and Forecast – By Segment 1
        • 9.2.1. Sub-Segment 1
        • 9.2.2. Sub-Segment 2
      • 9.3. Market Analysis, Insights and Forecast – By Segment 2
        • 9.3.1. Sub-Segment 1
        • 9.3.2. Sub-Segment 2
        • 9.3.3. Sub-Segment 3
        • 9.3.4. Others
      • 9.4. Market Analysis, Insights and Forecast – By Segment 3
        • 9.4.1. Sub-Segment 1
        • 9.4.2. Sub-Segment 2
        • 9.4.3. Sub-Segment 3
        • 9.4.4. Others
      • 9.5. Market Analysis, Insights and Forecast – By Country
        • 9.5.1. China
        • 9.5.2. India
        • 9.5.3. Japan
        • 9.5.4. Australia
        • 9.5.5. South East Asia
        • 9.5.6. Rest of Asia Pacific

      10. Middle East & Africa 3D Neuroscience Market Analysis (USD Billion), Insights and Forecast, 2018-2029

      • 10.1. Key Findings / Summary
      • 10.2. Market Analysis, Insights and Forecast – By Segment 1
        • 10.2.1. Sub-Segment 1
        • 10.2.2. Sub-Segment 2
      • 10.3. Market Analysis, Insights and Forecast – By Segment 2
        • 10.3.1. Sub-Segment 1
        • 10.3.2. Sub-Segment 2
        • 10.3.3. Sub-Segment 3
        • 10.3.4. Others
      • 10.4. Market Analysis, Insights and Forecast – By Segment 3
        • 10.4.1. Sub-Segment 1
        • 10.4.2. Sub-Segment 2
        • 10.4.3. Sub-Segment 3
        • 10.4.4. Others
      • 10.5. Market Analysis, Insights and Forecast – By Country
        • 10.5.1. GCC
        • 10.5.2. South Africa
        • 10.5.3. Rest of Middle East & Africa

      11. Competitive Analysis

      • 11.1. Company Market Share Analysis, 2018
      • 11.2. Key Industry Developments
      • 11.3. Company Profile
        • 11.3.1. Company 1
          • 11.3.1.1. Business Overview
          • 11.3.1.2. Segment 1 & Service Offering
          • 11.3.1.3. Overall Revenue
          • 11.3.1.4. Geographic Presence
          • 11.3.1.5. Recent Development
        *Similar details will be provided for the following companies
        • 11.3.2. Company 2
        • 11.3.3. Company 3
        • 11.3.4. Company 4
        • 11.3.5. Company 5
        • 11.3.6. Company 6
        • 11.3.7. Company 7
        • 11.3.8. Company 8
        • 11.3.9. Company 9
        • 11.3.10. Company 10
        • 11.3.11. Company 11
        • 11.3.12. Company 12
      List of Figures

      Figure 1: Global 3D Neuroscience Market Revenue Breakdown (USD Billion, %) by Region, 2022 & 2029
      Figure 2: Global 3D Neuroscience Market Value Share (%), By Segment 1, 2022 & 2029
      Figure 3: Global 3D Neuroscience Market Forecast (USD Billion), by Sub-Segment 1, 2018-2029
      Figure 4: Global 3D Neuroscience Market Forecast (USD Billion), by Sub-Segment 2, 2018-2029
      Figure 5: Global 3D Neuroscience Market Value Share (%), By Segment 2, 2022 & 2029
      Figure 6: Global 3D Neuroscience Market Forecast (USD Billion), by Sub-Segment 1, 2018-2029
      Figure 7: Global 3D Neuroscience Market Forecast (USD Billion), by Sub-Segment 2, 2018-2029
      Figure 8: Global 3D Neuroscience Market Forecast (USD Billion), by Sub-Segment 3, 2018-2029
      Figure 9: Global 3D Neuroscience Market Forecast (USD Billion), by Others, 2018-2029
      Figure 10: Global 3D Neuroscience Market Value Share (%), By Segment 3, 2022 & 2029
      Figure 11: Global 3D Neuroscience Market Forecast (USD Billion), by Sub-Segment 1, 2018-2029
      Figure 12: Global 3D Neuroscience Market Forecast (USD Billion), by Sub-Segment 2, 2018-2029
      Figure 13: Global 3D Neuroscience Market Forecast (USD Billion), by Sub-Segment 3, 2018-2029
      Figure 14: Global 3D Neuroscience Market Forecast (USD Billion), by Others, 2018-2029
      Figure 15: Global 3D Neuroscience Market Value (USD Billion), by Region, 2022 & 2029
      Figure 16: North America 3D Neuroscience Market Value Share (%), By Segment 1, 2022 & 2029
      Figure 17: North America 3D Neuroscience Market Forecast (USD Billion), by Sub-Segment 1, 2018-2029
      Figure 18: North America 3D Neuroscience Market Forecast (USD Billion), by Sub-Segment 2, 2018-2029
      Figure 19: North America 3D Neuroscience Market Value Share (%), By Segment 2, 2022 & 2029
      Figure 20: North America 3D Neuroscience Market Forecast (USD Billion), by Sub-Segment 1, 2018-2029
      Figure 21: North America 3D Neuroscience Market Forecast (USD Billion), by Sub-Segment 2, 2018-2029
      Figure 22: North America 3D Neuroscience Market Forecast (USD Billion), by Sub-Segment 3, 2018-2029
      Figure 23: North America 3D Neuroscience Market Forecast (USD Billion), by Others, 2018-2029
      Figure 24: North America 3D Neuroscience Market Value Share (%), By Segment 3, 2022 & 2029
      Figure 25: North America 3D Neuroscience Market Forecast (USD Billion), by Sub-Segment 1, 2018-2029
      Figure 26: North America 3D Neuroscience Market Forecast (USD Billion), by Sub-Segment 2, 2018-2029
      Figure 27: North America 3D Neuroscience Market Forecast (USD Billion), by Sub-Segment 3, 2018-2029
      Figure 28: North America 3D Neuroscience Market Forecast (USD Billion), by Others, 2018-2029
      Figure 29: North America 3D Neuroscience Market Forecast (USD Billion), by U.S., 2018-2029
      Figure 30: North America 3D Neuroscience Market Forecast (USD Billion), by Canada, 2018-2029
      Figure 31: Latin America 3D Neuroscience Market Value Share (%), By Segment 1, 2022 & 2029
      Figure 32: Latin America 3D Neuroscience Market Forecast (USD Billion), by Sub-Segment 1, 2018-2029
      Figure 33: Latin America 3D Neuroscience Market Forecast (USD Billion), by Sub-Segment 2, 2018-2029
      Figure 34: Latin America 3D Neuroscience Market Value Share (%), By Segment 2, 2022 & 2029
      Figure 35: Latin America 3D Neuroscience Market Forecast (USD Billion), by Sub-Segment 1, 2018-2029
      Figure 36: Latin America 3D Neuroscience Market Forecast (USD Billion), by Sub-Segment 2, 2018-2029
      Figure 37: Latin America 3D Neuroscience Market Forecast (USD Billion), by Sub-Segment 3, 2018-2029
      Figure 38: Latin America 3D Neuroscience Market Forecast (USD Billion), by Others, 2018-2029
      Figure 39: Latin America 3D Neuroscience Market Value Share (%), By Segment 3, 2022 & 2029
      Figure 40: Latin America 3D Neuroscience Market Forecast (USD Billion), by Sub-Segment 1, 2018-2029
      Figure 41: Latin America 3D Neuroscience Market Forecast (USD Billion), by Sub-Segment 2, 2018-2029
      Figure 42: Latin America 3D Neuroscience Market Forecast (USD Billion), by Sub-Segment 3, 2018-2029
      Figure 43: Latin America 3D Neuroscience Market Forecast (USD Billion), by Others, 2018-2029
      Figure 44: Latin America 3D Neuroscience Market Forecast (USD Billion), by Brazil, 2018-2029
      Figure 45: Latin America 3D Neuroscience Market Forecast (USD Billion), by Mexico, 2018-2029
      Figure 46: Latin America 3D Neuroscience Market Forecast (USD Billion), by Rest of Latin America, 2018-2029
      Figure 47: Europe 3D Neuroscience Market Value Share (%), By Segment 1, 2022 & 2029
      Figure 48: Europe 3D Neuroscience Market Forecast (USD Billion), by Sub-Segment 1, 2018-2029
      Figure 49: Europe 3D Neuroscience Market Forecast (USD Billion), by Sub-Segment 2, 2018-2029
      Figure 50: Europe 3D Neuroscience Market Value Share (%), By Segment 2, 2022 & 2029
      Figure 51: Europe 3D Neuroscience Market Forecast (USD Billion), by Sub-Segment 1, 2018-2029
      Figure 52: Europe 3D Neuroscience Market Forecast (USD Billion), by Sub-Segment 2, 2018-2029
      Figure 53: Europe 3D Neuroscience Market Forecast (USD Billion), by Sub-Segment 3, 2018-2029
      Figure 54: Europe 3D Neuroscience Market Forecast (USD Billion), by Others, 2018-2029
      Figure 55: Europe 3D Neuroscience Market Value Share (%), By Segment 3, 2022 & 2029
      Figure 56: Europe 3D Neuroscience Market Forecast (USD Billion), by Sub-Segment 1, 2018-2029
      Figure 57: Europe 3D Neuroscience Market Forecast (USD Billion), by Sub-Segment 2, 2018-2029
      Figure 58: Europe 3D Neuroscience Market Forecast (USD Billion), by Sub-Segment 3, 2018-2029
      Figure 59: Europe 3D Neuroscience Market Forecast (USD Billion), by Others, 2018-2029
      Figure 60: Europe 3D Neuroscience Market Forecast (USD Billion), by U.K., 2018-2029
      Figure 61: Europe 3D Neuroscience Market Forecast (USD Billion), by Germany, 2018-2029
      Figure 62: Europe 3D Neuroscience Market Forecast (USD Billion), by France, 2018-2029
      Figure 63: Europe 3D Neuroscience Market Forecast (USD Billion), by Italy, 2018-2029
      Figure 64: Europe 3D Neuroscience Market Forecast (USD Billion), by Spain, 2018-2029
      Figure 65: Europe 3D Neuroscience Market Forecast (USD Billion), by Russia, 2018-2029
      Figure 66: Europe 3D Neuroscience Market Forecast (USD Billion), by Rest of Europe, 2018-2029
      Figure 67: Asia Pacific 3D Neuroscience Market Value Share (%), By Segment 1, 2022 & 2029
      Figure 68: Asia Pacific 3D Neuroscience Market Forecast (USD Billion), by Sub-Segment 1, 2018-2029
      Figure 69: Asia Pacific 3D Neuroscience Market Forecast (USD Billion), by Sub-Segment 2, 2018-2029
      Figure 70: Asia Pacific 3D Neuroscience Market Value Share (%), By Segment 2, 2022 & 2029
      Figure 71: Asia Pacific 3D Neuroscience Market Forecast (USD Billion), by Sub-Segment 1, 2018-2029
      Figure 72: Asia Pacific 3D Neuroscience Market Forecast (USD Billion), by Sub-Segment 2, 2018-2029
      Figure 73: Asia Pacific 3D Neuroscience Market Forecast (USD Billion), by Sub-Segment 3, 2018-2029
      Figure 74: Asia Pacific 3D Neuroscience Market Forecast (USD Billion), by Others, 2018-2029
      Figure 75: Asia Pacific 3D Neuroscience Market Value Share (%), By Segment 3, 2022 & 2029
      Figure 76: Asia Pacific 3D Neuroscience Market Forecast (USD Billion), by Sub-Segment 1, 2018-2029
      Figure 77: Asia Pacific 3D Neuroscience Market Forecast (USD Billion), by Sub-Segment 2, 2018-2029
      Figure 78: Asia Pacific 3D Neuroscience Market Forecast (USD Billion), by Sub-Segment 3, 2018-2029
      Figure 79: Asia Pacific 3D Neuroscience Market Forecast (USD Billion), by Others, 2018-2029
      Figure 80: Asia Pacific 3D Neuroscience Market Forecast (USD Billion), by China, 2018-2029
      Figure 81: Asia Pacific 3D Neuroscience Market Forecast (USD Billion), by India, 2018-2029
      Figure 82: Asia Pacific 3D Neuroscience Market Forecast (USD Billion), by Japan, 2018-2029
      Figure 83: Asia Pacific 3D Neuroscience Market Forecast (USD Billion), by Australia, 2018-2029
      Figure 84: Asia Pacific 3D Neuroscience Market Forecast (USD Billion), by Southeast Asia, 2018-2029
      Figure 85: Asia Pacific 3D Neuroscience Market Forecast (USD Billion), by Rest of Asia Pacific, 2018-2029
      Figure 86: Middle East & Africa 3D Neuroscience Market Value Share (%), By Segment 1, 2022 & 2029
      Figure 87: Middle East & Africa 3D Neuroscience Market Forecast (USD Billion), by Sub-Segment 1, 2018-2029
      Figure 88: Middle East & Africa 3D Neuroscience Market Forecast (USD Billion), by Sub-Segment 2, 2018-2029
      Figure 89: Middle East & Africa 3D Neuroscience Market Value Share (%), By Segment 2, 2022 & 2029
      Figure 90: Middle East & Africa 3D Neuroscience Market Forecast (USD Billion), by Sub-Segment 1, 2018-2029
      Figure 91: Middle East & Africa 3D Neuroscience Market Forecast (USD Billion), by Sub-Segment 2, 2018-2029
      Figure 92: Middle East & Africa 3D Neuroscience Market Forecast (USD Billion), by Sub-Segment 3, 2018-2029
      Figure 93: Middle East & Africa 3D Neuroscience Market Forecast (USD Billion), by Others, 2018-2029
      Figure 94: Middle East & Africa 3D Neuroscience Market Value Share (%), By Segment 3, 2022 & 2029
      Figure 95: Middle East & Africa 3D Neuroscience Market Forecast (USD Billion), by Sub-Segment 1, 2018-2029
      Figure 96: Middle East & Africa 3D Neuroscience Market Forecast (USD Billion), by Sub-Segment 2, 2018-2029
      Figure 97: Middle East & Africa 3D Neuroscience Market Forecast (USD Billion), by Sub-Segment 3, 2018-2029
      Figure 98: Middle East & Africa 3D Neuroscience Market Forecast (USD Billion), by Others, 2018-2029
      Figure 99: Middle East & Africa 3D Neuroscience Market Forecast (USD Billion), by GCC, 2018-2029
      Figure 100: Middle East & Africa 3D Neuroscience Market Forecast (USD Billion), by South Africa, 2018-2029
      Figure 101: Middle East & Africa 3D Neuroscience Market Forecast (USD Billion), by Rest of Middle East & Africa, 2018-2029 
      List of Tables
      Table 1: Global 3D Neuroscience Market Revenue (USD Billion) Forecast, by Segment 1, 2018-2029
      Table 2: Global 3D Neuroscience Market Revenue (USD Billion) Forecast, by Segment 2, 2018-2029
      Table 3: Global 3D Neuroscience Market Revenue (USD Billion) Forecast, by Segment 3, 2018-2029
      Table 4: Global 3D Neuroscience Market Revenue (USD Billion) Forecast, by Region, 2018-2029
      Table 5: North America 3D Neuroscience Market Revenue (USD Billion) Forecast, by Segment 1, 2018-2029
      Table 6: North America 3D Neuroscience Market Revenue (USD Billion) Forecast, by Segment 2, 2018-2029
      Table 7: North America 3D Neuroscience Market Revenue (USD Billion) Forecast, by Segment 3, 2018-2029
      Table 8: North America 3D Neuroscience Market Revenue (USD Billion) Forecast, by Country, 2018-2029
      Table 9: Europe 3D Neuroscience Market Revenue (USD Billion) Forecast, by Segment 1, 2018-2029
      Table 10: Europe 3D Neuroscience Market Revenue (USD Billion) Forecast, by Segment 2, 2018-2029
      Table 11: Europe 3D Neuroscience Market Revenue (USD Billion) Forecast, by Segment 3, 2018-2029
      Table 12: Europe 3D Neuroscience Market Revenue (USD Billion) Forecast, by Country, 2018-2029
      Table 13: Latin America 3D Neuroscience Market Revenue (USD Billion) Forecast, by Segment 1, 2018-2029
      Table 14: Latin America 3D Neuroscience Market Revenue (USD Billion) Forecast, by Segment 2, 2018-2029
      Table 15: Latin America 3D Neuroscience Market Revenue (USD Billion) Forecast, by Segment 3, 2018-2029
      Table 16: Latin America 3D Neuroscience Market Revenue (USD Billion) Forecast, by Country, 2018-2029
      Table 17: Asia Pacific 3D Neuroscience Market Revenue (USD Billion) Forecast, by Segment 1, 2018-2029
      Table 18: Asia Pacific 3D Neuroscience Market Revenue (USD Billion) Forecast, by Segment 2, 2018-2029
      Table 19: Asia Pacific 3D Neuroscience Market Revenue (USD Billion) Forecast, by Segment 3, 2018-2029
      Table 20: Asia Pacific 3D Neuroscience Market Revenue (USD Billion) Forecast, by Country, 2018-2029
      Table 21: Middle East & Africa 3D Neuroscience Market Revenue (USD Billion) Forecast, by Segment 1, 2018-2029
      Table 22: Middle East & Africa 3D Neuroscience Market Revenue (USD Billion) Forecast, by Segment 2, 2018-2029
      Table 23: Middle East & Africa 3D Neuroscience Market Revenue (USD Billion) Forecast, by Segment 3, 2018-2029
      Table 24: Middle East & Africa 3D Neuroscience Market Revenue (USD Billion) Forecast, by Country, 2018-2029
      Research Process

      Data Library Research are conducted by industry experts who offer insight on industry structure, market segmentations technology assessment and competitive landscape (CL), and penetration, as well as on emerging trends. Their analysis is based on primary interviews (~ 80%) and secondary research (~ 20%) as well as years of professional expertise in their respective industries. Adding to this, by analysing historical trends and current market positions, our analysts predict where the market will be headed for the next five years. Furthermore, the varying trends of segment & categories geographically presented are also studied and the estimated based on the primary & secondary research.

      In this particular report from the supply side Data Library Research has conducted primary surveys (interviews) with the key level executives (VP, CEO’s, Marketing Director, Business Development Manager and SOFT) of the companies that active & prominent as well as the midsized organization

      FIGURE 1: DLR RESEARH PROCESS

      research-methodology1

      Primary Research

      Extensive primary research was conducted to gain a deeper insight of the market and industry performance. The analysis is based on both primary and secondary research as well as years of professional expertise in the respective industries.

      In addition to analysing current and historical trends, our analysts predict where the market is headed over the next five years.

      It varies by segment for these categories geographically presented in the list of market tables. Speaking about this particular report we have conducted primary surveys (interviews) with the key level executives (VP, CEO’s, Marketing Director, Business Development Manager and many more) of the major players active in the market.

      Secondary Research

      Secondary research was mainly used to collect and identify information useful for the extensive, technical, market-oriented, and Friend’s study of the Global Extra Neutral Alcohol. It was also used to obtain key information about major players, market classification and segmentation according to the industry trends, geographical markets, and developments related to the market and technology perspectives. For this study, analysts have gathered information from various credible sources, such as annual reports, sec filings, journals, white papers, SOFT presentations, and company web sites.

      Market Size Estimation

      Both, top-down and bottom-up approaches were used to estimate and validate the size of the Global market and to estimate the size of various other dependent submarkets in the overall Extra Neutral Alcohol. The key players in the market were identified through secondary research and their market contributions in the respective geographies were determined through primary and secondary research.

      Forecast Model

      research-methodology2

      Happy to Assist You

      If you have a question?

      info@datalibraryresearch.com

      IND : +91 955 279 0357

      Browse Related Reports