Get Complete Analysis Of The Report - Download Updated Free Sample PDF
The Global 3D Printed Clear Dental Aligners Market encompasses the production, distribution, and sales of transparent orthodontic devices created using advanced 3D printing technology. These aligners offer a discreet and customizable alternative to traditional metal braces for teeth straightening and dental correction. The market is driven by rising consumer demand for aesthetic and comfortable orthodontic treatments, technological advancements in 3D printing, and increasing awareness of oral health. Additionally, the ability to quickly produce personalized aligners with precision has enhanced treatment efficiency and patient satisfaction. Growth is supported by expanding dental care infrastructure, rising disposable incomes, and the adoption of digital dentistry worldwide, making this market a rapidly evolving segment within the broader orthodontics and dental devices industry.
The global 3D printed clear dental aligners market is witnessing rapid growth fueled by increasing demand for aesthetic, comfortable, and removable orthodontic treatments. Technological advancements in 3D printing have enabled faster, more precise, and cost-effective production of customized aligners, enhancing treatment outcomes. Digital dentistry, including intraoral scanning and AI-driven treatment planning, is streamlining workflows and improving patient experience. Rising awareness of oral health and cosmetic dentistry, coupled with a growing preference for minimally invasive procedures, further propels market expansion.
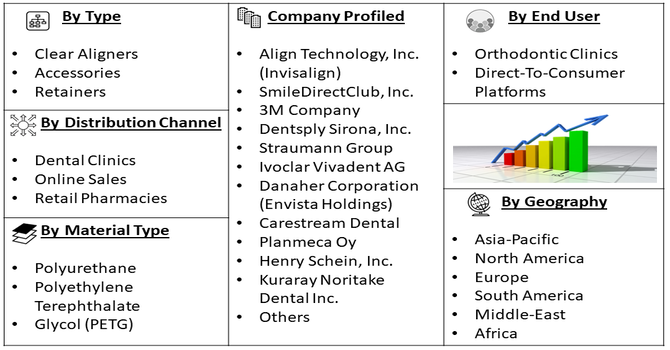
Segmentation: The Global 3D Printed Clear Dental Aligners Market is Segmented by Product Type (Clear Aligners and Accessories, and Retainers), Material Type (Polyurethane and Polyethylene Terephthalate Glycol (PETG)), End-User (Orthodontic Clinics, and Direct-To-Consumer Platforms), Distribution Channel (Dental Clinics, Online Sales, and Retail Pharmacies) and Geography (North America, Europe, Asia-Pacific, Middle East and Africa, and South America). The report provides the value (in USD million) for the above segments.
For Detailed Market Segmentation - Get a Free Sample PDF
Market Drivers:
The shift toward discreet, comfortable orthodontic treatments continues to drive demand for clear dental aligners. Unlike traditional metal braces, clear aligners are nearly invisible, removable, and more convenient for daily life—making them especially attractive to adults and image-conscious teens. As awareness of dental aesthetics grows, so does the preference for non-invasive, patient-friendly solutions. 3D printing enhances this by enabling fast, precise, and personalized aligner production. The combination of improved patient experience and faster turnaround times is encouraging wider adoption among dental professionals and consumers alike, positioning clear aligners as a mainstream choice in modern orthodontics and fueling robust market growth. Advancements in 3D Printing and Digital Dentistry
Rapid innovation in 3D printing and digital dental workflows is transforming how orthodontic treatments are delivered. Intraoral scanning, AI-powered treatment planning, and high-resolution 3D printers now allow dental professionals to produce customized aligners with greater accuracy, speed, and efficiency.
In July 2025, Carestream Dental announced that its CS 9600 and CS 8200 3D CBCT systems became the first CBCT imaging units certified by the Digital Dentistry Society (DDS), following a rigorous evaluation of manufacturing quality, innovation, and scientific backing. The certification validated their seamless integration into digital workflows and clinical reliability. This recognition reinforced Carestream’s leadership in digital dental imaging. The achievement positively impacted the Global 3D Printed Clear Dental Aligners Market by advancing diagnostic precision and accelerating the adoption of fully digital orthodontic workflows, further supporting the broader evolution of 3D printing and digital dentistry. These advancements reduce manual labor, streamline clinical processes, and cut turnaround times—benefiting both clinics and patients. As the technology becomes more accessible and cost-effective, adoption is accelerating even among smaller dental practices.
Market Restraints:
Despite strong market momentum, the high cost of clear aligner treatment and limited access to advanced digital equipment remain key challenges. In many developing regions, the upfront investment in 3D printers, scanners, and specialized software is still a barrier for smaller clinics. Additionally, patients often face out-of-pocket expenses, as aligners are typically not covered by public healthcare or insurance in many countries. This limits adoption outside of urban or high-income areas. Without broader affordability and accessibility initiatives—such as low-cost solutions or scalable teleorthodontics—the market risks remaining concentrated in developed economies, slowing its global expansion potential.
The rise of 3D printed clear dental aligners has had significant socioeconomic impacts by democratizing access to orthodontic care. These aligners offer a less invasive, more affordable, and visually appealing alternative to traditional braces, boosting patient confidence and oral health awareness. Improved treatment accessibility reduces the need for frequent dental visits, benefiting working professionals and busy individuals. Moreover, advancements in digital dentistry create new job opportunities in dental technology and manufacturing sectors. However, cost and access disparities remain in low-income regions, limiting universal adoption. Thus, the market supports healthier smiles and enhances quality of life while contributing to economic growth through innovation, workforce development, and expansion of dental care infrastructure globally.
Segmental Analysis:
The clear aligners segment is expected to witness the highest growth over the forecast period due to rising consumer preference for discreet, comfortable orthodontic solutions over traditional braces. Increasing awareness of oral aesthetics, particularly among teens and adults, is driving demand for clear aligners. Technological advancements in 3D printing and AI-based treatment planning are enabling faster, more precise aligner production. The popularity of direct-to-consumer models and increased access to orthodontic care further fuel market expansion. Clear aligners also offer removable, hygienic, and pain-minimized treatment options, enhancing patient satisfaction and compliance—making them the fastest-growing segment in the global dental aligner market.
The polyurethane segment is expected to witness the highest growth over the forecast period, driven by its superior flexibility, durability, and biocompatibility. Polyurethane-based clear aligners offer greater comfort, higher transparency, and better resistance to stains and deformation compared to other materials. These qualities improve the effectiveness and aesthetic appeal of the aligners, making them more attractive to both patients and practitioners. Additionally, advancements in material science have led to the development of medical-grade thermoplastic polyurethanes ideal for long-term intraoral use. With the increasing demand for high-performance, patient-friendly materials in orthodontics, polyurethane is becoming the material of choice in the clear aligner production process.
The orthodontic clinics segment is expected to witness the highest growth over the forecast period due to the growing adoption of 3D printed aligners by orthodontic specialists. These clinics are equipped with advanced imaging and printing technologies that support customized aligner treatment plans. Patients often prefer treatment from certified orthodontists for complex dental corrections, ensuring clinical accuracy and expert supervision. The increasing availability of in-house 3D printing and digital workflow integration has enabled orthodontic clinics to offer faster and more affordable services. As clear aligners become mainstream in orthodontic practice, the role of specialized clinics in delivering precise and personalized treatment is expanding significantly.
The dental clinics segment is projected to experience the highest growth during the forecast period as general dental practitioners increasingly adopt clear aligner technologies in everyday practice. With digital scanners and 3D printing becoming more accessible, dental clinics are now able to offer aligner treatments in-house or through partnerships with aligner manufacturers. This trend is expanding patient reach, especially in regions with fewer orthodontic specialists. As awareness of cosmetic dentistry rises, patients are turning to their regular dental providers for alignment correction, boosting adoption. The integration of digital dentistry into routine dental care is expected to significantly increase the market share of this segment.
North America is expected to witness the highest growth in the 3D printed clear dental aligners market over the forecast period, driven by advanced dental infrastructure, high disposable incomes, and early adoption of digital technologies.
The U.S. leads in clear aligner usage due to a strong presence of market leaders like Align Technology and increasing consumer awareness of cosmetic dental treatments. Favorable reimbursement policies, growing demand for aesthetic treatments, and a well-established teleorthodontics ecosystem further support market expansion. For instance, in November 2024, Solventum (formerly 3M Health Care) launched its 3M Clarity Precision Grip Attachments, an innovation designed to enhance durability, precision, and stain resistance in aligner attachments. Exclusively compatible with 3M Clarity Aligners, the product addressed a key challenge in aligner treatment effectiveness. This advancement improved grip and clinical outcomes, offering greater confidence to both providers and patients. It positively impacted the Global 3D Printed Clear Dental Aligners Market by elevating treatment performance standards and reinforcing trust in next-generation aligner solutions.
Additionally, a rise in adult orthodontic cases and increased marketing by DTC brands have fueled consumer demand, solidifying North America’s position as the dominant growth region. For instance, in 2025, Bernstein Orthodontics reported a notable rise in adult orthodontic treatment in Cary, with adults in their 30s to 50s increasingly seeking options like clear aligners and ceramic braces. The report highlighted that 27% of all orthodontic patients in the U.S. and Canada were adults. This shift reflected growing awareness of both oral health and aesthetic benefits among older age groups. The trend significantly boosted demand for discreet, convenient solutions, positively impacting the U.S. segment of the Global 3D Printed Clear Dental Aligners Market.
| Report Matrics | Details |
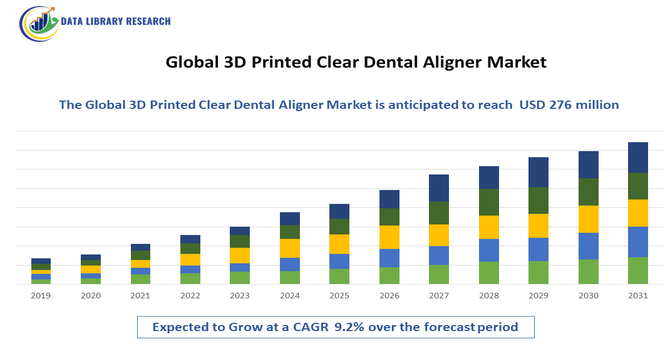
| Market Size Value | USD 276 million |
| Growth Rate | CAGR of9.2% |
| Forecast | 2026-2033 |
| Historical data | 2021-2024 |
| Base Year | 2025 |
| Report Coverage | Forecasted revenue, company rating, competitive environment, growth drivers, and trends |
| Segment Coverage | Type, Application, End-User, Geography |
| Regional Scope | North America, Europe, Asia Pacific, Middle East |
| Customized scope | Free customization of reports (With 3 months Analysis Support ) |
| To Learn More About This Report | Request a Free Sample Copy |
The competitive landscape of the 3D printed clear dental aligners market is highly dynamic, featuring major players like Align Technology (Invisalign), SmileDirectClub, 3M, Dentsply Sirona, and Straumann. These companies compete through innovation, precision manufacturing, and expanding product portfolios. Startups and regional players are also emerging, leveraging cost-effective 3D printing solutions and direct-to-consumer models to gain market share. Strategic partnerships with dental clinics, technology providers, and investments in R&D drive differentiation. Mergers, acquisitions, and collaborations are common as firms aim to enhance digital capabilities and expand geographically. The market’s competitive intensity encourages continuous improvements in material science, software integration, and patient engagement, ensuring ongoing technological advancements and improved orthodontic care.
The 20 major players for above market are:
Recent Development
Q1. What the main growth driving factors for this market?
The market's growth is primarily driven by the increasing global demand for aesthetic orthodontic solutions, particularly among adults who prefer discreet teeth straightening methods over traditional metal braces. This preference is strongly supported by continuous technological advancements in 3D printing and CAD/CAM technologies, enabling the precise and rapid manufacturing of highly customized aligners. Furthermore, the rising prevalence of malocclusion and other dental irregularities worldwide, coupled with growing consumer awareness and disposable incomes, makes clear aligners a highly appealing and accessible option, accelerating market expansion.
Q2. What are the main restraining factors for this market?
Key restraining factors primarily revolve around cost and expertise. The substantial initial high cost of treatment compared to conventional braces makes it unaffordable for price-sensitive demographics and limits broader adoption in developing regions. Additionally, the successful utilization of 3D printing technology requires a skilled labor force and significant upfront investment in high-resolution printing equipment, which poses a financial barrier for small- and medium-sized dental laboratories and practices. Regulatory hurdles and concerns over the quality control of direct-to-consumer (DTC) models also temper growth.
Q3. Which segment is expected to witness high growth?
The Teenagers segment is anticipated to witness the highest growth rate over the forecast period. While the Adults segment currently holds the largest market share, growing preferences among teenagers for invisible and comfortable orthodontic treatments—to avoid the stigma and discomfort of metal braces—are fueling this rapid expansion. The ability of 3D-printed aligners to effectively treat common malocclusions in this age group, combined with rising parental willingness to invest in aesthetic dental solutions, makes the Teenagers segment the most dynamic and fastest-growing market category.
Q4. Who are the top major players for this market?
The global market for 3D printed clear dental aligners is dominated by a few key players who leverage advanced digital dentistry ecosystems. The top major players include Align Technology (Invisalign), which holds a dominant market share due to its strong brand and extensive digital treatment planning, Envista Holdings Corporation (Spark), and Institut Straumann AG (ClearCorrect). Other significant companies contributing to market competition and innovation are Dentsply Sirona, 3M, and Henry Schein. These leaders drive growth through technological innovation, strategic acquisitions, and expanding their global distribution networks.
Q5. Which country is the largest player?
The United States (US), within the North America region, is the largest and most dominant country in the 3D printed clear dental aligners market. This leadership is attributed to several factors: a sophisticated healthcare infrastructure, the highest consumer awareness and adoption rate for premium and aesthetic dental treatments, and the strong local presence of global industry leaders like Align Technology. High per capita healthcare expenditure, a significant focus on digital dentistry innovation, and favorable regulatory support further cement the US's position as the primary revenue generator globally.
Data Library Research are conducted by industry experts who offer insight on industry structure, market segmentations technology assessment and competitive landscape (CL), and penetration, as well as on emerging trends. Their analysis is based on primary interviews (~ 80%) and secondary research (~ 20%) as well as years of professional expertise in their respective industries. Adding to this, by analysing historical trends and current market positions, our analysts predict where the market will be headed for the next five years. Furthermore, the varying trends of segment & categories geographically presented are also studied and the estimated based on the primary & secondary research.
In this particular report from the supply side Data Library Research has conducted primary surveys (interviews) with the key level executives (VP, CEO’s, Marketing Director, Business Development Manager and SOFT) of the companies that active & prominent as well as the midsized organization
FIGURE 1: DLR RESEARH PROCESS
Extensive primary research was conducted to gain a deeper insight of the market and industry performance. The analysis is based on both primary and secondary research as well as years of professional expertise in the respective industries.
In addition to analysing current and historical trends, our analysts predict where the market is headed over the next five years.
It varies by segment for these categories geographically presented in the list of market tables. Speaking about this particular report we have conducted primary surveys (interviews) with the key level executives (VP, CEO’s, Marketing Director, Business Development Manager and many more) of the major players active in the market.
Secondary ResearchSecondary research was mainly used to collect and identify information useful for the extensive, technical, market-oriented, and Friend’s study of the Global Extra Neutral Alcohol. It was also used to obtain key information about major players, market classification and segmentation according to the industry trends, geographical markets, and developments related to the market and technology perspectives. For this study, analysts have gathered information from various credible sources, such as annual reports, sec filings, journals, white papers, SOFT presentations, and company web sites.
Market Size EstimationBoth, top-down and bottom-up approaches were used to estimate and validate the size of the Global market and to estimate the size of various other dependent submarkets in the overall Extra Neutral Alcohol. The key players in the market were identified through secondary research and their market contributions in the respective geographies were determined through primary and secondary research.
Forecast Model