ADB and DLP Technology in Automobile Industry Market Overview and Analysis:
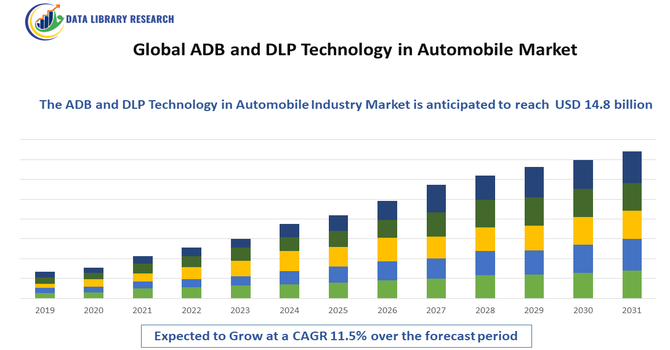
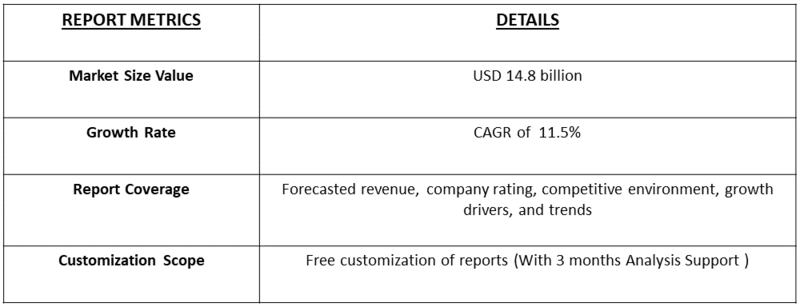
- The Global ADB (Adaptive Driving Beam) and DLP (Digital Light Processing) Technology in Automobile Market size is estimated to be USD 6.62 billion in 2025 and is expected to reach USD 14.8 billion by 2032 at a CAGR of 11.5% from 2025 to 2032.
Get Complete Analysis Of The Report - Download Updated Free Sample PDF
The Global ADB (Adaptive Driving Beam) and DLP (Digital Light Processing) Technology in the Automobile Industry Market refers to the sector focused on advanced automotive lighting solutions that enhance driver visibility and safety. ADB automatically adjusts headlights to avoid blinding oncoming traffic, while DLP enables precise, high-resolution light projection. Growing adoption of smart lighting in vehicles, increasing road safety regulations, and consumer preference for technologically advanced cars are driving market expansion worldwide.
The growth of the Global ADB (Adaptive Driving Beam) and DLP (Digital Light Processing) technology market in the automobile industry is driven by increasing vehicle safety regulations and consumer demand for advanced lighting solutions. Automotive manufacturers are adopting these technologies to enhance night driving visibility, reduce glare for oncoming traffic, and improve overall safety.
ADB and DLP Technology in the Automobile Industry Market: Latest Trends
Automotive lighting is rapidly evolving with widespread adoption of Adaptive Driving Beam (ADB) and Digital Light Processing (DLP) systems, as manufacturers integrate AI and sensor-based control into headlamps. There’s a strong shift toward energy-efficient LED, laser, and micro-LED solutions that offer pixel-level light control and dynamic beam shaping. These systems are increasingly combined with ADAS for heightened safety. Growth is especially strong in EVs, where lighting performance and power consumption are critical. Regulatory pressure on vehicle lighting standards is further accelerating adoption globally.
Segmentation: The Global ADB (Adaptive Driving Beam) and DLP (Digital Light Processing) Technology in Automobile Market is Segmented by Core Technology (Adaptive Driving Beam (ADB), and Digital Light Processing (DLP) Headlights (High-Resolution)), Component (LED/Laser Light Sources, Sensors & Cameras, Electronic Control Units (ECUs) & Software and Micro-Mirror Device (MMD)), Vehicle Type (Passenger Vehicles (Luxury & Premium Vehicles (Highest Penetration) and Mid-Range Vehicles (Growing Penetration)), and Commercial Vehicles), and Geography (North America, Europe, Asia-Pacific, Middle East and Africa, and South America). The report provides the value (in USD million) for the above segments.

For Detailed Market Segmentation - Get a Free Sample PDF
Market Drivers:
- Global Push for Advanced Automotive Safety Standar
The most significant driver is the increasing regulatory and consumer emphasis on active safety features that directly mitigate collision risks, especially during nighttime driving where over 50% of fatal accidents occur. ADB and DLP systems directly address this by maximizing road illumination without causing glare to other drivers. Governments in regions like Europe and recently North America are updating decades-old regulations to permit and even encourage these dynamic beam technologies, creating a clear path for OEM adoption across mid-range and premium models. This regulatory alignment, coupled with consumer demand for high-tech safety features, is accelerating market growth.
- Integration of Lighting with ADAS and Autonomous Systems
The growth of the ADB and DLP market is fundamentally linked to the proliferation of Advanced Driver-Assistance Systems (ADAS) and the eventual shift toward autonomous vehicles. These intelligent lighting systems rely on the same sensor data (cameras, LiDAR, radar) used by ADAS for functions like lane-keeping and emergency braking. High-resolution DLP in particular is viewed as an essential communication layer for autonomous vehicles, enabling features like projecting navigation guidelines onto the road surface or warning pedestrians of the vehicle's intent. This seamless integration into the vehicle's sensor fusion architecture positions adaptive lighting as a core necessity, not just an optional luxury feature.
Market Restraints:
- High System Cost and Regulatory Fragmentation
The major restraining factor is the premium price point associated with ADB and especially DLP systems. Integrating these complex, high-resolution lighting modules requires sophisticated micro-mirror arrays (for DLP), advanced heat management, and powerful processing ECUs, making them considerably more expensive than traditional LED or even fixed-matrix LED solutions. This high cost limits their adoption primarily to the luxury segment, slowing overall market penetration into mass-market vehicles. Furthermore, the lack of fully harmonized global regulations means manufacturers must develop costly region-specific hardware and software variations, hindering economies of scale and driving up development cost.
Socio Economic Impact on ADB and DLP Technology in the Automobile Industry Market
ADB and DLP lighting systems improve road safety by reducing glare, increasing visibility, and providing adaptive illumination based on traffic conditions. This helps lower accident rates and protects vulnerable road users. Their widespread adoption supports high skilled jobs in semiconductor, optics, and AI sectors. In premium vehicles, these lighting systems also enhance vehicle “feel,” contributing to consumer demand and boosting economic value per car. Moreover, energy-efficient lighting technology supports sustainability, particularly in electric vehicles, helping lower energy consumption and reduce environmental impact.
Segmental Analysis:
- Digital Light Processing (DLP) Headlights (High-Resolution) segment is expected to witness highest growth over the forecast period
The DLP headlights segment is expected to witness the highest growth due to increasing adoption of high-resolution, adaptive lighting systems that enhance night-time visibility and safety. These headlights provide precise beam shaping, reduce glare, and enable dynamic projection of symbols or warnings. As automakers integrate ADB and DLP technologies into advanced driver-assistance systems (ADAS) and autonomous driving solutions, demand for high-resolution DLP headlights is surging, especially in luxury and premium vehicles, driving market expansion over the forecast period.
- LED/Laser Light Sources segment is expected to witness highest growth over the forecast period
The LED and laser light source segment is projected to grow rapidly, driven by their superior energy efficiency, longevity, and brightness compared to traditional halogen or HID systems. These sources allow compact, flexible headlamp designs that support adaptive lighting and digital projection. Rising consumer preference for modern, efficient, and stylish automotive lighting, coupled with stringent vehicle safety regulations, is fueling adoption globally, particularly in premium and electric vehicles, making this segment a key growth driver.
- Luxury & Premium Vehicles (Highest Penetration) segment is expected to witness highest growth over the forecast period
Luxury and premium vehicles are expected to witness the highest penetration of ADB and DLP technologies, as these vehicles prioritize advanced safety, aesthetic lighting, and innovative features. Automakers integrate high-end adaptive headlights and intelligent lighting systems into these models to enhance driver experience, brand differentiation, and compliance with safety standards. Growing demand for connected and smart vehicles among affluent consumers accelerates the deployment of advanced lighting solutions in this segment, ensuring strong market growth over the forecast period.
- Europe Region is expected to witness highest growth over the forecast period
Europe is expected to dominate growth in the ADB and DLP automotive lighting market due to strict road safety regulations, high consumer awareness, and widespread adoption of premium and electric vehicles. For instance, in November 2025, Europe’s EV adoption, supported by strong automotive R&D capabilities, had continued to advance even as global EV sales growth slowed and hybrids gained momentum. In 2024, worldwide EV sales were projected at 16 million, rising from 14 million, with 54 million EVs in use globally. China had dominated the market, while the UK—the region’s second-largest EV hub—recorded about 500,000 EV sales, with EVs accounting for 22% of new vehicles and nearly half of SUV sales. The region’s automotive industry emphasizes advanced lighting technology, energy efficiency, and integration with ADAS systems.
Incentives for EV adoption, coupled with strong automotive R&D infrastructure, support innovation in DLP and adaptive lighting solutions. Consequently, Europe remains a key hub for technological advancement and market expansion in adaptive and high-resolution automotive lighting.
To Learn More About This Report - Request a Free Sample Copy
ADB and DLP Technology in Automobile Industry Market Competitive Landscape
The market is dominated by Tier 1 lighting suppliers and automotive innovation leaders, including Bosch, Valeo, Hella, Koito, OSRAM, and Stanley Electric. These companies are heavily investing in R&D to develop high-precision ADB and DLP modules with integrated AI beam control. Strategic partnerships between lighting firms and OEMs are common, enabling faster deployment in premium vehicles. Newer players and technology firms are pushing micro-LED and laser-based headlamp diversification. Competition centers on miniaturization, power efficiency, beam resolution, and regulatory compliance.
The major players for this market are:
- Koito Manufacturing Co., Ltd.
- Valeo S.A.
- HELLA GmbH & Co. KGaA
- Stanley Electric Co., Ltd.
- ams OSRAM
- Marelli Automotive Lighting
- Hyundai Mobis (Lighting Division)
- ZKW Group GmbH
- Varroc Lighting Systems
- Lumileds Holding B.V.
- Robert Bosch GmbH
- Denso Corporation
- Continental AG
- Nichia Corporation
- Renesas Electronics Corporation
- Infineon Technologies AG
- Panasonic Corporation (Automotive Lighting)
- Aptiv PLC
- Samsung Electronics (Automotive LEDs)
- Philips Automotive Lighting (Royal Philips N.V.)
Recent Development
- In September 2025, Driven by the growth of electric and intelligent vehicles, features such as integrated thermal-management systems (ITMS), ADB/AFS/DLP front-lighting, head-up displays (HUDs), and smart air-vent controls are shifting from premium options to standard expectations. These systems often depend on stepper-motor drivers. To meet rising demand, NOVOSENSE introduced the NSD8389-Q1, a second-generation high-performance automotive stepper motor driver, enabling OEMs and Tier-1 suppliers to achieve precise, reliable stepper motor control while supporting the transition toward advanced electric and intelligent vehicle technologies.
- In April 2025, Valeo, a global provider in automotive lighting systems, partnered with Appotronics, the creator of ALPD laser display technology, to develop next-generation automotive front lighting solutions. The collaboration combined Valeo’s expertise in lighting system design, electronic control units, and software capabilities with Appotronics’ advanced laser projection technology. Together, they integrated the ALL-in-ONE full-color laser headlight system into innovative front lighting solutions, enhancing performance, safety, and visual quality for modern vehicles.
Frequently Asked Questions (FAQ) :
Q1. What are the main growth-driving factors for this market?
The primary driver is the increasing focus on nighttime driving safety and the push to improve driver visibility without glare. Growth is also fueled by stricter global regulations allowing the use of advanced systems like ADB, which can dynamically reshape the beam pattern. Furthermore, premium and luxury automakers are adopting DLP-based systems to offer customizable light-based communication features.
Q2. What are the main restraining factors for this market?
A key constraint is the high manufacturing cost of the sophisticated DLP micro-mirror arrays and high-resolution sensor systems required for precise light control. The market also suffers from slow and fragmented regulatory harmonization, particularly in North America, which has lagged behind Europe in fully permitting ADB systems. Additionally, the complexity of integrating these systems with vehicle electronics poses technical challenges.
Q3. Which segment is expected to witness high growth?
The High-Resolution DLP Headlights Segment is projected to witness the highest growth. These systems use millions of micro-mirrors to project high-definition light patterns onto the road. Driven by luxury vehicle manufacturers, this technology offers superior safety through incredibly precise light-masking, and enables advanced communication features, such as projecting safety warnings or navigation guides directly onto the road surface.
Q4. Who are the top major players for this market?
The market is dominated by major automotive lighting suppliers and technology developers. Top major players include Hella GmbH & Co. KGaA, Valeo, Osram (now ams OSRAM), and Texas Instruments (DLP chip supplier). Competition centers on developing cost-effective, reliable modular designs that can easily integrate into different vehicle platforms, ensuring high brightness, durability, and compliance with the necessary functional safety standards.
Q5. Which country is the largest player?
Germany is arguably the largest player and key market influencer. German premium automakers (Mercedes-Benz, BMW, Audi) were pioneers in adopting and promoting advanced lighting technologies like ADB and high-resolution headlights, creating significant demand. Furthermore, the European regulatory environment was the first to fully embrace these technologies, establishing the initial market and technology standards for the rest of the world.
List of Figures
Figure 1: Global ADB and DLP Technology in Automobile Industry Market Revenue Breakdown (USD Billion, %) by Region, 2022 & 2029
Figure 2: Global ADB and DLP Technology in Automobile Industry Market Value Share (%), By Segment 1, 2022 & 2029
Figure 3: Global ADB and DLP Technology in Automobile Industry Market Forecast (USD Billion), by Sub-Segment 1, 2018-2029
Figure 4: Global ADB and DLP Technology in Automobile Industry Market Forecast (USD Billion), by Sub-Segment 2, 2018-2029
Figure 5: Global ADB and DLP Technology in Automobile Industry Market Value Share (%), By Segment 2, 2022 & 2029
Figure 6: Global ADB and DLP Technology in Automobile Industry Market Forecast (USD Billion), by Sub-Segment 1, 2018-2029
Figure 7: Global ADB and DLP Technology in Automobile Industry Market Forecast (USD Billion), by Sub-Segment 2, 2018-2029
Figure 8: Global ADB and DLP Technology in Automobile Industry Market Forecast (USD Billion), by Sub-Segment 3, 2018-2029
Figure 9: Global ADB and DLP Technology in Automobile Industry Market Forecast (USD Billion), by Others, 2018-2029
Figure 10: Global ADB and DLP Technology in Automobile Industry Market Value Share (%), By Segment 3, 2022 & 2029
Figure 11: Global ADB and DLP Technology in Automobile Industry Market Forecast (USD Billion), by Sub-Segment 1, 2018-2029
Figure 12: Global ADB and DLP Technology in Automobile Industry Market Forecast (USD Billion), by Sub-Segment 2, 2018-2029
Figure 13: Global ADB and DLP Technology in Automobile Industry Market Forecast (USD Billion), by Sub-Segment 3, 2018-2029
Figure 14: Global ADB and DLP Technology in Automobile Industry Market Forecast (USD Billion), by Others, 2018-2029
Figure 15: Global ADB and DLP Technology in Automobile Industry Market Value (USD Billion), by Region, 2022 & 2029
Figure 16: North America ADB and DLP Technology in Automobile Industry Market Value Share (%), By Segment 1, 2022 & 2029
Figure 17: North America ADB and DLP Technology in Automobile Industry Market Forecast (USD Billion), by Sub-Segment 1, 2018-2029
Figure 18: North America ADB and DLP Technology in Automobile Industry Market Forecast (USD Billion), by Sub-Segment 2, 2018-2029
Figure 19: North America ADB and DLP Technology in Automobile Industry Market Value Share (%), By Segment 2, 2022 & 2029
Figure 20: North America ADB and DLP Technology in Automobile Industry Market Forecast (USD Billion), by Sub-Segment 1, 2018-2029
Figure 21: North America ADB and DLP Technology in Automobile Industry Market Forecast (USD Billion), by Sub-Segment 2, 2018-2029
Figure 22: North America ADB and DLP Technology in Automobile Industry Market Forecast (USD Billion), by Sub-Segment 3, 2018-2029
Figure 23: North America ADB and DLP Technology in Automobile Industry Market Forecast (USD Billion), by Others, 2018-2029
Figure 24: North America ADB and DLP Technology in Automobile Industry Market Value Share (%), By Segment 3, 2022 & 2029
Figure 25: North America ADB and DLP Technology in Automobile Industry Market Forecast (USD Billion), by Sub-Segment 1, 2018-2029
Figure 26: North America ADB and DLP Technology in Automobile Industry Market Forecast (USD Billion), by Sub-Segment 2, 2018-2029
Figure 27: North America ADB and DLP Technology in Automobile Industry Market Forecast (USD Billion), by Sub-Segment 3, 2018-2029
Figure 28: North America ADB and DLP Technology in Automobile Industry Market Forecast (USD Billion), by Others, 2018-2029
Figure 29: North America ADB and DLP Technology in Automobile Industry Market Forecast (USD Billion), by U.S., 2018-2029
Figure 30: North America ADB and DLP Technology in Automobile Industry Market Forecast (USD Billion), by Canada, 2018-2029
Figure 31: Latin America ADB and DLP Technology in Automobile Industry Market Value Share (%), By Segment 1, 2022 & 2029
Figure 32: Latin America ADB and DLP Technology in Automobile Industry Market Forecast (USD Billion), by Sub-Segment 1, 2018-2029
Figure 33: Latin America ADB and DLP Technology in Automobile Industry Market Forecast (USD Billion), by Sub-Segment 2, 2018-2029
Figure 34: Latin America ADB and DLP Technology in Automobile Industry Market Value Share (%), By Segment 2, 2022 & 2029
Figure 35: Latin America ADB and DLP Technology in Automobile Industry Market Forecast (USD Billion), by Sub-Segment 1, 2018-2029
Figure 36: Latin America ADB and DLP Technology in Automobile Industry Market Forecast (USD Billion), by Sub-Segment 2, 2018-2029
Figure 37: Latin America ADB and DLP Technology in Automobile Industry Market Forecast (USD Billion), by Sub-Segment 3, 2018-2029
Figure 38: Latin America ADB and DLP Technology in Automobile Industry Market Forecast (USD Billion), by Others, 2018-2029
Figure 39: Latin America ADB and DLP Technology in Automobile Industry Market Value Share (%), By Segment 3, 2022 & 2029
Figure 40: Latin America ADB and DLP Technology in Automobile Industry Market Forecast (USD Billion), by Sub-Segment 1, 2018-2029
Figure 41: Latin America ADB and DLP Technology in Automobile Industry Market Forecast (USD Billion), by Sub-Segment 2, 2018-2029
Figure 42: Latin America ADB and DLP Technology in Automobile Industry Market Forecast (USD Billion), by Sub-Segment 3, 2018-2029
Figure 43: Latin America ADB and DLP Technology in Automobile Industry Market Forecast (USD Billion), by Others, 2018-2029
Figure 44: Latin America ADB and DLP Technology in Automobile Industry Market Forecast (USD Billion), by Brazil, 2018-2029
Figure 45: Latin America ADB and DLP Technology in Automobile Industry Market Forecast (USD Billion), by Mexico, 2018-2029
Figure 46: Latin America ADB and DLP Technology in Automobile Industry Market Forecast (USD Billion), by Rest of Latin America, 2018-2029
Figure 47: Europe ADB and DLP Technology in Automobile Industry Market Value Share (%), By Segment 1, 2022 & 2029
Figure 48: Europe ADB and DLP Technology in Automobile Industry Market Forecast (USD Billion), by Sub-Segment 1, 2018-2029
Figure 49: Europe ADB and DLP Technology in Automobile Industry Market Forecast (USD Billion), by Sub-Segment 2, 2018-2029
Figure 50: Europe ADB and DLP Technology in Automobile Industry Market Value Share (%), By Segment 2, 2022 & 2029
Figure 51: Europe ADB and DLP Technology in Automobile Industry Market Forecast (USD Billion), by Sub-Segment 1, 2018-2029
Figure 52: Europe ADB and DLP Technology in Automobile Industry Market Forecast (USD Billion), by Sub-Segment 2, 2018-2029
Figure 53: Europe ADB and DLP Technology in Automobile Industry Market Forecast (USD Billion), by Sub-Segment 3, 2018-2029
Figure 54: Europe ADB and DLP Technology in Automobile Industry Market Forecast (USD Billion), by Others, 2018-2029
Figure 55: Europe ADB and DLP Technology in Automobile Industry Market Value Share (%), By Segment 3, 2022 & 2029
Figure 56: Europe ADB and DLP Technology in Automobile Industry Market Forecast (USD Billion), by Sub-Segment 1, 2018-2029
Figure 57: Europe ADB and DLP Technology in Automobile Industry Market Forecast (USD Billion), by Sub-Segment 2, 2018-2029
Figure 58: Europe ADB and DLP Technology in Automobile Industry Market Forecast (USD Billion), by Sub-Segment 3, 2018-2029
Figure 59: Europe ADB and DLP Technology in Automobile Industry Market Forecast (USD Billion), by Others, 2018-2029
Figure 60: Europe ADB and DLP Technology in Automobile Industry Market Forecast (USD Billion), by U.K., 2018-2029
Figure 61: Europe ADB and DLP Technology in Automobile Industry Market Forecast (USD Billion), by Germany, 2018-2029
Figure 62: Europe ADB and DLP Technology in Automobile Industry Market Forecast (USD Billion), by France, 2018-2029
Figure 63: Europe ADB and DLP Technology in Automobile Industry Market Forecast (USD Billion), by Italy, 2018-2029
Figure 64: Europe ADB and DLP Technology in Automobile Industry Market Forecast (USD Billion), by Spain, 2018-2029
Figure 65: Europe ADB and DLP Technology in Automobile Industry Market Forecast (USD Billion), by Russia, 2018-2029
Figure 66: Europe ADB and DLP Technology in Automobile Industry Market Forecast (USD Billion), by Rest of Europe, 2018-2029
Figure 67: Asia Pacific ADB and DLP Technology in Automobile Industry Market Value Share (%), By Segment 1, 2022 & 2029
Figure 68: Asia Pacific ADB and DLP Technology in Automobile Industry Market Forecast (USD Billion), by Sub-Segment 1, 2018-2029
Figure 69: Asia Pacific ADB and DLP Technology in Automobile Industry Market Forecast (USD Billion), by Sub-Segment 2, 2018-2029
Figure 70: Asia Pacific ADB and DLP Technology in Automobile Industry Market Value Share (%), By Segment 2, 2022 & 2029
Figure 71: Asia Pacific ADB and DLP Technology in Automobile Industry Market Forecast (USD Billion), by Sub-Segment 1, 2018-2029
Figure 72: Asia Pacific ADB and DLP Technology in Automobile Industry Market Forecast (USD Billion), by Sub-Segment 2, 2018-2029
Figure 73: Asia Pacific ADB and DLP Technology in Automobile Industry Market Forecast (USD Billion), by Sub-Segment 3, 2018-2029
Figure 74: Asia Pacific ADB and DLP Technology in Automobile Industry Market Forecast (USD Billion), by Others, 2018-2029
Figure 75: Asia Pacific ADB and DLP Technology in Automobile Industry Market Value Share (%), By Segment 3, 2022 & 2029
Figure 76: Asia Pacific ADB and DLP Technology in Automobile Industry Market Forecast (USD Billion), by Sub-Segment 1, 2018-2029
Figure 77: Asia Pacific ADB and DLP Technology in Automobile Industry Market Forecast (USD Billion), by Sub-Segment 2, 2018-2029
Figure 78: Asia Pacific ADB and DLP Technology in Automobile Industry Market Forecast (USD Billion), by Sub-Segment 3, 2018-2029
Figure 79: Asia Pacific ADB and DLP Technology in Automobile Industry Market Forecast (USD Billion), by Others, 2018-2029
Figure 80: Asia Pacific ADB and DLP Technology in Automobile Industry Market Forecast (USD Billion), by China, 2018-2029
Figure 81: Asia Pacific ADB and DLP Technology in Automobile Industry Market Forecast (USD Billion), by India, 2018-2029
Figure 82: Asia Pacific ADB and DLP Technology in Automobile Industry Market Forecast (USD Billion), by Japan, 2018-2029
Figure 83: Asia Pacific ADB and DLP Technology in Automobile Industry Market Forecast (USD Billion), by Australia, 2018-2029
Figure 84: Asia Pacific ADB and DLP Technology in Automobile Industry Market Forecast (USD Billion), by Southeast Asia, 2018-2029
Figure 85: Asia Pacific ADB and DLP Technology in Automobile Industry Market Forecast (USD Billion), by Rest of Asia Pacific, 2018-2029
Figure 86: Middle East & Africa ADB and DLP Technology in Automobile Industry Market Value Share (%), By Segment 1, 2022 & 2029
Figure 87: Middle East & Africa ADB and DLP Technology in Automobile Industry Market Forecast (USD Billion), by Sub-Segment 1, 2018-2029
Figure 88: Middle East & Africa ADB and DLP Technology in Automobile Industry Market Forecast (USD Billion), by Sub-Segment 2, 2018-2029
Figure 89: Middle East & Africa ADB and DLP Technology in Automobile Industry Market Value Share (%), By Segment 2, 2022 & 2029
Figure 90: Middle East & Africa ADB and DLP Technology in Automobile Industry Market Forecast (USD Billion), by Sub-Segment 1, 2018-2029
Figure 91: Middle East & Africa ADB and DLP Technology in Automobile Industry Market Forecast (USD Billion), by Sub-Segment 2, 2018-2029
Figure 92: Middle East & Africa ADB and DLP Technology in Automobile Industry Market Forecast (USD Billion), by Sub-Segment 3, 2018-2029
Figure 93: Middle East & Africa ADB and DLP Technology in Automobile Industry Market Forecast (USD Billion), by Others, 2018-2029
Figure 94: Middle East & Africa ADB and DLP Technology in Automobile Industry Market Value Share (%), By Segment 3, 2022 & 2029
Figure 95: Middle East & Africa ADB and DLP Technology in Automobile Industry Market Forecast (USD Billion), by Sub-Segment 1, 2018-2029
Figure 96: Middle East & Africa ADB and DLP Technology in Automobile Industry Market Forecast (USD Billion), by Sub-Segment 2, 2018-2029
Figure 97: Middle East & Africa ADB and DLP Technology in Automobile Industry Market Forecast (USD Billion), by Sub-Segment 3, 2018-2029
Figure 98: Middle East & Africa ADB and DLP Technology in Automobile Industry Market Forecast (USD Billion), by Others, 2018-2029
Figure 99: Middle East & Africa ADB and DLP Technology in Automobile Industry Market Forecast (USD Billion), by GCC, 2018-2029
Figure 100: Middle East & Africa ADB and DLP Technology in Automobile Industry Market Forecast (USD Billion), by South Africa, 2018-2029
Figure 101: Middle East & Africa ADB and DLP Technology in Automobile Industry Market Forecast (USD Billion), by Rest of Middle East & Africa, 2018-2029
List of Tables
Table 1: Global ADB and DLP Technology in Automobile Industry Market Revenue (USD Billion) Forecast, by Segment 1, 2018-2029
Table 2: Global ADB and DLP Technology in Automobile Industry Market Revenue (USD Billion) Forecast, by Segment 2, 2018-2029
Table 3: Global ADB and DLP Technology in Automobile Industry Market Revenue (USD Billion) Forecast, by Segment 3, 2018-2029
Table 4: Global ADB and DLP Technology in Automobile Industry Market Revenue (USD Billion) Forecast, by Region, 2018-2029
Table 5: North America ADB and DLP Technology in Automobile Industry Market Revenue (USD Billion) Forecast, by Segment 1, 2018-2029
Table 6: North America ADB and DLP Technology in Automobile Industry Market Revenue (USD Billion) Forecast, by Segment 2, 2018-2029
Table 7: North America ADB and DLP Technology in Automobile Industry Market Revenue (USD Billion) Forecast, by Segment 3, 2018-2029
Table 8: North America ADB and DLP Technology in Automobile Industry Market Revenue (USD Billion) Forecast, by Country, 2018-2029
Table 9: Europe ADB and DLP Technology in Automobile Industry Market Revenue (USD Billion) Forecast, by Segment 1, 2018-2029
Table 10: Europe ADB and DLP Technology in Automobile Industry Market Revenue (USD Billion) Forecast, by Segment 2, 2018-2029
Table 11: Europe ADB and DLP Technology in Automobile Industry Market Revenue (USD Billion) Forecast, by Segment 3, 2018-2029
Table 12: Europe ADB and DLP Technology in Automobile Industry Market Revenue (USD Billion) Forecast, by Country, 2018-2029
Table 13: Latin America ADB and DLP Technology in Automobile Industry Market Revenue (USD Billion) Forecast, by Segment 1, 2018-2029
Table 14: Latin America ADB and DLP Technology in Automobile Industry Market Revenue (USD Billion) Forecast, by Segment 2, 2018-2029
Table 15: Latin America ADB and DLP Technology in Automobile Industry Market Revenue (USD Billion) Forecast, by Segment 3, 2018-2029
Table 16: Latin America ADB and DLP Technology in Automobile Industry Market Revenue (USD Billion) Forecast, by Country, 2018-2029
Table 17: Asia Pacific ADB and DLP Technology in Automobile Industry Market Revenue (USD Billion) Forecast, by Segment 1, 2018-2029
Table 18: Asia Pacific ADB and DLP Technology in Automobile Industry Market Revenue (USD Billion) Forecast, by Segment 2, 2018-2029
Table 19: Asia Pacific ADB and DLP Technology in Automobile Industry Market Revenue (USD Billion) Forecast, by Segment 3, 2018-2029
Table 20: Asia Pacific ADB and DLP Technology in Automobile Industry Market Revenue (USD Billion) Forecast, by Country, 2018-2029
Table 21: Middle East & Africa ADB and DLP Technology in Automobile Industry Market Revenue (USD Billion) Forecast, by Segment 1, 2018-2029
Table 22: Middle East & Africa ADB and DLP Technology in Automobile Industry Market Revenue (USD Billion) Forecast, by Segment 2, 2018-2029
Table 23: Middle East & Africa ADB and DLP Technology in Automobile Industry Market Revenue (USD Billion) Forecast, by Segment 3, 2018-2029
Table 24: Middle East & Africa ADB and DLP Technology in Automobile Industry Market Revenue (USD Billion) Forecast, by Country, 2018-2029
Research Process
Data Library Research are conducted by industry experts who offer insight on
industry structure, market segmentations technology assessment and competitive landscape (CL), and penetration, as well as on emerging trends. Their analysis is based on primary interviews (~ 80%) and secondary research (~ 20%) as well as years of professional expertise in their respective industries. Adding to this, by analysing historical trends and current market positions, our analysts predict where the market will be headed for the next five years. Furthermore, the varying trends of segment & categories geographically presented are also studied and the estimated based on the primary & secondary research.
In this particular report from the supply side Data Library Research has conducted primary surveys (interviews) with the key level executives (VP, CEO’s, Marketing Director, Business Development Manager
and SOFT) of the companies that active & prominent as well as the midsized organization
FIGURE 1: DLR RESEARH PROCESS
![research-methodology1]()
Primary Research
Extensive primary research was conducted to gain a deeper insight of the market and industry performance. The analysis is based on both primary and secondary research as well as years of professional expertise in the respective industries.
In addition to analysing current and historical trends, our analysts predict where the market is headed over the next five years.
It varies by segment for these categories geographically presented in the list of market tables. Speaking about this particular report we have conducted primary surveys (interviews) with the key level executives (VP, CEO’s, Marketing Director, Business Development Manager and many more) of the major players active in the market.
Secondary Research
Secondary research was mainly used to collect and identify information useful for the extensive, technical, market-oriented, and Friend’s study of the Global Extra Neutral Alcohol. It was also used to obtain key information about major players, market classification and segmentation according to the industry trends, geographical markets, and developments related to the market and technology perspectives. For this study, analysts have gathered information from various credible sources, such as annual reports, sec filings, journals, white papers, SOFT presentations, and company web sites.
Market Size Estimation
Both, top-down and bottom-up approaches were used to estimate and validate the size of the Global market and to estimate the size of various other dependent submarkets in the overall Extra Neutral Alcohol. The key players in the market were identified through secondary research and their market contributions in the respective geographies were determined through primary and secondary research.
Forecast Model
![research-methodology2]()