Agri-farming Digital Twin Market Overview and Analysis:

This market is projected to reach around USD 4.6 billion 2032, from USD 1.09 billion in 2025. The market is forecasted for exceptional expansion, with a CAGR ranging from 16.2% over the forecast period, 2025-2032.

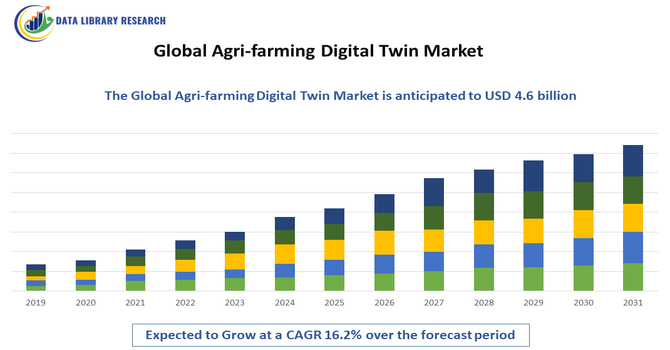
The Global Agri-farming Digital Twin Market is experiencing strong growth, primarily driven by the rising adoption of precision agriculture, increasing demand for real-time farm monitoring, and the growing need to enhance crop yield and resource efficiency. Farmers and agribusinesses are increasingly leveraging digital twin technology to simulate crop environments, predict outcomes, and optimize irrigation, fertilization, and pest management. Additionally, advancements in AI, IoT sensors, cloud computing, and satellite imaging are enabling highly accurate virtual models of soil conditions, crop health, and machinery performance.

Agri-farming Digital Twin Market Latest Trends:

The global Agri-farming Digital Twin Market is being shaped by several noteworthy trends. First, there is a strong shift toward hybrid digital twin models that combine IoT sensor networks, satellite imagery, and edge-AI analytics to provide real-time virtual counterparts of crop fields, soil health, and farm machinery enabling farmers to simulate “what-if” scenarios for irrigation, fertilisation, pest control and yield optimization. Second, growing interoperability and data-sharing ecosystems are emerging platforms that allow agribusinesses, machinery OEMs, seed companies, and growers to integrate their digital twin models into supply-chain and sustainability dashboards, thus extending value beyond the field into traceability, certification, and climate-resilience frameworks.

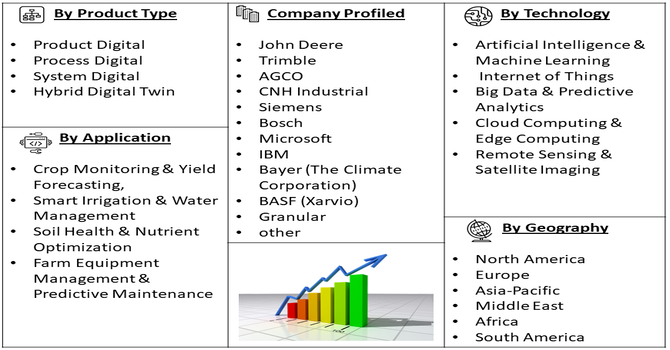
Segmentation: Global Agri-farming Digital Twin Market is segmented By Component (Digital Twin Platforms, Software & Analytics Solutions, IoT Sensors and Hardware Devices), Type (Product Digital, Process Digital, System Digital, Hybrid Digital Twin), Technology (Artificial Intelligence & Machine Learning, Internet of Things, Big Data & Predictive Analytics, Cloud Computing & Edge Computing, Remote Sensing & Satellite Imaging), Application (Crop Monitoring & Yield Forecasting, Smart Irrigation & Water Management, Soil Health & Nutrient Optimization, Farm Equipment Management & Predictive Maintenance), End User (Farmers & Individual Growers, Agribusinesses and Food Production Companies, Government Agriculture Agencies, Research Institutions & Agricultural Universities), and Geography (North America, Europe, Asia-Pacific, Middle East and Africa, and South America). The report provides the value (in USD million) for the above segments.

Market Drivers:

  • Rising Demand for Precision Agriculture and Resource Optimization

The key drivers accelerating the growth of the Global Agri-farming Digital Twin Market is the increasing adoption of precision agriculture to improve crop yield while minimizing resource wastage. As global food demand rises and arable land becomes constrained, farmers are seeking data-driven tools to optimize irrigation, fertilizer use, pest management, and planting cycles.

Digital twin systems enable real-time simulation of farming scenarios, allowing growers to predict outcomes before making decisions in the field. For instance, in January 2025, Siemens deployed Industrial AI at the factory edge, supported JetZero in developing blended wing aircraft via the Xcelerator platform, launched “Siemens for Startups” with AWS, collaborated with NVIDIA for advanced product visualization, and partnered with Sony for immersive mixed-reality design. These innovations indirectly advanced precision agriculture by demonstrating scalable AI, digital modeling, and simulation tools, positively impacting the global agri-farming digital twin market through enhanced resource optimization and technology-driven operational efficiency.

  • Advancements in IoT, AI, and Remote Sensing Technologies

Another major growth driver is the rapid advancement and integration of enabling technologies such as IoT sensors, AI-based analytics, satellite imaging, and cloud computing.

Modern farms are increasingly equipped with sensor networks that collect real-time data on soil fertility, environmental conditions, machinery performance, and livestock behavior. AI and machine learning algorithms process this data to generate predictive models, while remote sensing tools such as drones and satellite imagery enhance monitoring accuracy at scale. These technologies enhance the functionality, real-time responsiveness, and intelligence of digital twin systems, making them more accessible and powerful for farm automation and decision-support.

Market Restraints:

  • With High Implementation and Operational Costs

The Global Agri-farming Digital Twin Market faces several restraints that may slow adoption, with high implementation and operational costs being a major challenge, especially for small and medium-sized farms with limited technological budgets. Establishing a digital twin ecosystem requires advanced sensors, connectivity infrastructure, high-performance computing, and data analytics platforms, making it financially demanding in regions with low digital maturity. Additionally, data complexity and the lack of standardized agricultural data frameworks create integration challenges between platforms, equipment brands, and monitoring systems. Limited digital literacy among farmers, particularly in developing regions, further restricts adoption, as effective use requires training in data interpretation and technology management.

Socio Economic Impact on Agri-farming Digital Twin Market

The global agri-farming digital twin market has a significant socioeconomic impact by helping farmers and agribusinesses optimize crop production, reduce waste, and improve resource management. By using digital simulations of farms, stakeholders can predict outcomes, manage risks, and make informed decisions, which boosts food security, farm profitability, and sustainability. Additionally, it creates opportunities for skilled jobs in data analysis, IoT, and software development, supporting rural economies and driving technological advancement in agriculture worldwide.

Segmental Analysis:

  • Software & Analytics Solutions segment is expected to witness highest growth over the forecast period

Within the component category, Software & Analytics Solutions hold a key role as they enable real-time modeling, prediction, and decision-making using farm-generated data. These platforms integrate data from sensors, satellite imaging, and field equipment to simulate plant growth patterns, forecast yields, and identify optimal farming strategies. As farms become more automated and data-driven, analytics software is increasingly used for scenario planning, sustainability reporting, and climate-risk assessment, making it a foundational growth area in the digital twin ecosystem.

  • Hybrid Digital Twin segment is expected to witness highest growth over the forecast period

Hybrid Digital Twins are gaining prominence as they combine product, process, and system-level modeling to deliver a comprehensive virtual representation of farm operations. This type enables multi-layer analysis of soil conditions, crop behavior, weather influence, and machine performance in a unified model, supporting holistic decision-making. The hybrid approach is especially valuable for large-scale smart farms and agribusiness supply chains, where interconnected processes require synchronized monitoring and optimization.

  • Artificial Intelligence & Machine Learning segment is expected to witness highest growth over the forecast period

AI and Machine Learning are emerging as critical enabling technologies due to their ability to detect patterns, automate insights, and improve forecast accuracy. These technologies help create dynamic digital twin models that learn from historical and real-time inputs, enabling farmers to predict crop diseases, optimize irrigation timing, and automate fertilization strategies. As AI adoption accelerates across agriculture, its integration into digital twin platforms is expected to significantly enhance operational efficiency and farm intelligence.

  • Crop Monitoring & Yield Forecasting segment is expected to witness highest growth over the forecast period

Crop Monitoring & Yield Forecasting represents a leading application segment as digital twins help farmers simulate crop performance under different environmental and management conditions. These models allow prediction of yield changes based on water availability, soil nutrients, fertilizer schedules, and pest threats. With climate variability affecting global crop output, the ability to forecast production outcomes in advance is driving strong adoption of digital twin technology in this segment.

  • Agribusinesses and Food Production Companies segment is expected to witness highest growth over the forecast period

Agribusinesses and food production companies are emerging as major adopters as they seek to optimize supply chains, ensure traceability, and improve sustainability reporting. Digital twins help these organizations standardize field operations, monitor contract farming networks, and make data-driven decisions across large agricultural portfolios. Their ability to improve scalability and reduce operational uncertainty makes them highly valuable at enterprise level, fueling strong demand in this user group.

  • North America segment is expected to witness highest growth over the forecast period

North America leads the market geographically due to the high adoption of precision agriculture, well-developed digital infrastructure, and the presence of advanced agri-tech companies and research institutions. In November 2022, xFarm Technologies and Precision Farming Network (PFN) collaborated to integrate PFN’s agricultural machinery with xFarm’s digital technology, creating innovative digital twins for each piece of equipment. This allowed the development of new digital services tailored for modern, 4.0-era farms. Involving brands like Caffini, Mascar, DCM, and Alpego, the initiative positively impacted the U.S. agri-farming digital twin market by promoting advanced farm digitization and improving operational efficiency across the sector.

Furthermore, the region benefits from strong government support for smart farming initiatives and widespread deployment of IoT, analytics, and satellite technologies. Large-scale commercial farms and early technology adoption trends continue to position North America as the dominant region in the Agri-farming Digital Twin Market. For instance, in June 2025, University of Florida researchers developed a digital twin of a strawberry field, enabling AI models to train year-round on simulated crops. This approach reduced seasonal constraints and fieldwork while accelerating the deployment of automated agricultural tools. Led by Dana Choi at UF/IFAS, the project supported Florida’s $500 million strawberry industry and positively impacted the U.S. agri-farming digital twin market by promoting technology adoption and enhancing productivity across the sector.

Agri-farming Digital Twin Market Competitive Landscape

The competitive landscape of the Global Agri-farming Digital Twin Market is moderately concentrated with a mix of large agri-equipment OEMs, industrial automation and cloud providers, specialized agri-tech software firms, and remote-sensing/data analytics companies. Firms compete on the accuracy of simulation models, sensor and satellite data integration, AI/ML-driven predictive capabilities, end-to-end farm management integrations, and scalability across farm sizes and crop types. Strategic partnerships, platform interoperability, and go-to-market relationships with agribusinesses and government research bodies are key differentiators as vendors aim to offer comprehensive digital twin solutions that deliver actionable insights, traceability, and sustainability outcomes.

The major players for this market are:

  • John Deere
  • Trimble
  • AGCO
  • CNH Industrial
  • Siemens
  • Bosch
  • Microsoft
  • IBM
  • Bayer (The Climate Corporation)
  • BASF (Xarvio)
  • Granular
  • CropX
  • CropIn
  • Raven Industries
  • Topcon Positioning Systems
  • Sentera
  • Prospera Technologies
  • Planet Labs PBC
  • DroneDeploy
  • NVIDIA

Recent Development

  • In October 2025, SRUC’s Dairy Research Centre near Dumfries developed an innovation that advanced the use of digital technology in dairy farming, enhancing efficiency, animal welfare, and environmental sustainability. Supported by the Digital Dairy Chain via the UKRI Strength in Places programme, Farm-Twin combined data science with precision agriculture, enabling farmers to visualize, analyze, and optimize operations. This development positively impacted the global agri-farming digital twin market by promoting adoption of data-driven, sustainable, and efficient farming practices.


  • In March 2025, Thales Alenia Space led the integration and architectural design of the Digital Twin Component, combining scientific models with Earth observation data to generate actionable insights. Initiatives like Destination Earth enabled users to explore climate impacts and resource management strategies. This advancement positively impacted the global agri-farming digital twin market by enhancing predictive capabilities, improving crop and resource planning, supporting climate-adaptive agriculture, and driving adoption of advanced digital solutions across the sector.


Frequently Asked Questions (FAQ) :

Q1. What are the main growth-driving factors for this market?

The market is mainly driven by the urgent global need for food security and highly efficient resource management, known as precision farming. Digital twins allow farmers to create virtual models of crops and fields, enabling data-driven decisions on irrigation, fertilization, and pest control. The integration of advanced technologies like IoT sensors and Artificial Intelligence (AI) further boosts growth by providing real-time data for optimized agricultural operations and higher yields.

Q2. What are the main restraining factors for this market?

Adoption is primarily limited by the high initial investment required to deploy the complete digital twin ecosystem, including sensors, data platforms, and analytical software. This cost is prohibitive for many small and medium-sized farms. Furthermore, the technology requires a specialized, skilled workforce to manage complex data modeling and system integration. Cybersecurity risks associated with large volumes of collected farm data also pose a significant concern.

Q3. Which segment is expected to witness high growth?

The Services component segment is anticipated to show the highest growth rate. This segment includes consulting, system integration, maintenance, and support required to set up and run the complex digital twin platforms. As farmers increasingly rely on external expertise to integrate AI, IoT, and cloud systems with their existing farm infrastructure, the demand for specialized support services is rapidly accelerating worldwide.

Q4. Who are the top major players for this market?

Key players in this specialized market often include large technology corporations that leverage their expertise in data analytics, cloud computing, and industrial software. Major companies leading the charge include Microsoft Corporation, IBM, GE Digital, SAP SE, and Siemens. These companies focus on creating comprehensive platforms and solutions that manage the complex simulation and data visualization aspects required for smart agricultural systems.

Q5. Which country is the largest player?

North America, particularly the United States, is currently the largest and most established market for Agri-farming Digital Twins by market share. This dominance is due to the region's strong existing infrastructure for advanced agricultural technology (AgTech), high rates of technological adoption by large-scale commercial farms, and favorable government policies supporting digital transformation initiatives in the agricultural sector.

Agri-farming Digital Twin MARKET STUDY GLOBAL MARKET ANALYSIS, INSIGHTS AND FORECAST, 2022-2029

    1. Introduction

    • 1.1. Research Scope
    • 1.2. Market Segmentation
    • 1.3. Research Methodology
    • 1.4. Definitions and Assumptions

    2. Executive Summary

      3. Market Dynamics

      • 3.1. Market Drivers
      • 3.2. Market Restraints
      • 3.3. Market Opportunities

      4. Key Insights

      • 4.1. Key Emerging Trends – For Major Countries
      • 4.2. Latest Technological Advancement
      • 4.3. Regulatory Landscape
      • 4.4. Industry SWOT Analysis
      • 4.5. Porters Five Forces Analysis

      5. Global Agri-farming Digital Twin Market Analysis (USD Billion), Insights and Forecast, 2018-2029

      • 5.1. Key Findings / Summary
      • 5.2. Market Analysis, Insights and Forecast – By Segment 1
        • 5.2.1. Sub-Segment 1
        • 5.2.2. Sub-Segment 2
      • 5.3. Market Analysis, Insights and Forecast – By Segment 2
        • 5.3.1. Sub-Segment 1
        • 5.3.2. Sub-Segment 2
        • 5.3.3. Sub-Segment 3
        • 5.3.4. Others
      • 5.4. Market Analysis, Insights and Forecast – By Segment 3
        • 5.4.1. Sub-Segment 1
        • 5.4.2. Sub-Segment 2
        • 5.4.3. Sub-Segment 3
        • 5.4.4. Others
      • 5.5. Market Analysis, Insights and Forecast – By Region
        • 5.5.1. North America
        • 5.5.2. Latin America
        • 5.5.3. Europe
        • 5.5.4. Asia Pacific
        • 5.5.5. Middle East and Africa

      6. North America Agri-farming Digital Twin Market Analysis (USD Billion), Insights and Forecast, 2018-2029

      • 6.1. Key Findings / Summary
      • 6.2. Market Analysis, Insights and Forecast – By Segment 1
        • 6.2.1. Sub-Segment 1
        • 6.2.2. Sub-Segment 2
      • 6.3. Market Analysis, Insights and Forecast – By Segment 2
        • 6.3.1. Sub-Segment 1
        • 6.3.2. Sub-Segment 2
        • 6.3.3. Sub-Segment 3
        • 6.3.4. Others
      • 6.4. Market Analysis, Insights and Forecast – By Segment 3
        • 6.4.1. Sub-Segment 1
        • 6.4.2. Sub-Segment 2
        • 6.4.3. Sub-Segment 3
        • 6.4.4. Others
      • 6.5. Market Analysis, Insights and Forecast – By Country
        • 6.5.1. U.S.
        • 6.5.2. Canada

      7. Latin America Agri-farming Digital Twin Market Analysis (USD Billion), Insights and Forecast, 2018-2029

      • 7.1. Key Findings / Summary
      • 7.2. Market Analysis, Insights and Forecast – By Segment 1
        • 7.2.1. Sub-Segment 1
        • 7.2.2. Sub-Segment 2
      • 7.3. Market Analysis, Insights and Forecast – By Segment 2
        • 7.3.1. Sub-Segment 1
        • 7.3.2. Sub-Segment 2
        • 7.3.3. Sub-Segment 3
        • 7.3.4. Others
      • 7.4. Market Analysis, Insights and Forecast – By Segment 3
        • 7.4.1. Sub-Segment 1
        • 7.4.2. Sub-Segment 2
        • 7.4.3. Sub-Segment 3
        • 7.4.4. Others
      • 7.5. Insights and Forecast – By Country
        • 7.5.1. Brazil
        • 7.5.2. Mexico
        • 7.5.3. Rest of Latin America

      8. Europe Agri-farming Digital Twin Market Analysis (USD Billion), Insights and Forecast, 2018-2029

      • 8.1. Key Findings / Summary
      • 8.2. Market Analysis, Insights and Forecast – By Segment 1
        • 8.2.1. Sub-Segment 1
        • 8.2.2. Sub-Segment 2
      • 8.3. Market Analysis, Insights and Forecast – By Segment 2
        • 8.3.1. Sub-Segment 1
        • 8.3.2. Sub-Segment 2
        • 8.3.3. Sub-Segment 3
        • 8.3.4. Others
      • 8.4. Market Analysis, Insights and Forecast – By Segment 3
        • 8.4.1. Sub-Segment 1
        • 8.4.2. Sub-Segment 2
        • 8.4.3. Sub-Segment 3
        • 8.4.4. Others
      • 8.5. Market Analysis, Insights and Forecast – By Country
        • 8.5.1. UK
        • 8.5.2. Germany
        • 8.5.3. France
        • 8.5.4. Italy
        • 8.5.5. Spain
        • 8.5.6. Russia
        • 8.5.7. Rest of Europe

      9. Asia Pacific Agri-farming Digital Twin Market Analysis (USD Billion), Insights and Forecast, 2018-2029

      • 9.1. Key Findings / Summary
      • 9.2. Market Analysis, Insights and Forecast – By Segment 1
        • 9.2.1. Sub-Segment 1
        • 9.2.2. Sub-Segment 2
      • 9.3. Market Analysis, Insights and Forecast – By Segment 2
        • 9.3.1. Sub-Segment 1
        • 9.3.2. Sub-Segment 2
        • 9.3.3. Sub-Segment 3
        • 9.3.4. Others
      • 9.4. Market Analysis, Insights and Forecast – By Segment 3
        • 9.4.1. Sub-Segment 1
        • 9.4.2. Sub-Segment 2
        • 9.4.3. Sub-Segment 3
        • 9.4.4. Others
      • 9.5. Market Analysis, Insights and Forecast – By Country
        • 9.5.1. China
        • 9.5.2. India
        • 9.5.3. Japan
        • 9.5.4. Australia
        • 9.5.5. South East Asia
        • 9.5.6. Rest of Asia Pacific

      10. Middle East & Africa Agri-farming Digital Twin Market Analysis (USD Billion), Insights and Forecast, 2018-2029

      • 10.1. Key Findings / Summary
      • 10.2. Market Analysis, Insights and Forecast – By Segment 1
        • 10.2.1. Sub-Segment 1
        • 10.2.2. Sub-Segment 2
      • 10.3. Market Analysis, Insights and Forecast – By Segment 2
        • 10.3.1. Sub-Segment 1
        • 10.3.2. Sub-Segment 2
        • 10.3.3. Sub-Segment 3
        • 10.3.4. Others
      • 10.4. Market Analysis, Insights and Forecast – By Segment 3
        • 10.4.1. Sub-Segment 1
        • 10.4.2. Sub-Segment 2
        • 10.4.3. Sub-Segment 3
        • 10.4.4. Others
      • 10.5. Market Analysis, Insights and Forecast – By Country
        • 10.5.1. GCC
        • 10.5.2. South Africa
        • 10.5.3. Rest of Middle East & Africa

      11. Competitive Analysis

      • 11.1. Company Market Share Analysis, 2018
      • 11.2. Key Industry Developments
      • 11.3. Company Profile
        • 11.3.1. Company 1
          • 11.3.1.1. Business Overview
          • 11.3.1.2. Segment 1 & Service Offering
          • 11.3.1.3. Overall Revenue
          • 11.3.1.4. Geographic Presence
          • 11.3.1.5. Recent Development
        *Similar details will be provided for the following companies
        • 11.3.2. Company 2
        • 11.3.3. Company 3
        • 11.3.4. Company 4
        • 11.3.5. Company 5
        • 11.3.6. Company 6
        • 11.3.7. Company 7
        • 11.3.8. Company 8
        • 11.3.9. Company 9
        • 11.3.10. Company 10
        • 11.3.11. Company 11
        • 11.3.12. Company 12
      List of Figures

      Figure 1: Global Agri-farming Digital Twin Market Revenue Breakdown (USD Billion, %) by Region, 2022 & 2029
      Figure 2: Global Agri-farming Digital Twin Market Value Share (%), By Segment 1, 2022 & 2029
      Figure 3: Global Agri-farming Digital Twin Market Forecast (USD Billion), by Sub-Segment 1, 2018-2029
      Figure 4: Global Agri-farming Digital Twin Market Forecast (USD Billion), by Sub-Segment 2, 2018-2029
      Figure 5: Global Agri-farming Digital Twin Market Value Share (%), By Segment 2, 2022 & 2029
      Figure 6: Global Agri-farming Digital Twin Market Forecast (USD Billion), by Sub-Segment 1, 2018-2029
      Figure 7: Global Agri-farming Digital Twin Market Forecast (USD Billion), by Sub-Segment 2, 2018-2029
      Figure 8: Global Agri-farming Digital Twin Market Forecast (USD Billion), by Sub-Segment 3, 2018-2029
      Figure 9: Global Agri-farming Digital Twin Market Forecast (USD Billion), by Others, 2018-2029
      Figure 10: Global Agri-farming Digital Twin Market Value Share (%), By Segment 3, 2022 & 2029
      Figure 11: Global Agri-farming Digital Twin Market Forecast (USD Billion), by Sub-Segment 1, 2018-2029
      Figure 12: Global Agri-farming Digital Twin Market Forecast (USD Billion), by Sub-Segment 2, 2018-2029
      Figure 13: Global Agri-farming Digital Twin Market Forecast (USD Billion), by Sub-Segment 3, 2018-2029
      Figure 14: Global Agri-farming Digital Twin Market Forecast (USD Billion), by Others, 2018-2029
      Figure 15: Global Agri-farming Digital Twin Market Value (USD Billion), by Region, 2022 & 2029
      Figure 16: North America Agri-farming Digital Twin Market Value Share (%), By Segment 1, 2022 & 2029
      Figure 17: North America Agri-farming Digital Twin Market Forecast (USD Billion), by Sub-Segment 1, 2018-2029
      Figure 18: North America Agri-farming Digital Twin Market Forecast (USD Billion), by Sub-Segment 2, 2018-2029
      Figure 19: North America Agri-farming Digital Twin Market Value Share (%), By Segment 2, 2022 & 2029
      Figure 20: North America Agri-farming Digital Twin Market Forecast (USD Billion), by Sub-Segment 1, 2018-2029
      Figure 21: North America Agri-farming Digital Twin Market Forecast (USD Billion), by Sub-Segment 2, 2018-2029
      Figure 22: North America Agri-farming Digital Twin Market Forecast (USD Billion), by Sub-Segment 3, 2018-2029
      Figure 23: North America Agri-farming Digital Twin Market Forecast (USD Billion), by Others, 2018-2029
      Figure 24: North America Agri-farming Digital Twin Market Value Share (%), By Segment 3, 2022 & 2029
      Figure 25: North America Agri-farming Digital Twin Market Forecast (USD Billion), by Sub-Segment 1, 2018-2029
      Figure 26: North America Agri-farming Digital Twin Market Forecast (USD Billion), by Sub-Segment 2, 2018-2029
      Figure 27: North America Agri-farming Digital Twin Market Forecast (USD Billion), by Sub-Segment 3, 2018-2029
      Figure 28: North America Agri-farming Digital Twin Market Forecast (USD Billion), by Others, 2018-2029
      Figure 29: North America Agri-farming Digital Twin Market Forecast (USD Billion), by U.S., 2018-2029
      Figure 30: North America Agri-farming Digital Twin Market Forecast (USD Billion), by Canada, 2018-2029
      Figure 31: Latin America Agri-farming Digital Twin Market Value Share (%), By Segment 1, 2022 & 2029
      Figure 32: Latin America Agri-farming Digital Twin Market Forecast (USD Billion), by Sub-Segment 1, 2018-2029
      Figure 33: Latin America Agri-farming Digital Twin Market Forecast (USD Billion), by Sub-Segment 2, 2018-2029
      Figure 34: Latin America Agri-farming Digital Twin Market Value Share (%), By Segment 2, 2022 & 2029
      Figure 35: Latin America Agri-farming Digital Twin Market Forecast (USD Billion), by Sub-Segment 1, 2018-2029
      Figure 36: Latin America Agri-farming Digital Twin Market Forecast (USD Billion), by Sub-Segment 2, 2018-2029
      Figure 37: Latin America Agri-farming Digital Twin Market Forecast (USD Billion), by Sub-Segment 3, 2018-2029
      Figure 38: Latin America Agri-farming Digital Twin Market Forecast (USD Billion), by Others, 2018-2029
      Figure 39: Latin America Agri-farming Digital Twin Market Value Share (%), By Segment 3, 2022 & 2029
      Figure 40: Latin America Agri-farming Digital Twin Market Forecast (USD Billion), by Sub-Segment 1, 2018-2029
      Figure 41: Latin America Agri-farming Digital Twin Market Forecast (USD Billion), by Sub-Segment 2, 2018-2029
      Figure 42: Latin America Agri-farming Digital Twin Market Forecast (USD Billion), by Sub-Segment 3, 2018-2029
      Figure 43: Latin America Agri-farming Digital Twin Market Forecast (USD Billion), by Others, 2018-2029
      Figure 44: Latin America Agri-farming Digital Twin Market Forecast (USD Billion), by Brazil, 2018-2029
      Figure 45: Latin America Agri-farming Digital Twin Market Forecast (USD Billion), by Mexico, 2018-2029
      Figure 46: Latin America Agri-farming Digital Twin Market Forecast (USD Billion), by Rest of Latin America, 2018-2029
      Figure 47: Europe Agri-farming Digital Twin Market Value Share (%), By Segment 1, 2022 & 2029
      Figure 48: Europe Agri-farming Digital Twin Market Forecast (USD Billion), by Sub-Segment 1, 2018-2029
      Figure 49: Europe Agri-farming Digital Twin Market Forecast (USD Billion), by Sub-Segment 2, 2018-2029
      Figure 50: Europe Agri-farming Digital Twin Market Value Share (%), By Segment 2, 2022 & 2029
      Figure 51: Europe Agri-farming Digital Twin Market Forecast (USD Billion), by Sub-Segment 1, 2018-2029
      Figure 52: Europe Agri-farming Digital Twin Market Forecast (USD Billion), by Sub-Segment 2, 2018-2029
      Figure 53: Europe Agri-farming Digital Twin Market Forecast (USD Billion), by Sub-Segment 3, 2018-2029
      Figure 54: Europe Agri-farming Digital Twin Market Forecast (USD Billion), by Others, 2018-2029
      Figure 55: Europe Agri-farming Digital Twin Market Value Share (%), By Segment 3, 2022 & 2029
      Figure 56: Europe Agri-farming Digital Twin Market Forecast (USD Billion), by Sub-Segment 1, 2018-2029
      Figure 57: Europe Agri-farming Digital Twin Market Forecast (USD Billion), by Sub-Segment 2, 2018-2029
      Figure 58: Europe Agri-farming Digital Twin Market Forecast (USD Billion), by Sub-Segment 3, 2018-2029
      Figure 59: Europe Agri-farming Digital Twin Market Forecast (USD Billion), by Others, 2018-2029
      Figure 60: Europe Agri-farming Digital Twin Market Forecast (USD Billion), by U.K., 2018-2029
      Figure 61: Europe Agri-farming Digital Twin Market Forecast (USD Billion), by Germany, 2018-2029
      Figure 62: Europe Agri-farming Digital Twin Market Forecast (USD Billion), by France, 2018-2029
      Figure 63: Europe Agri-farming Digital Twin Market Forecast (USD Billion), by Italy, 2018-2029
      Figure 64: Europe Agri-farming Digital Twin Market Forecast (USD Billion), by Spain, 2018-2029
      Figure 65: Europe Agri-farming Digital Twin Market Forecast (USD Billion), by Russia, 2018-2029
      Figure 66: Europe Agri-farming Digital Twin Market Forecast (USD Billion), by Rest of Europe, 2018-2029
      Figure 67: Asia Pacific Agri-farming Digital Twin Market Value Share (%), By Segment 1, 2022 & 2029
      Figure 68: Asia Pacific Agri-farming Digital Twin Market Forecast (USD Billion), by Sub-Segment 1, 2018-2029
      Figure 69: Asia Pacific Agri-farming Digital Twin Market Forecast (USD Billion), by Sub-Segment 2, 2018-2029
      Figure 70: Asia Pacific Agri-farming Digital Twin Market Value Share (%), By Segment 2, 2022 & 2029
      Figure 71: Asia Pacific Agri-farming Digital Twin Market Forecast (USD Billion), by Sub-Segment 1, 2018-2029
      Figure 72: Asia Pacific Agri-farming Digital Twin Market Forecast (USD Billion), by Sub-Segment 2, 2018-2029
      Figure 73: Asia Pacific Agri-farming Digital Twin Market Forecast (USD Billion), by Sub-Segment 3, 2018-2029
      Figure 74: Asia Pacific Agri-farming Digital Twin Market Forecast (USD Billion), by Others, 2018-2029
      Figure 75: Asia Pacific Agri-farming Digital Twin Market Value Share (%), By Segment 3, 2022 & 2029
      Figure 76: Asia Pacific Agri-farming Digital Twin Market Forecast (USD Billion), by Sub-Segment 1, 2018-2029
      Figure 77: Asia Pacific Agri-farming Digital Twin Market Forecast (USD Billion), by Sub-Segment 2, 2018-2029
      Figure 78: Asia Pacific Agri-farming Digital Twin Market Forecast (USD Billion), by Sub-Segment 3, 2018-2029
      Figure 79: Asia Pacific Agri-farming Digital Twin Market Forecast (USD Billion), by Others, 2018-2029
      Figure 80: Asia Pacific Agri-farming Digital Twin Market Forecast (USD Billion), by China, 2018-2029
      Figure 81: Asia Pacific Agri-farming Digital Twin Market Forecast (USD Billion), by India, 2018-2029
      Figure 82: Asia Pacific Agri-farming Digital Twin Market Forecast (USD Billion), by Japan, 2018-2029
      Figure 83: Asia Pacific Agri-farming Digital Twin Market Forecast (USD Billion), by Australia, 2018-2029
      Figure 84: Asia Pacific Agri-farming Digital Twin Market Forecast (USD Billion), by Southeast Asia, 2018-2029
      Figure 85: Asia Pacific Agri-farming Digital Twin Market Forecast (USD Billion), by Rest of Asia Pacific, 2018-2029
      Figure 86: Middle East & Africa Agri-farming Digital Twin Market Value Share (%), By Segment 1, 2022 & 2029
      Figure 87: Middle East & Africa Agri-farming Digital Twin Market Forecast (USD Billion), by Sub-Segment 1, 2018-2029
      Figure 88: Middle East & Africa Agri-farming Digital Twin Market Forecast (USD Billion), by Sub-Segment 2, 2018-2029
      Figure 89: Middle East & Africa Agri-farming Digital Twin Market Value Share (%), By Segment 2, 2022 & 2029
      Figure 90: Middle East & Africa Agri-farming Digital Twin Market Forecast (USD Billion), by Sub-Segment 1, 2018-2029
      Figure 91: Middle East & Africa Agri-farming Digital Twin Market Forecast (USD Billion), by Sub-Segment 2, 2018-2029
      Figure 92: Middle East & Africa Agri-farming Digital Twin Market Forecast (USD Billion), by Sub-Segment 3, 2018-2029
      Figure 93: Middle East & Africa Agri-farming Digital Twin Market Forecast (USD Billion), by Others, 2018-2029
      Figure 94: Middle East & Africa Agri-farming Digital Twin Market Value Share (%), By Segment 3, 2022 & 2029
      Figure 95: Middle East & Africa Agri-farming Digital Twin Market Forecast (USD Billion), by Sub-Segment 1, 2018-2029
      Figure 96: Middle East & Africa Agri-farming Digital Twin Market Forecast (USD Billion), by Sub-Segment 2, 2018-2029
      Figure 97: Middle East & Africa Agri-farming Digital Twin Market Forecast (USD Billion), by Sub-Segment 3, 2018-2029
      Figure 98: Middle East & Africa Agri-farming Digital Twin Market Forecast (USD Billion), by Others, 2018-2029
      Figure 99: Middle East & Africa Agri-farming Digital Twin Market Forecast (USD Billion), by GCC, 2018-2029
      Figure 100: Middle East & Africa Agri-farming Digital Twin Market Forecast (USD Billion), by South Africa, 2018-2029
      Figure 101: Middle East & Africa Agri-farming Digital Twin Market Forecast (USD Billion), by Rest of Middle East & Africa, 2018-2029 
      List of Tables
      Table 1: Global Agri-farming Digital Twin Market Revenue (USD Billion) Forecast, by Segment 1, 2018-2029
      Table 2: Global Agri-farming Digital Twin Market Revenue (USD Billion) Forecast, by Segment 2, 2018-2029
      Table 3: Global Agri-farming Digital Twin Market Revenue (USD Billion) Forecast, by Segment 3, 2018-2029
      Table 4: Global Agri-farming Digital Twin Market Revenue (USD Billion) Forecast, by Region, 2018-2029
      Table 5: North America Agri-farming Digital Twin Market Revenue (USD Billion) Forecast, by Segment 1, 2018-2029
      Table 6: North America Agri-farming Digital Twin Market Revenue (USD Billion) Forecast, by Segment 2, 2018-2029
      Table 7: North America Agri-farming Digital Twin Market Revenue (USD Billion) Forecast, by Segment 3, 2018-2029
      Table 8: North America Agri-farming Digital Twin Market Revenue (USD Billion) Forecast, by Country, 2018-2029
      Table 9: Europe Agri-farming Digital Twin Market Revenue (USD Billion) Forecast, by Segment 1, 2018-2029
      Table 10: Europe Agri-farming Digital Twin Market Revenue (USD Billion) Forecast, by Segment 2, 2018-2029
      Table 11: Europe Agri-farming Digital Twin Market Revenue (USD Billion) Forecast, by Segment 3, 2018-2029
      Table 12: Europe Agri-farming Digital Twin Market Revenue (USD Billion) Forecast, by Country, 2018-2029
      Table 13: Latin America Agri-farming Digital Twin Market Revenue (USD Billion) Forecast, by Segment 1, 2018-2029
      Table 14: Latin America Agri-farming Digital Twin Market Revenue (USD Billion) Forecast, by Segment 2, 2018-2029
      Table 15: Latin America Agri-farming Digital Twin Market Revenue (USD Billion) Forecast, by Segment 3, 2018-2029
      Table 16: Latin America Agri-farming Digital Twin Market Revenue (USD Billion) Forecast, by Country, 2018-2029
      Table 17: Asia Pacific Agri-farming Digital Twin Market Revenue (USD Billion) Forecast, by Segment 1, 2018-2029
      Table 18: Asia Pacific Agri-farming Digital Twin Market Revenue (USD Billion) Forecast, by Segment 2, 2018-2029
      Table 19: Asia Pacific Agri-farming Digital Twin Market Revenue (USD Billion) Forecast, by Segment 3, 2018-2029
      Table 20: Asia Pacific Agri-farming Digital Twin Market Revenue (USD Billion) Forecast, by Country, 2018-2029
      Table 21: Middle East & Africa Agri-farming Digital Twin Market Revenue (USD Billion) Forecast, by Segment 1, 2018-2029
      Table 22: Middle East & Africa Agri-farming Digital Twin Market Revenue (USD Billion) Forecast, by Segment 2, 2018-2029
      Table 23: Middle East & Africa Agri-farming Digital Twin Market Revenue (USD Billion) Forecast, by Segment 3, 2018-2029
      Table 24: Middle East & Africa Agri-farming Digital Twin Market Revenue (USD Billion) Forecast, by Country, 2018-2029
      Research Process

      Data Library Research are conducted by industry experts who offer insight on industry structure, market segmentations technology assessment and competitive landscape (CL), and penetration, as well as on emerging trends. Their analysis is based on primary interviews (~ 80%) and secondary research (~ 20%) as well as years of professional expertise in their respective industries. Adding to this, by analysing historical trends and current market positions, our analysts predict where the market will be headed for the next five years. Furthermore, the varying trends of segment & categories geographically presented are also studied and the estimated based on the primary & secondary research.

      In this particular report from the supply side Data Library Research has conducted primary surveys (interviews) with the key level executives (VP, CEO’s, Marketing Director, Business Development Manager and SOFT) of the companies that active & prominent as well as the midsized organization

      FIGURE 1: DLR RESEARH PROCESS

      research-methodology1

      Primary Research

      Extensive primary research was conducted to gain a deeper insight of the market and industry performance. The analysis is based on both primary and secondary research as well as years of professional expertise in the respective industries.

      In addition to analysing current and historical trends, our analysts predict where the market is headed over the next five years.

      It varies by segment for these categories geographically presented in the list of market tables. Speaking about this particular report we have conducted primary surveys (interviews) with the key level executives (VP, CEO’s, Marketing Director, Business Development Manager and many more) of the major players active in the market.

      Secondary Research

      Secondary research was mainly used to collect and identify information useful for the extensive, technical, market-oriented, and Friend’s study of the Global Extra Neutral Alcohol. It was also used to obtain key information about major players, market classification and segmentation according to the industry trends, geographical markets, and developments related to the market and technology perspectives. For this study, analysts have gathered information from various credible sources, such as annual reports, sec filings, journals, white papers, SOFT presentations, and company web sites.

      Market Size Estimation

      Both, top-down and bottom-up approaches were used to estimate and validate the size of the Global market and to estimate the size of various other dependent submarkets in the overall Extra Neutral Alcohol. The key players in the market were identified through secondary research and their market contributions in the respective geographies were determined through primary and secondary research.

      Forecast Model

      research-methodology2

      Happy to Assist You

      If you have a question?

      info@datalibraryresearch.com

      IND : +91 955 279 0357

      Browse Related Reports