Get Complete Analysis Of The Report - Download Updated Free Sample PDF
The Global Agricultural Intelligent Systems Market encompasses advanced technologies that optimize farming operations through automation, data analytics, IoT, and AI. These systems enhance crop monitoring, irrigation management, pest control, and yield prediction, enabling precision agriculture, resource efficiency, and sustainable farming practices worldwide. The growth of the Global Agricultural Intelligent Systems Market is driven by increasing demand for precision agriculture, the need to enhance crop productivity, and rising adoption of IoT, AI, and data analytics in farming. Additionally, labor shortages, environmental concerns, and government initiatives promoting smart farming technologies are accelerating market expansion worldwide.
The Global Agricultural Intelligent Systems Market is undergoing significant transformation, driven by the integration of IoT sensors, AI analytics, and cloud-based management platforms into farming operations. Real-time data from drones, satellites, and field sensors enables precise monitoring of soil health, water usage, and crop growth, leading to optimized resource management and increased yields. Additionally, the adoption of autonomous farming equipment and robotics is expanding rapidly, addressing labor shortages and enhancing operational efficiency. Emerging trends include the rise of edge computing for on site decision making, the use of digital twins to simulate farm scenarios, and subscription based service models that make advanced tech accessible to even smaller farms.
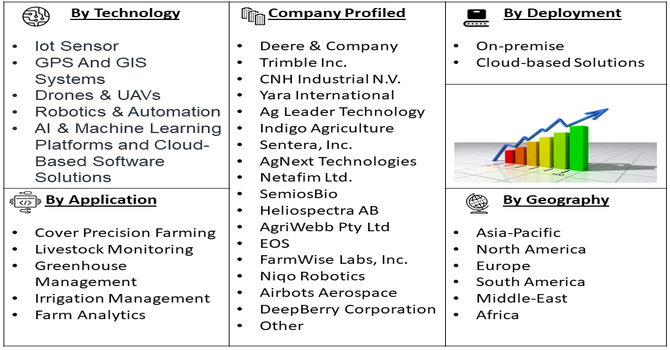
Segmentation: The Global Agricultural Intelligent Systems Market is segmented by Technology (Iot Sensors, GPS And GIS Systems, Drones & UAVs, Robotics & Automation, AI & Machine Learning Platforms, and Cloud-Based Software Solutions), Deployment (On-premise and Cloud-based Solutions), Farm Size (Small-Scale, Medium-Scale, and Large-Scale Farms), Application (Cover Precision Farming, Livestock Monitoring, Greenhouse Management, Irrigation Management, and Farm Analytics) and Geography (North America, Europe, Asia-Pacific, Middle East and Africa, and South America). The report provides the value (in USD million) for the above segments.
For Detailed Market Segmentation - Get a Free Sample PDF
Market Drivers:
The Global Agricultural Intelligent Systems Market has been significantly driven by the increasing adoption of precision agriculture technologies. Farmers and agribusinesses are leveraging AI, IoT, and GPS-enabled tools to optimize crop management, reduce resource wastage, and improve overall yield. Real-time monitoring of soil health, crop growth, and environmental conditions allows for data-driven decision-making, enabling efficient use of water, fertilizers, and pesticides. Governments and private stakeholders are promoting digital agriculture initiatives, offering subsidies and training to facilitate adoption. Additionally, the growing global population and the need to ensure food security have accelerated the deployment of intelligent farming solutions. These technologies minimize operational costs while maximizing productivity, making precision agriculture a critical growth driver.
Another major driver for the market is the integration of IoT and AI technologies into agricultural operations. Smart sensors, drones, autonomous tractors, and robotic harvesters provide real-time data collection and predictive analytics, enabling farmers to identify issues such as pest infestations, nutrient deficiencies, and irrigation inefficiencies early.
AI-powered platforms analyze this data to provide actionable insights, optimize planting schedules, and forecast crop yields. For instance, in July 2025, The International Crops Research Institute for the Semi-Arid Tropics (ICRISAT) partnered with leading national and international institutions to launch an initiative using AI and machine learning to provide real-time, personalized climate advisory services to farmers. Titled ‘AI-powered Context-Specific Agromet Advisory Services for Climate-Resilient Agriculture at Scale’ and supported under India’s Monsoon Mission III, the program aimed to deliver hyper-local weather and climate insights, helping smallholder farmers make informed decisions amid growing climate variability.
The growing availability of cloud computing and edge computing further enhances scalability and efficiency. Adoption of these technologies not only improves operational efficiency but also supports sustainable agricultural practices, reducing environmental impact and enabling precision management at scale, fueling market expansion globally.
Market Restraints:
A significant restraint for the market is the high initial cost and technical complexity associated with implementing agricultural intelligent systems. Advanced hardware such as drones, robotic harvesters, sensors, and GPS-enabled equipment requires substantial capital investment, which is often prohibitive for small and medium-sized farms. Additionally, farmers need technical expertise to operate and maintain these systems effectively, necessitating training and support infrastructure. Integration of software platforms, AI algorithms, and cloud services can be complex and resource-intensive. This financial and operational barrier slows adoption in developing regions and among resource-constrained farmers. Consequently, despite the benefits of efficiency and precision, high upfront costs and technological challenges remain a key limitation for market growth.
The Global Agricultural Intelligent Systems Market has a profound socioeconomic impact by enhancing farm productivity, reducing labor dependency, and promoting sustainable agriculture. By enabling precision farming, these technologies help optimize resource use, lower operational costs, and increase crop yields, directly improving farmers’ income and livelihoods. Wider adoption fosters rural employment in tech support, training, and system maintenance, while also strengthening food security and reducing environmental degradation. The market drives modernization in agriculture, bridging technological gaps between developed and developing regions, and supporting government initiatives for smart farming. Thus, it contributes to economic growth, social development, and a more resilient and sustainable agricultural ecosystem worldwide.
Segmental Analysis:
The Drones & UAVs segment in the Global Agricultural Intelligent Systems Market is anticipated to witness the highest growth over the forecast period due to their efficiency in precision agriculture and crop monitoring. These aerial systems enable real-time imaging, spraying, and surveillance, reducing manual labor and enhancing operational efficiency. Integration with AI and IoT technologies allows data-driven decision-making for irrigation, fertilization, and pest control. Farmers benefit from increased productivity, reduced input costs, and timely interventions. The rising adoption of drone technology in developing and developed regions, along with supportive government policies and subsidies, further accelerates market growth. Drones are becoming indispensable tools in modern, data-driven farming practices.
The Cloud-Based segment is projected to experience the highest growth in the Agricultural Intelligent Systems Market due to its ability to centralize data storage, analytics, and remote farm monitoring. Cloud platforms enable farmers to access real-time information on soil health, crop growth, weather forecasts, and irrigation needs, supporting precision agriculture practices. Integration with IoT sensors and drones allows seamless data collection and analysis, optimizing resource usage and improving decision-making. Cloud-based systems also facilitate scalability, cost efficiency, and collaboration among stakeholders. Increasing adoption of digital agriculture technologies and rising awareness of data-driven farming solutions in both developed and emerging markets are driving growth in this segment.
The Medium-Scale Farm segment is expected to witness the highest growth over the forecast period as farmers increasingly adopt intelligent systems to optimize operations without the complexities of large-scale farms. Medium-scale farms benefit from AI-driven monitoring, automated irrigation, drones, and data analytics, which help maximize yields, reduce labor, and control costs. These systems provide affordable precision agriculture solutions suitable for farms that are neither too small to justify high investments nor too large to require highly customized infrastructure. Growing demand for efficient resource utilization, increased focus on sustainability, and government initiatives promoting smart farming in medium-scale operations are key factors driving growth in this segment globally.
The Greenhouse Management segment is projected to witness the highest growth due to the increasing adoption of controlled environment agriculture to optimize crop quality and yield. Intelligent systems enable automated monitoring of temperature, humidity, lighting, irrigation, and nutrient supply, reducing manual intervention and resource wastage. Integration with AI and IoT technologies ensures precise decision-making, improved productivity, and disease prevention. Growing demand for off-season and high-value crops, coupled with rising awareness of sustainable farming practices, is driving the adoption of greenhouse automation. Both developed and emerging regions are investing in greenhouse management solutions, positioning this segment for substantial growth over the forecast period.
The North American region is expected to witness the highest growth in the Agricultural Intelligent Systems Market due to rapid adoption of advanced farming technologies and supportive government policies. Farmers in the U.S. and Canada are increasingly leveraging AI, IoT, drones, and cloud-based solutions for precision agriculture, greenhouse management, and resource optimization.
High levels of technological awareness, access to funding, and a strong focus on sustainability and crop productivity drive adoption. For instance, in May 2025, Microsoft Corp. and the National FFA Organization announced the nationwide expansion of FarmBeats for Students, an educational program integrating smart sensors, data science, and AI to teach precision agriculture. FFA teachers and students across 185 U.S. middle and high schools received free classroom kits, including ready-to-use sensors and teaching curriculum, designed for all classrooms without prior technical experience. This initiative promoted technological adoption, AI-based learning, and awareness of precision agriculture, strengthening the future talent pipeline and driving growth in the U.S. agricultural intelligent systems market.
Similarly, in July 2025, Farmers Business Network, a peer-to-peer farmer network and leading North American agricultural marketplace, announced USD 50 million in funding to expand its platform and deploy AI-driven solutions. Supported by investors including GV, Temasek, Arteqin, Colle Capital, and T. Rowe Price, the investment aimed to enhance FBN’s digital platform, streamline access to goods, financing, and services, and establish AI-powered farm-level insights, strengthening family farm prosperity and driving growth in the U.S. agricultural intelligent systems market.
Additionally, the region benefits from well-established agricultural infrastructure and research institutions developing innovative smart farming solutions. Growing demand for efficiency, reduced labor dependency, and high-value crop production further positions North America as the leading market for intelligent agricultural systems.
| Report Matrics | Details |
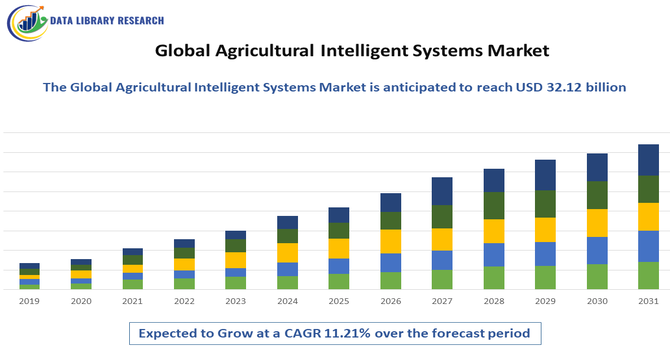
| Market Size Value | USD 32.12 billion |
| Growth Rate | CAGR of 11.21% |
| Forecast | 2026-2033 |
| Historical data | 2021-2024 |
| Base Year | 2025 |
| Report Coverage | Forecasted revenue, company rating, competitive environment, growth drivers, and trends |
| Segment Coverage | Type, Application, End-User, Geography |
| Regional Scope | North America, Europe, Asia Pacific, Middle East |
| Customized scope | Free customization of reports (With 3 months Analysis Support ) |
| To Learn More About This Report | Request a Free Sample Copy |
The competitive landscape of the Global Agricultural Intelligent Systems Market is highly dynamic and increasingly dominated by major agritech and technology firms. Companies like John Deere, AGCO Corporation, Trimble Inc., and IBM Corporation lead through integrated portfolios combining IoT sensors, AI analytics, and autonomous machinery. These players leverage mergers, strategic partnerships, and extensive R&D to introduce innovative solutions and expand their geographic footprint. Meanwhile, emerging niche players focus on specialized applications such as soil health sensors and drone analytics, intensifying competition. The shift from hardware sales to digital services—analytics, software platforms, and subscriptions—is reshaping competitive strategies, encouraging differentiation through ecosystem integration, scalability, and localized support.
The 20 major players for above market are:
Recent Development
Q1. What are the main growth-driving factors for this market?
The market is fundamentally driven by the urgent global need to enhance food security for a rapidly increasing population while facing the challenges of climate change and limited arable land. Intelligent systems, including IoT sensors, drones, and AI, enable precision farming to optimize resource use like water and fertilizer, ensuring sustainable and higher-yield production. Additionally, government initiatives worldwide that promote sustainable and digital farming practices are instrumental in accelerating the market's growth and technological adoption.
Q2. What are the main restraining factors for this market?
A significant hurdle is the high initial investment cost for implementing advanced intelligent systems, such as autonomous equipment and sophisticated data platforms, making them inaccessible for many small and medium-sized farmers. Furthermore, the lack of sufficient technical knowledge and digital literacy among the older farming population, coupled with the challenge of securing reliable, high-speed internet connectivity in remote rural areas, substantially slows the widespread adoption of these interconnected technologies.
Q3. Which segment is expected to witness high growth?
The Software and Advisory Services segment is projected to witness the highest growth rate. While hardware provides the data, the true value lies in the AI-driven software that processes complex agricultural data (from sensors, satellites, etc.) to provide real-time, actionable insights for crop monitoring, predictive analytics, and input optimization. This focus on data-driven decision-making maximizes efficiency, yield, and profitability for farmers, making the software the fastest-growing and most valuable component.
Q4. Who are the top major players for this market?
The market is dominated by major agricultural machinery and technology companies, including global giants like Deere & Company (John Deere), Trimble Inc., Agco Corporation, and CNH Industrial. These players integrate intelligent systems directly into their equipment, offering comprehensive solutions. Additionally, technology firms specializing in data analytics and sensors, such as Bayer AG (through its digital farming platform) and Robert Bosch GmbH, are crucial players providing necessary digital backbone and components.
Q5. Which country is the largest player?
North America, with the United States as the primary country, holds the largest market share by revenue. This dominance is a result of the early and widespread adoption of precision farming techniques, the presence of major global agricultural technology firms, and supportive regulatory frameworks that encourage the use of autonomous and GPS-guided equipment. High average farm sizes and significant investment in R&D further solidify the region's leadership in deploying sophisticated intelligent agricultural systems.
Data Library Research are conducted by industry experts who offer insight on industry structure, market segmentations technology assessment and competitive landscape (CL), and penetration, as well as on emerging trends. Their analysis is based on primary interviews (~ 80%) and secondary research (~ 20%) as well as years of professional expertise in their respective industries. Adding to this, by analysing historical trends and current market positions, our analysts predict where the market will be headed for the next five years. Furthermore, the varying trends of segment & categories geographically presented are also studied and the estimated based on the primary & secondary research.
In this particular report from the supply side Data Library Research has conducted primary surveys (interviews) with the key level executives (VP, CEO’s, Marketing Director, Business Development Manager and SOFT) of the companies that active & prominent as well as the midsized organization
FIGURE 1: DLR RESEARH PROCESS
Extensive primary research was conducted to gain a deeper insight of the market and industry performance. The analysis is based on both primary and secondary research as well as years of professional expertise in the respective industries.
In addition to analysing current and historical trends, our analysts predict where the market is headed over the next five years.
It varies by segment for these categories geographically presented in the list of market tables. Speaking about this particular report we have conducted primary surveys (interviews) with the key level executives (VP, CEO’s, Marketing Director, Business Development Manager and many more) of the major players active in the market.
Secondary ResearchSecondary research was mainly used to collect and identify information useful for the extensive, technical, market-oriented, and Friend’s study of the Global Extra Neutral Alcohol. It was also used to obtain key information about major players, market classification and segmentation according to the industry trends, geographical markets, and developments related to the market and technology perspectives. For this study, analysts have gathered information from various credible sources, such as annual reports, sec filings, journals, white papers, SOFT presentations, and company web sites.
Market Size EstimationBoth, top-down and bottom-up approaches were used to estimate and validate the size of the Global market and to estimate the size of various other dependent submarkets in the overall Extra Neutral Alcohol. The key players in the market were identified through secondary research and their market contributions in the respective geographies were determined through primary and secondary research.
Forecast Model