Automotive Intelligent Chassis Market Overview and Analysis:
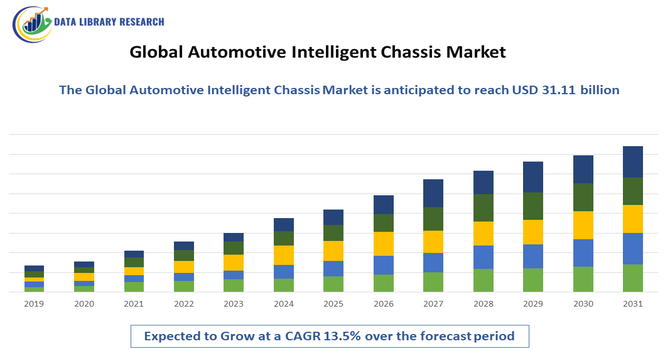
- The Global Automotive Intelligent Chassis Market is projected for strong growth, driven by the rapid adoption of ADAS and enhanced vehicle safety features. The market is forecasted to expand from approximately USD 7.92 billion in 2025 to reach around USD 31.11 billion by 2032, achieving an impressive Compound Annual Growth Rate (CAGR) of 13.5% during this period, 2025-2032.
Get Complete Analysis Of The Report - Download Updated Free Sample PDF
The Global Automotive Intelligent Chassis Market is experiencing significant growth driven by the increasing demand for advanced vehicle safety, enhanced driving performance, and improved fuel efficiency. Rising adoption of electric vehicles (EVs), autonomous driving technologies, and connected car systems is accelerating the integration of intelligent chassis solutions that offer real-time adaptive control, stability, and ride comfort.
Automotive Intelligent Chassis Market Latest Trends:
The Global Automotive Intelligent Chassis market is witnessing a shift toward fully digital, software-defined chassis architectures that integrate steering, suspension, braking, and stability control under centralized electronic management for real-time adaptive handling. Adoption of “by-wire” technologies, such as steer-by-wire, brake-by-wire, and suspension-by-wire, is increasing, particularly in electric and autonomous vehicles, offering enhanced safety, ride comfort, and flexible vehicle design. Additionally, AI-driven sensor fusion and real-time control algorithms are being integrated to predictively adjust suspension and stability based on road conditions, vehicle dynamics, and driver behavior, improving energy efficiency and overall performance. Manufacturers are also focusing on lightweight materials and modular chassis platforms to support EV architectures, reduce vehicle weight, and enhance handling dynamics.
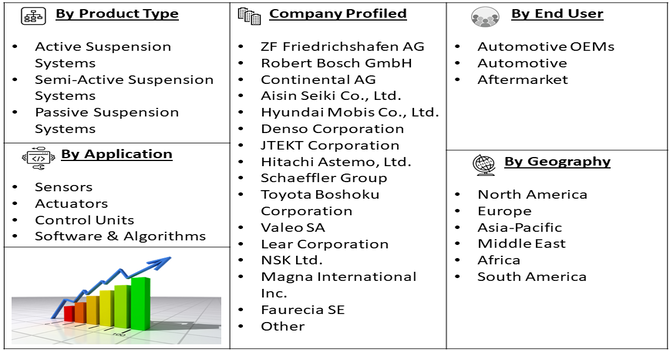
Segmentation: Global Automotive Intelligent Chassis Market is segmented By Chassis Type (Active Suspension Systems, Semi-Active Suspension Systems, Passive Suspension Systems), Vehicle Type (Passenger Cars, Light Commercial Vehicles, Heavy Commercial Vehicles), Component (Sensors, Actuators, Control Units, Software & Algorithms), End-Use Industry (Automotive OEMs, Automotive Aftermarket), and Geography (North America, Europe, Asia-Pacific, Middle East and Africa, and South America). The report provides the value (in USD million) for the above segments.
For Detailed Market Segmentation - Get a Free Sample PDF
Market Drivers:
- Increasing Adoption of Electric Vehicles (EVs) and Autonomous Driving Technologies
The growing penetration of electric vehicles (EVs) and autonomous vehicles is a key driver of the Global Automotive Intelligent Chassis Market. EVs require advanced chassis systems to manage battery weight distribution, enhance stability, and optimize ride comfort, while autonomous vehicles rely on intelligent chassis for precise handling, braking, and steering control.
In October 2025, bp pulse expanded EV infrastructure near Houston’s Hobby Airport with 40 ultrafast charging bays, enhancing accessibility for electric vehicle users. This development supported the increasing adoption of EVs and autonomous driving technologies by reducing charging constraints. It also indirectly boosted the automotive intelligent chassis market, as broader EV adoption accelerated demand for advanced, software-driven chassis systems in next-generation vehicles. As the automotive industry shifts toward electrification and autonomous mobility, the demand for sophisticated chassis technologies is accelerating, driving market growth across passenger and commercial vehicle segments.
- Rising Demand for Vehicle Safety and Enhanced Driving Performance
Enhanced vehicle safety and improved driving performance are major factors propelling the adoption of intelligent chassis systems. Advanced chassis technologies, such as active suspension, torque vectoring, and electronic stability control, help maintain vehicle stability during cornering, braking, and uneven terrain, reducing the risk of accidents. Additionally, these systems improve ride comfort, handling, and fuel efficiency, which are critical for consumer satisfaction and regulatory compliance. Increasing consumer awareness of safety features and stringent government safety regulations worldwide are further encouraging automakers to integrate intelligent chassis solutions, thereby driving the overall market growth.
Market Restraints:
- High Cost of Advanced Chassis Systems
The high cost associated with designing, manufacturing, and integrating advanced chassis technologies. Intelligent chassis systems, which include active suspension, torque vectoring, electronic stability control, and sensor-driven components, require sophisticated electronic control units, high-precision sensors, and complex actuators. The high R&D investment, production costs, and expensive components increase the overall vehicle price, making these systems less accessible for budget and mid-range vehicles. This cost factor limits adoption, particularly in emerging markets where price sensitivity is high, and restrains the market growth.
Socioeconomic Impact on the Automotive Intelligent Chassis Market
The global automotive intelligent chassis market is significantly influenced by socioeconomic factors, as consumer purchasing power, urbanization, and changing lifestyle trends shape demand for advanced vehicle technologies. Rising disposable incomes in emerging economies are enabling more consumers to afford vehicles equipped with intelligent chassis systems, which enhance safety, comfort, and driving performance. Additionally, increasing awareness of road safety and government initiatives promoting smart and connected vehicles are accelerating market adoption. Conversely, economic slowdowns or income disparities can hinder widespread implementation, particularly in cost-sensitive regions. The shift towards electric and autonomous vehicles further underscores the socioeconomic impact, as investments in innovative chassis technologies are closely tied to consumer willingness and government policies supporting sustainable, technologically advanced transportation solutions.
Segmental Analysis:
- Active Suspension Systems segment is expected to witness highest growth over the forecast period
Active suspension systems are a key growth segment as they dynamically adjust suspension settings in real-time to improve ride comfort, handling, and vehicle stability. These systems use sensors and actuators to respond to road conditions, reducing body roll, vibrations, and improving overall safety. Their adoption is increasing in premium passenger cars, sports vehicles, and luxury commercial vehicles, where enhanced driving performance is a priority.
Furthermore, the integration of active suspension systems with advanced driver-assistance systems (ADAS) and intelligent chassis technologies is boosting their market potential. Automakers are leveraging these systems to deliver adaptive, predictive responses to varying driving conditions, enhancing passenger comfort and safety. Growing consumer demand for superior driving experiences continues to drive adoption across multiple vehicle segments.
- Passenger Cars segment is expected to witness highest growth over the forecast period
Passenger cars represent a major segment in the intelligent chassis market due to high consumer demand for comfort, safety, and performance. Features such as active suspension, electronic stability control, and torque vectoring are increasingly integrated into modern cars to meet regulatory safety standards and customer expectations.
- Sensors segment is expected to witness highest growth over the forecast period
Sensors form the backbone of intelligent chassis systems, enabling real-time monitoring of vehicle dynamics, road conditions, and driver inputs. Advanced accelerometers, gyroscopes, and position sensors allow precise control of suspension, braking, and steering systems, ensuring enhanced stability, safety, and ride quality.
- Automotive OEMs segment is expected to witness highest growth over the forecast period
Automotive OEMs drive significant demand for intelligent chassis systems as they integrate these solutions directly into new vehicle models. OEM adoption ensures optimized design, performance, and reliability while enabling differentiation in safety, handling, and comfort features across passenger and commercial vehicles.
- North America segment is expected to witness highest growth over the forecast period
North America is expected to witness the highest growth due to the region’s strong automotive industry, early adoption of EVs and autonomous vehicles, and stringent safety regulations. Rising demand for advanced vehicle safety, connected cars, and high-performance driving experiences is accelerating intelligent chassis deployment in the region. For instance, in August 2025, Ford Motor Company made a significant impact on the U.S. automotive intelligent chassis market by introducing its Universal EV Platform and Production System. By combining over a century of automotive expertise with innovative EV development approaches, Ford enabled more efficient integration of advanced chassis technologies. This move accelerated the adoption of intelligent, software-driven chassis systems in affordable electric vehicles across the U.S.
Moreover, North America’s well-established technological infrastructure and significant investments in research and development are further fueling the adoption of intelligent chassis systems. Leading automakers and tech companies are collaborating to integrate AI-driven and connected solutions, enhancing vehicle stability, handling, and overall safety. Government incentives for electric and autonomous vehicles, combined with consumer preference for innovative driving technologies, are expected to sustain the region’s dominance in the global automotive intelligent chassis market.
| Report Matrics |
Details |
| Market Size Value |
USD 31.11 billion |
| Growth Rate |
CAGR of 13.5% |
| Forecast |
2026-2033 |
| Historical data |
2021-2024 |
| Base Year |
2025 |
| Report Coverage |
Forecasted revenue, company rating, competitive environment, growth drivers, and trends |
| Segment Coverage |
Type, Application, End-User, Geography |
| Regional Scope |
North America, Europe, Asia Pacific, Middle East |
| Customized scope |
Free customization of reports (With 3 months' analysis support) |
| To Learn More About This Report |
Request a Free Sample Copy |
Automotive Intelligent Chassis Market Competitive Landscape:
The Global Automotive Intelligent Chassis Market is highly competitive, with a mix of established automotive component manufacturers and technology-focused innovators competing on advanced features, safety, performance, and integration capabilities. Companies are investing heavily in R&D to develop next-generation chassis technologies, including active and semi-active suspension systems, torque vectoring, electronic stability control, and by-wire solutions. Strategic collaborations with automakers, technology licensing, and global expansion are key strategies to strengthen market presence. Continuous innovations in lightweight materials, AI-enabled control systems, and software-driven chassis management further intensify competition, as manufacturers strive to meet rising demand from passenger and commercial vehicles globally.
Key Players:
- ZF Friedrichshafen AG
- Robert Bosch GmbH
- Continental AG
- Aisin Seiki Co., Ltd.
- Hyundai Mobis Co., Ltd.
- Denso Corporation
- JTEKT Corporation
- Hitachi Astemo, Ltd.
- Schaeffler Group
- Toyota Boshoku Corporation
- Valeo SA
- Lear Corporation
- NSK Ltd.
- Magna International Inc.
- Faurecia SE
- KYB Corporation
- Delphi Technologies (BorgWarner)
- Hyundai WIA Corporation
- GKN Automotive
- Mando Corporation
Recent Development
- In September 2025, Qualcomm Technologies, Inc. and Google Cloud announced an expansion of their partnership to support automakers in delivering improved in-car experiences using agentic AI. The collaboration combined Google Cloud’s Automotive AI Agent, powered by Gemini models, with Qualcomm’s Snapdragon® Digital Chassis solutions, enabling automakers to develop and deploy multimodal, hybrid edge-to-cloud AI agents. This initiative aimed to enhance vehicle intelligence and streamline AI integration across automotive platforms.
- In August 2025, ZF Friedrichshafen advanced support for software-defined vehicles by introducing the cubiX tuner and an enhanced chassis sensor, aimed at simplifying and accelerating SDV chassis calibration. This development positively impacted the global automotive intelligent chassis market by enabling faster, more precise vehicle adjustments and promoting the adoption of advanced chassis technologies. Automakers benefited from improved system efficiency, reduced development time, and enhanced integration of intelligent, software-driven chassis solutions across new vehicle models.
Frequently Asked Questions (FAQ) :
Q1. What are the main growth-driving factors for this market?
Growth is primarily driven by the worldwide increase in demand for electric vehicles (EVs) and the rapid development of autonomous driving systems (ADAS). These technologies require sophisticated, flexible chassis systems that can integrate complex sensors, electronic controls, and battery architectures, significantly boosting market demand.
Q2. What are the main restraining factors for this market?
The biggest constraints are the high initial cost of manufacturing and integrating intelligent components, especially for mid-range vehicles. Additionally, the increasing complexity of these software-defined systems poses significant challenges in ensuring their reliability, safety, and compatibility across various vehicle models.
Q3. Which segment is expected to witness high growth?
The Active Suspension Systems segment was expected to witness the highest growth over the forecast period due to increasing demand for enhanced ride comfort, vehicle stability, and safety. Technological advancements, integration with intelligent chassis platforms, and rising adoption in luxury, electric, and autonomous vehicles drove the accelerated market expansion.
Q4. Who are the top major players for this market?
The market is dominated by Tier-1 automotive technology suppliers. Key players include major German companies like Robert Bosch GmbH, Continental AG, and ZF Friedrichshafen AG, who lead in developing and supplying the advanced sensors, actuators, and electronic control units that define intelligent chassis systems.
Q5. Which country is the largest player?
The North America segment was projected to witness the highest growth over the forecast period due to its strong automotive industry, early adoption of electric and autonomous vehicles, and strict safety regulations. Rising demand for connected cars, advanced driver-assistance systems, and high-performance driving experiences further accelerated intelligent chassis deployment in the region.
List of Figures
Figure 1: Global Automotive Intelligent Chassis Market Revenue Breakdown (USD Billion, %) by Region, 2022 & 2029
Figure 2: Global Automotive Intelligent Chassis Market Value Share (%), By Segment 1, 2022 & 2029
Figure 3: Global Automotive Intelligent Chassis Market Forecast (USD Billion), by Sub-Segment 1, 2018-2029
Figure 4: Global Automotive Intelligent Chassis Market Forecast (USD Billion), by Sub-Segment 2, 2018-2029
Figure 5: Global Automotive Intelligent Chassis Market Value Share (%), By Segment 2, 2022 & 2029
Figure 6: Global Automotive Intelligent Chassis Market Forecast (USD Billion), by Sub-Segment 1, 2018-2029
Figure 7: Global Automotive Intelligent Chassis Market Forecast (USD Billion), by Sub-Segment 2, 2018-2029
Figure 8: Global Automotive Intelligent Chassis Market Forecast (USD Billion), by Sub-Segment 3, 2018-2029
Figure 9: Global Automotive Intelligent Chassis Market Forecast (USD Billion), by Others, 2018-2029
Figure 10: Global Automotive Intelligent Chassis Market Value Share (%), By Segment 3, 2022 & 2029
Figure 11: Global Automotive Intelligent Chassis Market Forecast (USD Billion), by Sub-Segment 1, 2018-2029
Figure 12: Global Automotive Intelligent Chassis Market Forecast (USD Billion), by Sub-Segment 2, 2018-2029
Figure 13: Global Automotive Intelligent Chassis Market Forecast (USD Billion), by Sub-Segment 3, 2018-2029
Figure 14: Global Automotive Intelligent Chassis Market Forecast (USD Billion), by Others, 2018-2029
Figure 15: Global Automotive Intelligent Chassis Market Value (USD Billion), by Region, 2022 & 2029
Figure 16: North America Automotive Intelligent Chassis Market Value Share (%), By Segment 1, 2022 & 2029
Figure 17: North America Automotive Intelligent Chassis Market Forecast (USD Billion), by Sub-Segment 1, 2018-2029
Figure 18: North America Automotive Intelligent Chassis Market Forecast (USD Billion), by Sub-Segment 2, 2018-2029
Figure 19: North America Automotive Intelligent Chassis Market Value Share (%), By Segment 2, 2022 & 2029
Figure 20: North America Automotive Intelligent Chassis Market Forecast (USD Billion), by Sub-Segment 1, 2018-2029
Figure 21: North America Automotive Intelligent Chassis Market Forecast (USD Billion), by Sub-Segment 2, 2018-2029
Figure 22: North America Automotive Intelligent Chassis Market Forecast (USD Billion), by Sub-Segment 3, 2018-2029
Figure 23: North America Automotive Intelligent Chassis Market Forecast (USD Billion), by Others, 2018-2029
Figure 24: North America Automotive Intelligent Chassis Market Value Share (%), By Segment 3, 2022 & 2029
Figure 25: North America Automotive Intelligent Chassis Market Forecast (USD Billion), by Sub-Segment 1, 2018-2029
Figure 26: North America Automotive Intelligent Chassis Market Forecast (USD Billion), by Sub-Segment 2, 2018-2029
Figure 27: North America Automotive Intelligent Chassis Market Forecast (USD Billion), by Sub-Segment 3, 2018-2029
Figure 28: North America Automotive Intelligent Chassis Market Forecast (USD Billion), by Others, 2018-2029
Figure 29: North America Automotive Intelligent Chassis Market Forecast (USD Billion), by U.S., 2018-2029
Figure 30: North America Automotive Intelligent Chassis Market Forecast (USD Billion), by Canada, 2018-2029
Figure 31: Latin America Automotive Intelligent Chassis Market Value Share (%), By Segment 1, 2022 & 2029
Figure 32: Latin America Automotive Intelligent Chassis Market Forecast (USD Billion), by Sub-Segment 1, 2018-2029
Figure 33: Latin America Automotive Intelligent Chassis Market Forecast (USD Billion), by Sub-Segment 2, 2018-2029
Figure 34: Latin America Automotive Intelligent Chassis Market Value Share (%), By Segment 2, 2022 & 2029
Figure 35: Latin America Automotive Intelligent Chassis Market Forecast (USD Billion), by Sub-Segment 1, 2018-2029
Figure 36: Latin America Automotive Intelligent Chassis Market Forecast (USD Billion), by Sub-Segment 2, 2018-2029
Figure 37: Latin America Automotive Intelligent Chassis Market Forecast (USD Billion), by Sub-Segment 3, 2018-2029
Figure 38: Latin America Automotive Intelligent Chassis Market Forecast (USD Billion), by Others, 2018-2029
Figure 39: Latin America Automotive Intelligent Chassis Market Value Share (%), By Segment 3, 2022 & 2029
Figure 40: Latin America Automotive Intelligent Chassis Market Forecast (USD Billion), by Sub-Segment 1, 2018-2029
Figure 41: Latin America Automotive Intelligent Chassis Market Forecast (USD Billion), by Sub-Segment 2, 2018-2029
Figure 42: Latin America Automotive Intelligent Chassis Market Forecast (USD Billion), by Sub-Segment 3, 2018-2029
Figure 43: Latin America Automotive Intelligent Chassis Market Forecast (USD Billion), by Others, 2018-2029
Figure 44: Latin America Automotive Intelligent Chassis Market Forecast (USD Billion), by Brazil, 2018-2029
Figure 45: Latin America Automotive Intelligent Chassis Market Forecast (USD Billion), by Mexico, 2018-2029
Figure 46: Latin America Automotive Intelligent Chassis Market Forecast (USD Billion), by Rest of Latin America, 2018-2029
Figure 47: Europe Automotive Intelligent Chassis Market Value Share (%), By Segment 1, 2022 & 2029
Figure 48: Europe Automotive Intelligent Chassis Market Forecast (USD Billion), by Sub-Segment 1, 2018-2029
Figure 49: Europe Automotive Intelligent Chassis Market Forecast (USD Billion), by Sub-Segment 2, 2018-2029
Figure 50: Europe Automotive Intelligent Chassis Market Value Share (%), By Segment 2, 2022 & 2029
Figure 51: Europe Automotive Intelligent Chassis Market Forecast (USD Billion), by Sub-Segment 1, 2018-2029
Figure 52: Europe Automotive Intelligent Chassis Market Forecast (USD Billion), by Sub-Segment 2, 2018-2029
Figure 53: Europe Automotive Intelligent Chassis Market Forecast (USD Billion), by Sub-Segment 3, 2018-2029
Figure 54: Europe Automotive Intelligent Chassis Market Forecast (USD Billion), by Others, 2018-2029
Figure 55: Europe Automotive Intelligent Chassis Market Value Share (%), By Segment 3, 2022 & 2029
Figure 56: Europe Automotive Intelligent Chassis Market Forecast (USD Billion), by Sub-Segment 1, 2018-2029
Figure 57: Europe Automotive Intelligent Chassis Market Forecast (USD Billion), by Sub-Segment 2, 2018-2029
Figure 58: Europe Automotive Intelligent Chassis Market Forecast (USD Billion), by Sub-Segment 3, 2018-2029
Figure 59: Europe Automotive Intelligent Chassis Market Forecast (USD Billion), by Others, 2018-2029
Figure 60: Europe Automotive Intelligent Chassis Market Forecast (USD Billion), by U.K., 2018-2029
Figure 61: Europe Automotive Intelligent Chassis Market Forecast (USD Billion), by Germany, 2018-2029
Figure 62: Europe Automotive Intelligent Chassis Market Forecast (USD Billion), by France, 2018-2029
Figure 63: Europe Automotive Intelligent Chassis Market Forecast (USD Billion), by Italy, 2018-2029
Figure 64: Europe Automotive Intelligent Chassis Market Forecast (USD Billion), by Spain, 2018-2029
Figure 65: Europe Automotive Intelligent Chassis Market Forecast (USD Billion), by Russia, 2018-2029
Figure 66: Europe Automotive Intelligent Chassis Market Forecast (USD Billion), by Rest of Europe, 2018-2029
Figure 67: Asia Pacific Automotive Intelligent Chassis Market Value Share (%), By Segment 1, 2022 & 2029
Figure 68: Asia Pacific Automotive Intelligent Chassis Market Forecast (USD Billion), by Sub-Segment 1, 2018-2029
Figure 69: Asia Pacific Automotive Intelligent Chassis Market Forecast (USD Billion), by Sub-Segment 2, 2018-2029
Figure 70: Asia Pacific Automotive Intelligent Chassis Market Value Share (%), By Segment 2, 2022 & 2029
Figure 71: Asia Pacific Automotive Intelligent Chassis Market Forecast (USD Billion), by Sub-Segment 1, 2018-2029
Figure 72: Asia Pacific Automotive Intelligent Chassis Market Forecast (USD Billion), by Sub-Segment 2, 2018-2029
Figure 73: Asia Pacific Automotive Intelligent Chassis Market Forecast (USD Billion), by Sub-Segment 3, 2018-2029
Figure 74: Asia Pacific Automotive Intelligent Chassis Market Forecast (USD Billion), by Others, 2018-2029
Figure 75: Asia Pacific Automotive Intelligent Chassis Market Value Share (%), By Segment 3, 2022 & 2029
Figure 76: Asia Pacific Automotive Intelligent Chassis Market Forecast (USD Billion), by Sub-Segment 1, 2018-2029
Figure 77: Asia Pacific Automotive Intelligent Chassis Market Forecast (USD Billion), by Sub-Segment 2, 2018-2029
Figure 78: Asia Pacific Automotive Intelligent Chassis Market Forecast (USD Billion), by Sub-Segment 3, 2018-2029
Figure 79: Asia Pacific Automotive Intelligent Chassis Market Forecast (USD Billion), by Others, 2018-2029
Figure 80: Asia Pacific Automotive Intelligent Chassis Market Forecast (USD Billion), by China, 2018-2029
Figure 81: Asia Pacific Automotive Intelligent Chassis Market Forecast (USD Billion), by India, 2018-2029
Figure 82: Asia Pacific Automotive Intelligent Chassis Market Forecast (USD Billion), by Japan, 2018-2029
Figure 83: Asia Pacific Automotive Intelligent Chassis Market Forecast (USD Billion), by Australia, 2018-2029
Figure 84: Asia Pacific Automotive Intelligent Chassis Market Forecast (USD Billion), by Southeast Asia, 2018-2029
Figure 85: Asia Pacific Automotive Intelligent Chassis Market Forecast (USD Billion), by Rest of Asia Pacific, 2018-2029
Figure 86: Middle East & Africa Automotive Intelligent Chassis Market Value Share (%), By Segment 1, 2022 & 2029
Figure 87: Middle East & Africa Automotive Intelligent Chassis Market Forecast (USD Billion), by Sub-Segment 1, 2018-2029
Figure 88: Middle East & Africa Automotive Intelligent Chassis Market Forecast (USD Billion), by Sub-Segment 2, 2018-2029
Figure 89: Middle East & Africa Automotive Intelligent Chassis Market Value Share (%), By Segment 2, 2022 & 2029
Figure 90: Middle East & Africa Automotive Intelligent Chassis Market Forecast (USD Billion), by Sub-Segment 1, 2018-2029
Figure 91: Middle East & Africa Automotive Intelligent Chassis Market Forecast (USD Billion), by Sub-Segment 2, 2018-2029
Figure 92: Middle East & Africa Automotive Intelligent Chassis Market Forecast (USD Billion), by Sub-Segment 3, 2018-2029
Figure 93: Middle East & Africa Automotive Intelligent Chassis Market Forecast (USD Billion), by Others, 2018-2029
Figure 94: Middle East & Africa Automotive Intelligent Chassis Market Value Share (%), By Segment 3, 2022 & 2029
Figure 95: Middle East & Africa Automotive Intelligent Chassis Market Forecast (USD Billion), by Sub-Segment 1, 2018-2029
Figure 96: Middle East & Africa Automotive Intelligent Chassis Market Forecast (USD Billion), by Sub-Segment 2, 2018-2029
Figure 97: Middle East & Africa Automotive Intelligent Chassis Market Forecast (USD Billion), by Sub-Segment 3, 2018-2029
Figure 98: Middle East & Africa Automotive Intelligent Chassis Market Forecast (USD Billion), by Others, 2018-2029
Figure 99: Middle East & Africa Automotive Intelligent Chassis Market Forecast (USD Billion), by GCC, 2018-2029
Figure 100: Middle East & Africa Automotive Intelligent Chassis Market Forecast (USD Billion), by South Africa, 2018-2029
Figure 101: Middle East & Africa Automotive Intelligent Chassis Market Forecast (USD Billion), by Rest of Middle East & Africa, 2018-2029
List of Tables
Table 1: Global Automotive Intelligent Chassis Market Revenue (USD Billion) Forecast, by Segment 1, 2018-2029
Table 2: Global Automotive Intelligent Chassis Market Revenue (USD Billion) Forecast, by Segment 2, 2018-2029
Table 3: Global Automotive Intelligent Chassis Market Revenue (USD Billion) Forecast, by Segment 3, 2018-2029
Table 4: Global Automotive Intelligent Chassis Market Revenue (USD Billion) Forecast, by Region, 2018-2029
Table 5: North America Automotive Intelligent Chassis Market Revenue (USD Billion) Forecast, by Segment 1, 2018-2029
Table 6: North America Automotive Intelligent Chassis Market Revenue (USD Billion) Forecast, by Segment 2, 2018-2029
Table 7: North America Automotive Intelligent Chassis Market Revenue (USD Billion) Forecast, by Segment 3, 2018-2029
Table 8: North America Automotive Intelligent Chassis Market Revenue (USD Billion) Forecast, by Country, 2018-2029
Table 9: Europe Automotive Intelligent Chassis Market Revenue (USD Billion) Forecast, by Segment 1, 2018-2029
Table 10: Europe Automotive Intelligent Chassis Market Revenue (USD Billion) Forecast, by Segment 2, 2018-2029
Table 11: Europe Automotive Intelligent Chassis Market Revenue (USD Billion) Forecast, by Segment 3, 2018-2029
Table 12: Europe Automotive Intelligent Chassis Market Revenue (USD Billion) Forecast, by Country, 2018-2029
Table 13: Latin America Automotive Intelligent Chassis Market Revenue (USD Billion) Forecast, by Segment 1, 2018-2029
Table 14: Latin America Automotive Intelligent Chassis Market Revenue (USD Billion) Forecast, by Segment 2, 2018-2029
Table 15: Latin America Automotive Intelligent Chassis Market Revenue (USD Billion) Forecast, by Segment 3, 2018-2029
Table 16: Latin America Automotive Intelligent Chassis Market Revenue (USD Billion) Forecast, by Country, 2018-2029
Table 17: Asia Pacific Automotive Intelligent Chassis Market Revenue (USD Billion) Forecast, by Segment 1, 2018-2029
Table 18: Asia Pacific Automotive Intelligent Chassis Market Revenue (USD Billion) Forecast, by Segment 2, 2018-2029
Table 19: Asia Pacific Automotive Intelligent Chassis Market Revenue (USD Billion) Forecast, by Segment 3, 2018-2029
Table 20: Asia Pacific Automotive Intelligent Chassis Market Revenue (USD Billion) Forecast, by Country, 2018-2029
Table 21: Middle East & Africa Automotive Intelligent Chassis Market Revenue (USD Billion) Forecast, by Segment 1, 2018-2029
Table 22: Middle East & Africa Automotive Intelligent Chassis Market Revenue (USD Billion) Forecast, by Segment 2, 2018-2029
Table 23: Middle East & Africa Automotive Intelligent Chassis Market Revenue (USD Billion) Forecast, by Segment 3, 2018-2029
Table 24: Middle East & Africa Automotive Intelligent Chassis Market Revenue (USD Billion) Forecast, by Country, 2018-2029
Research Process
Data Library Research are conducted by industry experts who offer insight on
industry structure, market segmentations technology assessment and competitive landscape (CL), and penetration, as well as on emerging trends. Their analysis is based on primary interviews (~ 80%) and secondary research (~ 20%) as well as years of professional expertise in their respective industries. Adding to this, by analysing historical trends and current market positions, our analysts predict where the market will be headed for the next five years. Furthermore, the varying trends of segment & categories geographically presented are also studied and the estimated based on the primary & secondary research.
In this particular report from the supply side Data Library Research has conducted primary surveys (interviews) with the key level executives (VP, CEO’s, Marketing Director, Business Development Manager
and SOFT) of the companies that active & prominent as well as the midsized organization
FIGURE 1: DLR RESEARH PROCESS
![research-methodology1]()
Primary Research
Extensive primary research was conducted to gain a deeper insight of the market and industry performance. The analysis is based on both primary and secondary research as well as years of professional expertise in the respective industries.
In addition to analysing current and historical trends, our analysts predict where the market is headed over the next five years.
It varies by segment for these categories geographically presented in the list of market tables. Speaking about this particular report we have conducted primary surveys (interviews) with the key level executives (VP, CEO’s, Marketing Director, Business Development Manager and many more) of the major players active in the market.
Secondary Research
Secondary research was mainly used to collect and identify information useful for the extensive, technical, market-oriented, and Friend’s study of the Global Extra Neutral Alcohol. It was also used to obtain key information about major players, market classification and segmentation according to the industry trends, geographical markets, and developments related to the market and technology perspectives. For this study, analysts have gathered information from various credible sources, such as annual reports, sec filings, journals, white papers, SOFT presentations, and company web sites.
Market Size Estimation
Both, top-down and bottom-up approaches were used to estimate and validate the size of the Global market and to estimate the size of various other dependent submarkets in the overall Extra Neutral Alcohol. The key players in the market were identified through secondary research and their market contributions in the respective geographies were determined through primary and secondary research.
Forecast Model
![research-methodology2]()