Automotive Automatic Gearbox Market Overview and Analysis
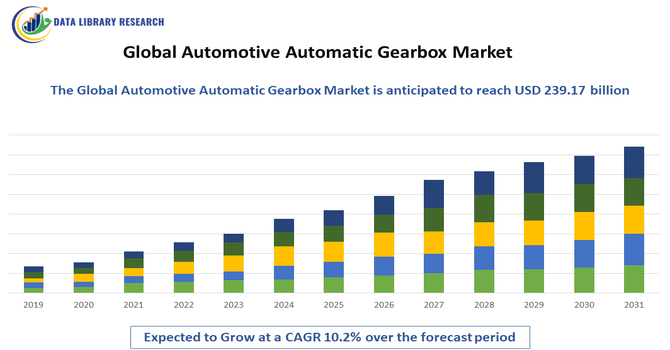
- The Global Automotive Automatic Gearbox Market size was valued at USD 172.50 billion in 2025 and is projected to reach USD 239.17 billion by 2032, growing with a CAGR of 10.2% from 2025-2032.
Get Complete Analysis Of The Report - Download Updated Free Sample PDF
The Global Automotive Automatic Gearbox Market refers to the worldwide industry involved in the design, manufacturing, and sale of automatic transmission systems for vehicles. Automatic gearboxes, including conventional torque converter, dual-clutch, and continuously variable transmissions (CVTs), allow vehicles to shift gears without driver intervention, improving driving comfort, efficiency, and performance. Market growth is driven by rising vehicle production, increasing demand for fuel-efficient and luxury vehicles, and technological advancements in transmission systems. It serves passenger cars, commercial vehicles, and electric vehicles globally.
Automotive Automatic Gearbox Market Latest Trends
The global automotive automatic gearbox market is witnessing rapid innovation driven by the rising adoption of electric vehicles (EVs) and hybrid vehicles. Advanced technologies, such as dual-clutch transmissions (DCT), continuously variable transmissions (CVT), and intelligent electronic control systems, are improving fuel efficiency and driving performance. Increasing consumer preference for comfort and ease of driving, along with stricter emission regulations, is pushing manufacturers to enhance automatic gearbox efficiency.
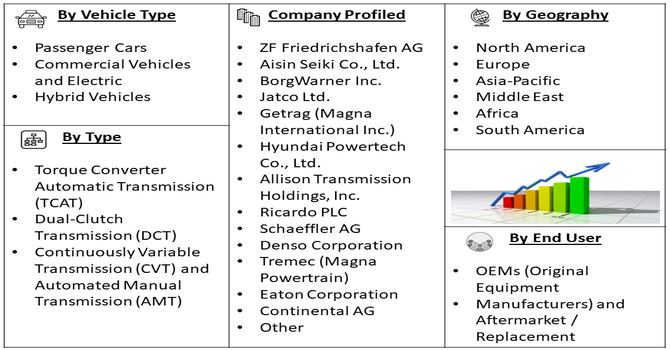
Segmentation: The Global Automotive Automatic Gearbox Market is segmented by Transmission Type (Torque Converter Automatic Transmission (TCAT), Dual-Clutch Transmission (DCT), Continuously Variable Transmission (CVT) and Automated Manual Transmission (AMT)), Vehicle Type (Passenger Cars, Commercial Vehicles and Electric & Hybrid Vehicles), End-User (OEMs (Original Equipment Manufacturers) and Aftermarket / Replacement), and Geography (North America, Europe, Asia-Pacific, Middle East and Africa, and South America). The report provides the value (in USD million) for the above segments.
For Detailed Market Segmentation - Get a Free Sample PDF
Market Drivers:
- Rising Demand for Passenger Comfort and Convenience
The increasing consumer preference for comfort, ease of driving, and convenience has driven the growth of automatic gearboxes in vehicles worldwide. Automatic transmissions eliminate manual gear shifting, reducing driver fatigue, especially in urban traffic conditions. Rising disposable incomes and growing adoption of luxury and mid-range passenger vehicles further fuel demand.
In June 2023, AISIN CORPORATION’s USD 200 million investment to establish two hybrid transmission production lines in North Carolina supports its electrification and carbon-neutral strategy. Producing 30,000 two-motor hybrid transmissions monthly, the project integrates advanced automation and workforce training. This expansion boosts global supply capacity, accelerates adoption of hybrid automatic gearboxes, and strengthens growth prospects in the global automotive automatic gearbox market. Consequently, OEMs are integrating advanced automatic transmissions in new vehicle models to meet consumer expectations, making comfort and convenience a major driver of market expansion.
- Growth of Electric and Hybrid Vehicles
The rise of electric vehicles (EVs) and hybrid electric vehicles (HEVs) has accelerated demand for advanced automatic gearbox systems. EVs and hybrids require precise, efficient, and electronically controlled transmission systems to optimize performance and energy efficiency.
Governments’ stringent fuel efficiency and emission regulations globally have further encouraged adoption of automatic gearboxes in eco-friendly vehicles. For instance, India’s Ministry of Heavy Industries reported that as of July 8, 2024, India registered 8,42,396 EVs in H1 2024, a 16% increase over H1 2023, supported by 16,344 public charging stations and 10,756 fast chargers. This surge boosts the growth of electric and hybrid vehicles, driving demand for automatic gearboxes in the global automotive market. Additionally, technological innovations, such as dual-clutch and continuously variable transmissions, complement electric drivetrains by providing smooth acceleration and enhanced driving experience.
Market Restraints:
- High Cost of Automatic Transmission Systems
The relatively high manufacturing and maintenance costs of automatic gearboxes act as a significant restraint for market growth. Advanced systems like dual-clutch, CVT, and electronically controlled transmissions require expensive components, precision engineering, and sophisticated software integration, increasing vehicle costs. High repair and replacement expenses further discourage adoption among cost-sensitive consumers, particularly in developing regions. Additionally, increased complexity can raise production challenges for OEMs and limit widespread penetration in entry-level and budget vehicles.
Socioeconomic Impact on Automotive Automatic Gearbox Market
Automatic gearboxes significantly influence socioeconomic factors by enhancing vehicle accessibility, safety, and fuel efficiency. They reduce driver fatigue and improve road safety, benefiting urban populations and professional drivers. The technology supports adoption of EVs and hybrids, contributing to reduced carbon emissions and environmental sustainability. Industrially, gearbox manufacturing creates employment opportunities in automotive engineering, electronics, and assembly sectors. Investments in R&D drive innovation, while luxury and commercial vehicle adoption boosts economic activity. Thus, the market contributes to technological advancement, sustainable mobility, and improved quality of life, reflecting its broad socioeconomic impact across both developed and emerging regions.
Segmental Analysis:
- Dual-Clutch Transmission (DCT) segment is expected to witness highest growth over the forecast period
The Dual-Clutch Transmission (DCT) segment is expected to grow rapidly due to its combination of manual transmission efficiency and automatic transmission convenience. DCT systems provide faster gear shifts, improved fuel efficiency, and enhanced driving performance, making them ideal for luxury, sports, and high-performance vehicles. Rising consumer demand for smoother, responsive driving experiences, along with stricter emission norms, encourages manufacturers to adopt DCT technology. Continuous R&D and integration in both conventional and hybrid drivetrains further drive adoption. This positions DCT as a key growth driver within the global automotive automatic gearbox market over the forecast period.
- Electric & Hybrid Vehicles segment is expected to witness highest growth over the forecast period
The Electric & Hybrid Vehicles (EV/HEV) segment is projected to witness the highest growth due to the global shift toward sustainable mobility and stringent fuel-efficiency regulations. Automatic gearboxes tailored for electric and hybrid drivetrains enhance energy efficiency, optimize torque delivery, and improve vehicle performance. Government incentives, rising EV adoption, and advancements in dual-clutch and CVT systems for electric applications fuel market expansion. Automakers increasingly integrate automatic transmissions in EVs and hybrids to meet consumer demand for smooth, efficient driving. This trend positions EV/HEV applications as a major contributor to the global automotive automatic gearbox market growth.
- Aftermarket / Replacement segment is expected to witness highest growth over the forecast period
The Aftermarket / Replacement segment is expected to grow significantly as vehicle owners increasingly replace or upgrade aging automatic gearboxes. Rising vehicle longevity, coupled with higher maintenance costs for older models, drives demand for aftermarket automatic transmissions. Technological upgrades, such as replacing conventional gearboxes with DCT or CVT systems, further boost the segment. The trend is particularly strong in developing regions, where budget-conscious consumers prefer cost-effective aftermarket solutions. Additionally, growing awareness of performance, fuel efficiency, and safety benefits encourages replacement of worn-out components. This segment thus represents a crucial growth opportunity in the global automotive automatic gearbox market.
- Asia-Pacific Region is expected to witness highest growth over the forecast period
The Asia-Pacific region is projected to lead the global automotive automatic gearbox market due to rapid vehicle production, urbanization, and rising disposable incomes. Countries such as China, India, Japan, and South Korea are witnessing increasing demand for passenger cars, electric vehicles, and high-performance vehicles with advanced automatic transmissions. Government policies promoting EV adoption and stricter emission regulations drive DCT, CVT, and torque converter integration. Expanding OEM manufacturing facilities, technological advancements, and growing consumer preference for comfort and fuel efficiency further support market growth. Consequently, Asia-Pacific is expected to witness the highest growth during the forecast period.
| Report Matrics |
Details |
| Market Size Value |
USD 239.17 billion |
| Growth Rate |
CAGR of 10.2% |
| Forecast |
2026-2033 |
| Historical data |
2021-2024 |
| Base Year |
2025 |
| Report Coverage |
Forecasted revenue, company rating, competitive environment, growth drivers, and trends |
| Segment Coverage |
Type, Application, End-User, Geography |
| Regional Scope |
North America, Europe, Asia Pacific, Middle East |
| Customized scope |
Free customization of reports (With 3 months' analysis support) |
| To Learn More About This Report |
Request a Free Sample Copy |
Automotive Automatic Gearbox Market Competitive Landscape
The competitive landscape of the global automotive automatic gearbox market is highly fragmented and technology-driven. Key players, including ZF Friedrichshafen, Aisin Seiki, BorgWarner, Jatco, Hyundai Powertech, and Getrag, compete through innovation, strategic partnerships, and product diversification. Manufacturers focus on fuel-efficient, lightweight, and durable transmission systems to meet regulatory standards and consumer demand. Collaboration with EV and autonomous vehicle companies is growing, alongside investments in R&D for electronic and dual-clutch systems. The market also sees mergers, acquisitions, and joint ventures to expand geographic reach and technological capabilities.
The major players for above market are:
- ZF Friedrichshafen AG
- Aisin Seiki Co., Ltd.
- BorgWarner Inc.
- Jatco Ltd.
- Getrag (Magna International Inc.)
- Hyundai Powertech Co., Ltd.
- Allison Transmission Holdings, Inc.
- Ricardo PLC
- Schaeffler AG
- Denso Corporation
- Tremec (Magna Powertrain)
- Eaton Corporation
- Continental AG
- GKN Automotive
- LuK GmbH & Co. KG
- Mitsubishi Heavy Industries, Ltd.
- Hitachi Automotive Systems, Ltd.
- Faurecia (FPT Industrial)
- Yazaki Corporation
- Borg Automotive
Recent Development
- In January 2025, BMW Group India’s showcase at Auto Expo 2025, featuring all-electric models like the BMW i7, MINI Countryman EV, and BMW CE series motorcycles, highlights growing adoption of electric and hybrid vehicles. This expansion accelerates demand for automatic and advanced transmission systems, driving growth in the global automotive automatic gearbox market.
- In October 2024, Schaeffler AG’s acquisition of Vitesco Technologies strengthened its position in the automotive transmission market, combining advanced powertrain expertise. The merger enhanced capabilities in developing high-performance automatic and hybrid transmissions, fostering innovation and collaboration. This consolidation is expected to accelerate technological advancements, improve efficiency, and support market growth in the global automotive automatic gearbox sector.
Frequently Asked Questions (FAQ) :
Q1. What are the main growth-driving factors for this market?
The primary driver is the increasing consumer preference for driving comfort and convenience, especially in congested urban traffic. Technological improvements have made modern automatic gearboxes more fuel-efficient than older versions, rivaling manual transmissions. Additionally, the rise of semi-autonomous driving features requires automatic systems to function correctly, pushing manufacturers to phase out manuals.
Q2. What are the main restraining factors for this market?
Growth is hindered by the higher initial cost of automatic vehicles compared to manual ones, which remains a factor in budget-sensitive markets. Automatic gearboxes are also more complex and expensive to repair or replace if they fail. Furthermore, the rapid global shift toward electric vehicles (EVs), which typically do not use traditional multi-speed gearboxes, poses a long-term threat.
Q3. Which segment is expected to witness high growth?
The Dual-Clutch Transmission (DCT) segment is expected to witness high growth. DCTs offer lightning-fast gear changes and superior fuel economy by using two separate clutches for odd and even gears. This technology is becoming highly popular in both performance cars and standard passenger vehicles because it combines the efficiency of a manual with the smoothness of an automatic.
Q4. Who are the top major players for this market?
The market is dominated by specialized transmission manufacturers and major automotive groups. Key players include ZF Friedrichshafen, Aisin Seiki, Jatco, Getrag (Magna), and BorgWarner. These companies lead by supplying advanced gearboxes to global car brands, constantly innovating with "9-speed" and "10-speed" systems that optimize engine performance and reduce carbon emissions.
Q5. Which country is the largest player?
China is currently the largest player in the automotive automatic gearbox market. As the world's biggest automobile producer and consumer, China has seen a massive shift away from manual cars toward automatics in just a decade. The presence of massive domestic manufacturing hubs and a growing middle class that prioritizes premium driving features keeps China at the top.
List of Figures
Figure 1: Global Automotive Automatic Gearbox Market Revenue Breakdown (USD Billion, %) by Region, 2022 & 2029
Figure 2: Global Automotive Automatic Gearbox Market Value Share (%), By Segment 1, 2022 & 2029
Figure 3: Global Automotive Automatic Gearbox Market Forecast (USD Billion), by Sub-Segment 1, 2018-2029
Figure 4: Global Automotive Automatic Gearbox Market Forecast (USD Billion), by Sub-Segment 2, 2018-2029
Figure 5: Global Automotive Automatic Gearbox Market Value Share (%), By Segment 2, 2022 & 2029
Figure 6: Global Automotive Automatic Gearbox Market Forecast (USD Billion), by Sub-Segment 1, 2018-2029
Figure 7: Global Automotive Automatic Gearbox Market Forecast (USD Billion), by Sub-Segment 2, 2018-2029
Figure 8: Global Automotive Automatic Gearbox Market Forecast (USD Billion), by Sub-Segment 3, 2018-2029
Figure 9: Global Automotive Automatic Gearbox Market Forecast (USD Billion), by Others, 2018-2029
Figure 10: Global Automotive Automatic Gearbox Market Value Share (%), By Segment 3, 2022 & 2029
Figure 11: Global Automotive Automatic Gearbox Market Forecast (USD Billion), by Sub-Segment 1, 2018-2029
Figure 12: Global Automotive Automatic Gearbox Market Forecast (USD Billion), by Sub-Segment 2, 2018-2029
Figure 13: Global Automotive Automatic Gearbox Market Forecast (USD Billion), by Sub-Segment 3, 2018-2029
Figure 14: Global Automotive Automatic Gearbox Market Forecast (USD Billion), by Others, 2018-2029
Figure 15: Global Automotive Automatic Gearbox Market Value (USD Billion), by Region, 2022 & 2029
Figure 16: North America Automotive Automatic Gearbox Market Value Share (%), By Segment 1, 2022 & 2029
Figure 17: North America Automotive Automatic Gearbox Market Forecast (USD Billion), by Sub-Segment 1, 2018-2029
Figure 18: North America Automotive Automatic Gearbox Market Forecast (USD Billion), by Sub-Segment 2, 2018-2029
Figure 19: North America Automotive Automatic Gearbox Market Value Share (%), By Segment 2, 2022 & 2029
Figure 20: North America Automotive Automatic Gearbox Market Forecast (USD Billion), by Sub-Segment 1, 2018-2029
Figure 21: North America Automotive Automatic Gearbox Market Forecast (USD Billion), by Sub-Segment 2, 2018-2029
Figure 22: North America Automotive Automatic Gearbox Market Forecast (USD Billion), by Sub-Segment 3, 2018-2029
Figure 23: North America Automotive Automatic Gearbox Market Forecast (USD Billion), by Others, 2018-2029
Figure 24: North America Automotive Automatic Gearbox Market Value Share (%), By Segment 3, 2022 & 2029
Figure 25: North America Automotive Automatic Gearbox Market Forecast (USD Billion), by Sub-Segment 1, 2018-2029
Figure 26: North America Automotive Automatic Gearbox Market Forecast (USD Billion), by Sub-Segment 2, 2018-2029
Figure 27: North America Automotive Automatic Gearbox Market Forecast (USD Billion), by Sub-Segment 3, 2018-2029
Figure 28: North America Automotive Automatic Gearbox Market Forecast (USD Billion), by Others, 2018-2029
Figure 29: North America Automotive Automatic Gearbox Market Forecast (USD Billion), by U.S., 2018-2029
Figure 30: North America Automotive Automatic Gearbox Market Forecast (USD Billion), by Canada, 2018-2029
Figure 31: Latin America Automotive Automatic Gearbox Market Value Share (%), By Segment 1, 2022 & 2029
Figure 32: Latin America Automotive Automatic Gearbox Market Forecast (USD Billion), by Sub-Segment 1, 2018-2029
Figure 33: Latin America Automotive Automatic Gearbox Market Forecast (USD Billion), by Sub-Segment 2, 2018-2029
Figure 34: Latin America Automotive Automatic Gearbox Market Value Share (%), By Segment 2, 2022 & 2029
Figure 35: Latin America Automotive Automatic Gearbox Market Forecast (USD Billion), by Sub-Segment 1, 2018-2029
Figure 36: Latin America Automotive Automatic Gearbox Market Forecast (USD Billion), by Sub-Segment 2, 2018-2029
Figure 37: Latin America Automotive Automatic Gearbox Market Forecast (USD Billion), by Sub-Segment 3, 2018-2029
Figure 38: Latin America Automotive Automatic Gearbox Market Forecast (USD Billion), by Others, 2018-2029
Figure 39: Latin America Automotive Automatic Gearbox Market Value Share (%), By Segment 3, 2022 & 2029
Figure 40: Latin America Automotive Automatic Gearbox Market Forecast (USD Billion), by Sub-Segment 1, 2018-2029
Figure 41: Latin America Automotive Automatic Gearbox Market Forecast (USD Billion), by Sub-Segment 2, 2018-2029
Figure 42: Latin America Automotive Automatic Gearbox Market Forecast (USD Billion), by Sub-Segment 3, 2018-2029
Figure 43: Latin America Automotive Automatic Gearbox Market Forecast (USD Billion), by Others, 2018-2029
Figure 44: Latin America Automotive Automatic Gearbox Market Forecast (USD Billion), by Brazil, 2018-2029
Figure 45: Latin America Automotive Automatic Gearbox Market Forecast (USD Billion), by Mexico, 2018-2029
Figure 46: Latin America Automotive Automatic Gearbox Market Forecast (USD Billion), by Rest of Latin America, 2018-2029
Figure 47: Europe Automotive Automatic Gearbox Market Value Share (%), By Segment 1, 2022 & 2029
Figure 48: Europe Automotive Automatic Gearbox Market Forecast (USD Billion), by Sub-Segment 1, 2018-2029
Figure 49: Europe Automotive Automatic Gearbox Market Forecast (USD Billion), by Sub-Segment 2, 2018-2029
Figure 50: Europe Automotive Automatic Gearbox Market Value Share (%), By Segment 2, 2022 & 2029
Figure 51: Europe Automotive Automatic Gearbox Market Forecast (USD Billion), by Sub-Segment 1, 2018-2029
Figure 52: Europe Automotive Automatic Gearbox Market Forecast (USD Billion), by Sub-Segment 2, 2018-2029
Figure 53: Europe Automotive Automatic Gearbox Market Forecast (USD Billion), by Sub-Segment 3, 2018-2029
Figure 54: Europe Automotive Automatic Gearbox Market Forecast (USD Billion), by Others, 2018-2029
Figure 55: Europe Automotive Automatic Gearbox Market Value Share (%), By Segment 3, 2022 & 2029
Figure 56: Europe Automotive Automatic Gearbox Market Forecast (USD Billion), by Sub-Segment 1, 2018-2029
Figure 57: Europe Automotive Automatic Gearbox Market Forecast (USD Billion), by Sub-Segment 2, 2018-2029
Figure 58: Europe Automotive Automatic Gearbox Market Forecast (USD Billion), by Sub-Segment 3, 2018-2029
Figure 59: Europe Automotive Automatic Gearbox Market Forecast (USD Billion), by Others, 2018-2029
Figure 60: Europe Automotive Automatic Gearbox Market Forecast (USD Billion), by U.K., 2018-2029
Figure 61: Europe Automotive Automatic Gearbox Market Forecast (USD Billion), by Germany, 2018-2029
Figure 62: Europe Automotive Automatic Gearbox Market Forecast (USD Billion), by France, 2018-2029
Figure 63: Europe Automotive Automatic Gearbox Market Forecast (USD Billion), by Italy, 2018-2029
Figure 64: Europe Automotive Automatic Gearbox Market Forecast (USD Billion), by Spain, 2018-2029
Figure 65: Europe Automotive Automatic Gearbox Market Forecast (USD Billion), by Russia, 2018-2029
Figure 66: Europe Automotive Automatic Gearbox Market Forecast (USD Billion), by Rest of Europe, 2018-2029
Figure 67: Asia Pacific Automotive Automatic Gearbox Market Value Share (%), By Segment 1, 2022 & 2029
Figure 68: Asia Pacific Automotive Automatic Gearbox Market Forecast (USD Billion), by Sub-Segment 1, 2018-2029
Figure 69: Asia Pacific Automotive Automatic Gearbox Market Forecast (USD Billion), by Sub-Segment 2, 2018-2029
Figure 70: Asia Pacific Automotive Automatic Gearbox Market Value Share (%), By Segment 2, 2022 & 2029
Figure 71: Asia Pacific Automotive Automatic Gearbox Market Forecast (USD Billion), by Sub-Segment 1, 2018-2029
Figure 72: Asia Pacific Automotive Automatic Gearbox Market Forecast (USD Billion), by Sub-Segment 2, 2018-2029
Figure 73: Asia Pacific Automotive Automatic Gearbox Market Forecast (USD Billion), by Sub-Segment 3, 2018-2029
Figure 74: Asia Pacific Automotive Automatic Gearbox Market Forecast (USD Billion), by Others, 2018-2029
Figure 75: Asia Pacific Automotive Automatic Gearbox Market Value Share (%), By Segment 3, 2022 & 2029
Figure 76: Asia Pacific Automotive Automatic Gearbox Market Forecast (USD Billion), by Sub-Segment 1, 2018-2029
Figure 77: Asia Pacific Automotive Automatic Gearbox Market Forecast (USD Billion), by Sub-Segment 2, 2018-2029
Figure 78: Asia Pacific Automotive Automatic Gearbox Market Forecast (USD Billion), by Sub-Segment 3, 2018-2029
Figure 79: Asia Pacific Automotive Automatic Gearbox Market Forecast (USD Billion), by Others, 2018-2029
Figure 80: Asia Pacific Automotive Automatic Gearbox Market Forecast (USD Billion), by China, 2018-2029
Figure 81: Asia Pacific Automotive Automatic Gearbox Market Forecast (USD Billion), by India, 2018-2029
Figure 82: Asia Pacific Automotive Automatic Gearbox Market Forecast (USD Billion), by Japan, 2018-2029
Figure 83: Asia Pacific Automotive Automatic Gearbox Market Forecast (USD Billion), by Australia, 2018-2029
Figure 84: Asia Pacific Automotive Automatic Gearbox Market Forecast (USD Billion), by Southeast Asia, 2018-2029
Figure 85: Asia Pacific Automotive Automatic Gearbox Market Forecast (USD Billion), by Rest of Asia Pacific, 2018-2029
Figure 86: Middle East & Africa Automotive Automatic Gearbox Market Value Share (%), By Segment 1, 2022 & 2029
Figure 87: Middle East & Africa Automotive Automatic Gearbox Market Forecast (USD Billion), by Sub-Segment 1, 2018-2029
Figure 88: Middle East & Africa Automotive Automatic Gearbox Market Forecast (USD Billion), by Sub-Segment 2, 2018-2029
Figure 89: Middle East & Africa Automotive Automatic Gearbox Market Value Share (%), By Segment 2, 2022 & 2029
Figure 90: Middle East & Africa Automotive Automatic Gearbox Market Forecast (USD Billion), by Sub-Segment 1, 2018-2029
Figure 91: Middle East & Africa Automotive Automatic Gearbox Market Forecast (USD Billion), by Sub-Segment 2, 2018-2029
Figure 92: Middle East & Africa Automotive Automatic Gearbox Market Forecast (USD Billion), by Sub-Segment 3, 2018-2029
Figure 93: Middle East & Africa Automotive Automatic Gearbox Market Forecast (USD Billion), by Others, 2018-2029
Figure 94: Middle East & Africa Automotive Automatic Gearbox Market Value Share (%), By Segment 3, 2022 & 2029
Figure 95: Middle East & Africa Automotive Automatic Gearbox Market Forecast (USD Billion), by Sub-Segment 1, 2018-2029
Figure 96: Middle East & Africa Automotive Automatic Gearbox Market Forecast (USD Billion), by Sub-Segment 2, 2018-2029
Figure 97: Middle East & Africa Automotive Automatic Gearbox Market Forecast (USD Billion), by Sub-Segment 3, 2018-2029
Figure 98: Middle East & Africa Automotive Automatic Gearbox Market Forecast (USD Billion), by Others, 2018-2029
Figure 99: Middle East & Africa Automotive Automatic Gearbox Market Forecast (USD Billion), by GCC, 2018-2029
Figure 100: Middle East & Africa Automotive Automatic Gearbox Market Forecast (USD Billion), by South Africa, 2018-2029
Figure 101: Middle East & Africa Automotive Automatic Gearbox Market Forecast (USD Billion), by Rest of Middle East & Africa, 2018-2029
List of Tables
Table 1: Global Automotive Automatic Gearbox Market Revenue (USD Billion) Forecast, by Segment 1, 2018-2029
Table 2: Global Automotive Automatic Gearbox Market Revenue (USD Billion) Forecast, by Segment 2, 2018-2029
Table 3: Global Automotive Automatic Gearbox Market Revenue (USD Billion) Forecast, by Segment 3, 2018-2029
Table 4: Global Automotive Automatic Gearbox Market Revenue (USD Billion) Forecast, by Region, 2018-2029
Table 5: North America Automotive Automatic Gearbox Market Revenue (USD Billion) Forecast, by Segment 1, 2018-2029
Table 6: North America Automotive Automatic Gearbox Market Revenue (USD Billion) Forecast, by Segment 2, 2018-2029
Table 7: North America Automotive Automatic Gearbox Market Revenue (USD Billion) Forecast, by Segment 3, 2018-2029
Table 8: North America Automotive Automatic Gearbox Market Revenue (USD Billion) Forecast, by Country, 2018-2029
Table 9: Europe Automotive Automatic Gearbox Market Revenue (USD Billion) Forecast, by Segment 1, 2018-2029
Table 10: Europe Automotive Automatic Gearbox Market Revenue (USD Billion) Forecast, by Segment 2, 2018-2029
Table 11: Europe Automotive Automatic Gearbox Market Revenue (USD Billion) Forecast, by Segment 3, 2018-2029
Table 12: Europe Automotive Automatic Gearbox Market Revenue (USD Billion) Forecast, by Country, 2018-2029
Table 13: Latin America Automotive Automatic Gearbox Market Revenue (USD Billion) Forecast, by Segment 1, 2018-2029
Table 14: Latin America Automotive Automatic Gearbox Market Revenue (USD Billion) Forecast, by Segment 2, 2018-2029
Table 15: Latin America Automotive Automatic Gearbox Market Revenue (USD Billion) Forecast, by Segment 3, 2018-2029
Table 16: Latin America Automotive Automatic Gearbox Market Revenue (USD Billion) Forecast, by Country, 2018-2029
Table 17: Asia Pacific Automotive Automatic Gearbox Market Revenue (USD Billion) Forecast, by Segment 1, 2018-2029
Table 18: Asia Pacific Automotive Automatic Gearbox Market Revenue (USD Billion) Forecast, by Segment 2, 2018-2029
Table 19: Asia Pacific Automotive Automatic Gearbox Market Revenue (USD Billion) Forecast, by Segment 3, 2018-2029
Table 20: Asia Pacific Automotive Automatic Gearbox Market Revenue (USD Billion) Forecast, by Country, 2018-2029
Table 21: Middle East & Africa Automotive Automatic Gearbox Market Revenue (USD Billion) Forecast, by Segment 1, 2018-2029
Table 22: Middle East & Africa Automotive Automatic Gearbox Market Revenue (USD Billion) Forecast, by Segment 2, 2018-2029
Table 23: Middle East & Africa Automotive Automatic Gearbox Market Revenue (USD Billion) Forecast, by Segment 3, 2018-2029
Table 24: Middle East & Africa Automotive Automatic Gearbox Market Revenue (USD Billion) Forecast, by Country, 2018-2029
Research Process
Data Library Research are conducted by industry experts who offer insight on
industry structure, market segmentations technology assessment and competitive landscape (CL), and penetration, as well as on emerging trends. Their analysis is based on primary interviews (~ 80%) and secondary research (~ 20%) as well as years of professional expertise in their respective industries. Adding to this, by analysing historical trends and current market positions, our analysts predict where the market will be headed for the next five years. Furthermore, the varying trends of segment & categories geographically presented are also studied and the estimated based on the primary & secondary research.
In this particular report from the supply side Data Library Research has conducted primary surveys (interviews) with the key level executives (VP, CEO’s, Marketing Director, Business Development Manager
and SOFT) of the companies that active & prominent as well as the midsized organization
FIGURE 1: DLR RESEARH PROCESS
![research-methodology1]()
Primary Research
Extensive primary research was conducted to gain a deeper insight of the market and industry performance. The analysis is based on both primary and secondary research as well as years of professional expertise in the respective industries.
In addition to analysing current and historical trends, our analysts predict where the market is headed over the next five years.
It varies by segment for these categories geographically presented in the list of market tables. Speaking about this particular report we have conducted primary surveys (interviews) with the key level executives (VP, CEO’s, Marketing Director, Business Development Manager and many more) of the major players active in the market.
Secondary Research
Secondary research was mainly used to collect and identify information useful for the extensive, technical, market-oriented, and Friend’s study of the Global Extra Neutral Alcohol. It was also used to obtain key information about major players, market classification and segmentation according to the industry trends, geographical markets, and developments related to the market and technology perspectives. For this study, analysts have gathered information from various credible sources, such as annual reports, sec filings, journals, white papers, SOFT presentations, and company web sites.
Market Size Estimation
Both, top-down and bottom-up approaches were used to estimate and validate the size of the Global market and to estimate the size of various other dependent submarkets in the overall Extra Neutral Alcohol. The key players in the market were identified through secondary research and their market contributions in the respective geographies were determined through primary and secondary research.
Forecast Model
![research-methodology2]()