Automotive AMOLED Display Market Overview and Analysis:
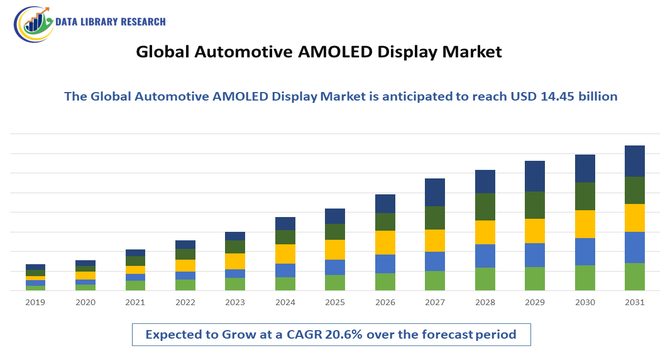
The Global Automotive AMOLED Display Market is currently valued at USD 4.2 billion in 2025 and expected to reach USD 14.45 billion in 2032 and is forecasted to experience a high Compound Annual Growth Rate (CAGR) generally ranging from 20.6% through the period ending 2032–2035.
Get Complete Analysis Of The Report - Download Updated Free Sample PDF
The Global Automotive AMOLED Display Market is primarily driven by the growing demand for advanced in-vehicle infotainment and digital cockpit systems, as consumers increasingly seek enhanced user experience, connectivity, and aesthetics in vehicles. Automotive manufacturers are integrating AMOLED displays in instrument clusters, center consoles, and heads-up displays to provide vibrant colors, high contrast, fast response times, and flexible design options. Rising adoption of electric vehicles (EVs) and luxury cars, which emphasize digital interfaces and futuristic dashboards, further fuels growth.
Automotive AMOLED Display Market Latest Trends:
The Global Automotive AMOLED Display Market is witnessing several key trends that are reshaping in vehicle experiences. There is a strong shift toward larger, seamless digital cockpits that integrate multiple displays—such as instrument clusters, infotainment screens, and passenger displays—into a unified AMOLED panel, enhancing visibility and design aesthetics. Flexible and curved AMOLED displays are gaining traction as automakers adopt innovative dashboard layouts and panoramic screens. Additionally, higher resolution and high refresh rate displays are becoming standard to support advanced graphics, navigation, and safety visuals. The rise of connected and electric vehicles is also driving demand for sophisticated AMOLED interfaces that offer both function and premium appeal.
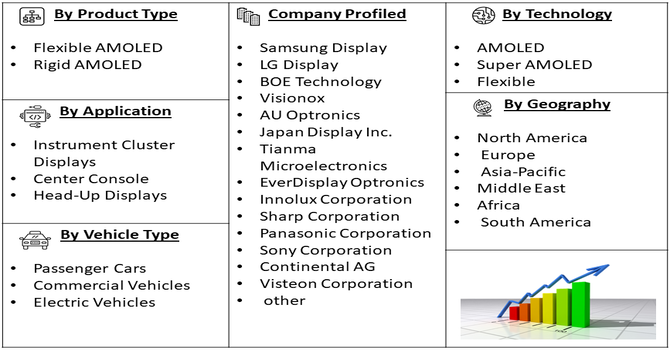
Segmentation: Global Automotive AMOLED Display Market is segmented By Display Type (Flexible AMOLED, Rigid AMOLED), Application (Instrument Cluster Displays, Center Console, Head-Up Displays), Vehicle Type (Passenger Cars, Commercial Vehicles, Electric Vehicles), Screen Size (Below 10 inches, 10–15 inches), By Technology (AMOLED, Super AMOLED, Flexible), and Geography (North America, Europe, Asia-Pacific, Middle East and Africa, and South America). The report provides the value (in USD million) for the above segments.
For Detailed Market Segmentation - Get a Free Sample PDF
Market Drivers:
- Growing Demand for Advanced In-Vehicle Digital Experiences
The increasing integration of digital technologies in vehicles is a major driver for the automotive AMOLED display market. Consumers are seeking enhanced in-vehicle experiences with high-resolution, vibrant, and interactive displays for infotainment, navigation, and vehicle control systems. AMOLED displays offer superior color accuracy, deeper contrast, faster response times, and thinner form factors compared to traditional LCDs, making them ideal for instrument clusters, center consoles, and head-up displays. As automakers focus on creating connected and smart cockpits, the demand for visually appealing, energy-efficient, and customizable AMOLED displays continues to rise across passenger and luxury vehicle segments.
- Rising Adoption of Electric and Luxury Vehicles
The surge in electric vehicles (EVs) and luxury cars is fueling the adoption of automotive AMOLED displays. EVs often feature fully digital dashboards and futuristic cockpits to complement their advanced technologies, requiring high-quality display panels. Luxury and premium vehicles increasingly use AMOLED screens to differentiate through aesthetics, customization, and user interface innovation. Flexible and curved AMOLED panels enable seamless, large-format dashboards that enhance driver and passenger experiences. The combined effect of rising EV production, consumer preference for premium in-car technologies, and automotive digitalization is a significant growth driver for the market globally.
Market Restraints:
- High Manufacturing Costs and Price Constraints
The key restraints for the Global Automotive AMOLED Display Market is the high production cost associated with AMOLED technology. Manufacturing AMOLED panels, particularly flexible or large-format displays, requires sophisticated materials, advanced fabrication processes, and strict quality control measures. These high costs are often reflected in the final vehicle price, limiting adoption in budget and mid-range cars. Automakers must balance offering advanced display technologies with maintaining competitive vehicle pricing. As a result, cost sensitivity can slow market penetration, particularly in emerging regions where consumers and fleet operators prioritize affordability over premium features.
Socioeconomic Impact on Automotive AMOLED Display Market
The global automotive AMOLED display market has a growing socioeconomic impact by transforming in-vehicle experiences and supporting the shift toward connected and electric vehicles. Advanced displays improve driver safety through clearer navigation, real-time information, and enhanced dashboard visibility. Market growth creates jobs across display manufacturing, automotive design, software development, and supply chains. As vehicles become more digital, consumers benefit from better infotainment, customization, and comfort, raising expectations for smart mobility. Increased adoption of AMOLED displays also encourages innovation among automakers and technology firms, boosting investments and regional industrial growth.
Segmental Analysis:
- Flexible AMOLED segment is expected to witness the highest growth over the forecast period
Flexible AMOLED displays are increasingly adopted in automotive dashboards due to their ability to conform to curved and innovative interior designs. These displays offer vibrant colors, high contrast, and thin form factors, enabling automakers to create seamless, panoramic instrument clusters and center consoles. The flexibility supports futuristic vehicle designs, particularly in electric and premium cars, enhancing user experience and aesthetics.
- Instrument Cluster Displays segment is expected to witness the highest growth over the forecast period
Instrument cluster displays are a primary application for automotive AMOLED panels. They provide critical information such as speed, navigation, and vehicle status in a visually appealing format. AMOLED technology improves readability under varying lighting conditions, delivers high-resolution graphics, and allows customization of the interface, making it a preferred choice for modern digital cockpits.
- Electric Vehicles (EVs) segment is expected to witness the highest growth over the forecast period
Electric vehicles are a major driver of AMOLED adoption, as they often feature fully digital dashboards and innovative cockpit designs. Consumers of EVs expect high-quality displays that integrate navigation, energy monitoring, and infotainment seamlessly. AMOLED panels provide the visual clarity, flexibility, and energy efficiency necessary for these advanced interfaces, supporting the growing EV market worldwide.
- 10–15 Inches segment is expected to witness highest growth over the forecast period
Displays in the 10–15 inches range are increasingly used in center consoles and instrument clusters to provide immersive infotainment and driver information. This size range balances visibility and ergonomics, offering ample space for navigation, media, and control functions without overwhelming the dashboard. AMOLED technology enhances image quality, brightness, and contrast in this segment, driving adoption in modern vehicles.
- Super AMOLED segment is expected to witness highest growth over the forecast period
Super AMOLED technology, which integrates touch sensors directly into the display layer, is gaining traction in automotive applications. This approach reduces thickness, enhances brightness, and improves energy efficiency. Super AMOLED displays also offer faster response times and better visibility under sunlight, making them suitable for dashboards, center consoles, and head-up displays in both premium and mid-range vehicles.
- Asia-Pacific segment is expected to witness highest growth over the forecast period
The Asia-Pacific segment is expected to witness the highest growth over the forecast period in the global automotive AMOLED display market due to rapid expansion of the automotive and electronics industries. Rising production of electric and connected vehicles in countries such as China, Japan, South Korea, and India is driving demand for advanced in-vehicle displays. Increasing consumer preference for digital dashboards, infotainment systems, and smart cockpit features further supports market growth. Strong presence of leading display manufacturers and automotive OEMs enhances regional innovation and supply capabilities. Additionally, supportive government policies for electric mobility, improving disposable incomes, and urbanization are accelerating adoption, positioning Asia-Pacific as a key growth driver in the automotive AMOLED display market.
| Report Matrics |
Details |
| Market Size Value |
USD 14.45 billion |
| Growth Rate |
CAGR of 20.6% |
| Forecast |
2026-2033 |
| Historical data |
2021-2024 |
| Base Year |
2025 |
| Report Coverage |
Forecasted revenue, company rating, competitive environment, growth drivers, and trends |
| Segment Coverage |
Type, Application, End-User Geography |
| Regional Scope |
North America, Europe, Asia Pacific, Middle East |
| Customized scope |
Free customization of reports (With 3 months Analysis Support ) |
| To Learn More About This Report |
Request a Free Sample Copy |
Automotive AMOLED Display Market Competitive Landscape
The Competitive Landscape of the Global Automotive AMOLED Display Market is marked by robust competition among leading display manufacturers, automotive electronics suppliers, and technology innovators. Companies are increasingly focusing on research and development, strategic partnerships with automakers, capacity expansion, and adoption of advanced AMOLED technologies such as flexible and curved panels to gain an edge in the rapidly growing automotive display segment. This competitive environment is driven by rising demand for high resolution digital cockpits, infotainment systems, and futuristic dashboard solutions across passenger, electric, and luxury vehicles.
Key Players:
- Samsung Display
- LG Display
- BOE Technology
- Visionox
- AU Optronics
- Japan Display Inc.
- Tianma Microelectronics
- EverDisplay Optronics
- Innolux Corporation
- Sharp Corporation
- Panasonic Corporation
- Sony Corporation
- Continental AG
- Visteon Corporation
- Denso Corporation
- Magna International
- Yazaki Corporation
- Nippon Seiki
- Futaba Corporation
- Himax Technologies
Recent Development
- In September 2025, Samsung Display’s expansion in the automotive sector, highlighted at IAA MOBILITY 2025, reinforces the global automotive AMOLED market by showcasing innovative OLED solutions for safer driving and premium in-car entertainment. By broadening its vehicle OLED portfolio and engaging new customers, Samsung drives industry adoption, accelerates technological innovation, and strengthens OLED’s role as a key component in future mobility solutions.
- In May 2024, Tianma’s showcase of advanced OLED, Micro-LED, and LTPS Mini-LED automotive displays at Display Week 2024 highlighted its innovation in flexible, slidable, and high-performance screen technologies. These introductions strengthened the global automotive AMOLED market by demonstrating enhanced in-vehicle visual experiences, promoting adoption of advanced display solutions, and reinforcing Tianma’s role in driving technological advancements in automotive display systems.
Frequently Asked Questions (FAQ) :
Q1. What are the main growth-driving factors for this market?
The primary driver is the shift toward "software-defined vehicles" and digital cockpits. Automakers are replacing traditional analog gauges with large, curved, and high-contrast screens to improve driver visibility and aesthetics. AMOLED’s ability to be molded into ergonomic shapes and its superior readability in direct sunlight make it ideal for modern luxury and electric vehicle interiors.
Q2. What are the main restraining factors for this market?
The main restraint is the rigorous "automotive-grade" durability standards. Displays must survive extreme temperature swings and constant vibrations for over a decade, which is challenging for organic materials prone to degradation. Additionally, the high cost of AMOLED compared to standard automotive LCDs limits its use primarily to premium vehicle segments and high-end trims.
Q3. Which segment is expected to witness high growth?
The Center Stack and Infotainment segment is expected to see the highest growth. As cars become entertainment hubs, manufacturers are installing massive, high-definition AMOLED touchscreens to manage everything from climate control to video streaming. The thin profile of these panels allows designers to create floating or integrated dashboard layouts that were previously impossible with bulkier tech.
Q4. Who are the top major players for this market?
The market is led by specialized display manufacturers with strong automotive partnerships. Key players include LG Display, Samsung Display, BOE Technology, and Continental AG. LG and Samsung are currently the leaders in supplying flexible and high-brightness panels for major luxury brands like Cadillac, Mercedes-Benz, and Audi, setting the standard for premium in-car visuals.
Q5. Which country is the largest player?
South Korea is the largest player in the automotive AMOLED market. Leveraging their dominance in the smartphone display sector, South Korean firms like LG Display were the first to mass-produce automotive-grade OLEDs. Their long-term contracts with global luxury automakers and advanced research into flexible, transparent, and durable panels keep them ahead of competitors in China and Japan.
List of Figures
Figure 1: Global Automotive AMOLED Display Market Revenue Breakdown (USD Billion, %) by Region, 2022 & 2029
Figure 2: Global Automotive AMOLED Display Market Value Share (%), By Segment 1, 2022 & 2029
Figure 3: Global Automotive AMOLED Display Market Forecast (USD Billion), by Sub-Segment 1, 2018-2029
Figure 4: Global Automotive AMOLED Display Market Forecast (USD Billion), by Sub-Segment 2, 2018-2029
Figure 5: Global Automotive AMOLED Display Market Value Share (%), By Segment 2, 2022 & 2029
Figure 6: Global Automotive AMOLED Display Market Forecast (USD Billion), by Sub-Segment 1, 2018-2029
Figure 7: Global Automotive AMOLED Display Market Forecast (USD Billion), by Sub-Segment 2, 2018-2029
Figure 8: Global Automotive AMOLED Display Market Forecast (USD Billion), by Sub-Segment 3, 2018-2029
Figure 9: Global Automotive AMOLED Display Market Forecast (USD Billion), by Others, 2018-2029
Figure 10: Global Automotive AMOLED Display Market Value Share (%), By Segment 3, 2022 & 2029
Figure 11: Global Automotive AMOLED Display Market Forecast (USD Billion), by Sub-Segment 1, 2018-2029
Figure 12: Global Automotive AMOLED Display Market Forecast (USD Billion), by Sub-Segment 2, 2018-2029
Figure 13: Global Automotive AMOLED Display Market Forecast (USD Billion), by Sub-Segment 3, 2018-2029
Figure 14: Global Automotive AMOLED Display Market Forecast (USD Billion), by Others, 2018-2029
Figure 15: Global Automotive AMOLED Display Market Value (USD Billion), by Region, 2022 & 2029
Figure 16: North America Automotive AMOLED Display Market Value Share (%), By Segment 1, 2022 & 2029
Figure 17: North America Automotive AMOLED Display Market Forecast (USD Billion), by Sub-Segment 1, 2018-2029
Figure 18: North America Automotive AMOLED Display Market Forecast (USD Billion), by Sub-Segment 2, 2018-2029
Figure 19: North America Automotive AMOLED Display Market Value Share (%), By Segment 2, 2022 & 2029
Figure 20: North America Automotive AMOLED Display Market Forecast (USD Billion), by Sub-Segment 1, 2018-2029
Figure 21: North America Automotive AMOLED Display Market Forecast (USD Billion), by Sub-Segment 2, 2018-2029
Figure 22: North America Automotive AMOLED Display Market Forecast (USD Billion), by Sub-Segment 3, 2018-2029
Figure 23: North America Automotive AMOLED Display Market Forecast (USD Billion), by Others, 2018-2029
Figure 24: North America Automotive AMOLED Display Market Value Share (%), By Segment 3, 2022 & 2029
Figure 25: North America Automotive AMOLED Display Market Forecast (USD Billion), by Sub-Segment 1, 2018-2029
Figure 26: North America Automotive AMOLED Display Market Forecast (USD Billion), by Sub-Segment 2, 2018-2029
Figure 27: North America Automotive AMOLED Display Market Forecast (USD Billion), by Sub-Segment 3, 2018-2029
Figure 28: North America Automotive AMOLED Display Market Forecast (USD Billion), by Others, 2018-2029
Figure 29: North America Automotive AMOLED Display Market Forecast (USD Billion), by U.S., 2018-2029
Figure 30: North America Automotive AMOLED Display Market Forecast (USD Billion), by Canada, 2018-2029
Figure 31: Latin America Automotive AMOLED Display Market Value Share (%), By Segment 1, 2022 & 2029
Figure 32: Latin America Automotive AMOLED Display Market Forecast (USD Billion), by Sub-Segment 1, 2018-2029
Figure 33: Latin America Automotive AMOLED Display Market Forecast (USD Billion), by Sub-Segment 2, 2018-2029
Figure 34: Latin America Automotive AMOLED Display Market Value Share (%), By Segment 2, 2022 & 2029
Figure 35: Latin America Automotive AMOLED Display Market Forecast (USD Billion), by Sub-Segment 1, 2018-2029
Figure 36: Latin America Automotive AMOLED Display Market Forecast (USD Billion), by Sub-Segment 2, 2018-2029
Figure 37: Latin America Automotive AMOLED Display Market Forecast (USD Billion), by Sub-Segment 3, 2018-2029
Figure 38: Latin America Automotive AMOLED Display Market Forecast (USD Billion), by Others, 2018-2029
Figure 39: Latin America Automotive AMOLED Display Market Value Share (%), By Segment 3, 2022 & 2029
Figure 40: Latin America Automotive AMOLED Display Market Forecast (USD Billion), by Sub-Segment 1, 2018-2029
Figure 41: Latin America Automotive AMOLED Display Market Forecast (USD Billion), by Sub-Segment 2, 2018-2029
Figure 42: Latin America Automotive AMOLED Display Market Forecast (USD Billion), by Sub-Segment 3, 2018-2029
Figure 43: Latin America Automotive AMOLED Display Market Forecast (USD Billion), by Others, 2018-2029
Figure 44: Latin America Automotive AMOLED Display Market Forecast (USD Billion), by Brazil, 2018-2029
Figure 45: Latin America Automotive AMOLED Display Market Forecast (USD Billion), by Mexico, 2018-2029
Figure 46: Latin America Automotive AMOLED Display Market Forecast (USD Billion), by Rest of Latin America, 2018-2029
Figure 47: Europe Automotive AMOLED Display Market Value Share (%), By Segment 1, 2022 & 2029
Figure 48: Europe Automotive AMOLED Display Market Forecast (USD Billion), by Sub-Segment 1, 2018-2029
Figure 49: Europe Automotive AMOLED Display Market Forecast (USD Billion), by Sub-Segment 2, 2018-2029
Figure 50: Europe Automotive AMOLED Display Market Value Share (%), By Segment 2, 2022 & 2029
Figure 51: Europe Automotive AMOLED Display Market Forecast (USD Billion), by Sub-Segment 1, 2018-2029
Figure 52: Europe Automotive AMOLED Display Market Forecast (USD Billion), by Sub-Segment 2, 2018-2029
Figure 53: Europe Automotive AMOLED Display Market Forecast (USD Billion), by Sub-Segment 3, 2018-2029
Figure 54: Europe Automotive AMOLED Display Market Forecast (USD Billion), by Others, 2018-2029
Figure 55: Europe Automotive AMOLED Display Market Value Share (%), By Segment 3, 2022 & 2029
Figure 56: Europe Automotive AMOLED Display Market Forecast (USD Billion), by Sub-Segment 1, 2018-2029
Figure 57: Europe Automotive AMOLED Display Market Forecast (USD Billion), by Sub-Segment 2, 2018-2029
Figure 58: Europe Automotive AMOLED Display Market Forecast (USD Billion), by Sub-Segment 3, 2018-2029
Figure 59: Europe Automotive AMOLED Display Market Forecast (USD Billion), by Others, 2018-2029
Figure 60: Europe Automotive AMOLED Display Market Forecast (USD Billion), by U.K., 2018-2029
Figure 61: Europe Automotive AMOLED Display Market Forecast (USD Billion), by Germany, 2018-2029
Figure 62: Europe Automotive AMOLED Display Market Forecast (USD Billion), by France, 2018-2029
Figure 63: Europe Automotive AMOLED Display Market Forecast (USD Billion), by Italy, 2018-2029
Figure 64: Europe Automotive AMOLED Display Market Forecast (USD Billion), by Spain, 2018-2029
Figure 65: Europe Automotive AMOLED Display Market Forecast (USD Billion), by Russia, 2018-2029
Figure 66: Europe Automotive AMOLED Display Market Forecast (USD Billion), by Rest of Europe, 2018-2029
Figure 67: Asia Pacific Automotive AMOLED Display Market Value Share (%), By Segment 1, 2022 & 2029
Figure 68: Asia Pacific Automotive AMOLED Display Market Forecast (USD Billion), by Sub-Segment 1, 2018-2029
Figure 69: Asia Pacific Automotive AMOLED Display Market Forecast (USD Billion), by Sub-Segment 2, 2018-2029
Figure 70: Asia Pacific Automotive AMOLED Display Market Value Share (%), By Segment 2, 2022 & 2029
Figure 71: Asia Pacific Automotive AMOLED Display Market Forecast (USD Billion), by Sub-Segment 1, 2018-2029
Figure 72: Asia Pacific Automotive AMOLED Display Market Forecast (USD Billion), by Sub-Segment 2, 2018-2029
Figure 73: Asia Pacific Automotive AMOLED Display Market Forecast (USD Billion), by Sub-Segment 3, 2018-2029
Figure 74: Asia Pacific Automotive AMOLED Display Market Forecast (USD Billion), by Others, 2018-2029
Figure 75: Asia Pacific Automotive AMOLED Display Market Value Share (%), By Segment 3, 2022 & 2029
Figure 76: Asia Pacific Automotive AMOLED Display Market Forecast (USD Billion), by Sub-Segment 1, 2018-2029
Figure 77: Asia Pacific Automotive AMOLED Display Market Forecast (USD Billion), by Sub-Segment 2, 2018-2029
Figure 78: Asia Pacific Automotive AMOLED Display Market Forecast (USD Billion), by Sub-Segment 3, 2018-2029
Figure 79: Asia Pacific Automotive AMOLED Display Market Forecast (USD Billion), by Others, 2018-2029
Figure 80: Asia Pacific Automotive AMOLED Display Market Forecast (USD Billion), by China, 2018-2029
Figure 81: Asia Pacific Automotive AMOLED Display Market Forecast (USD Billion), by India, 2018-2029
Figure 82: Asia Pacific Automotive AMOLED Display Market Forecast (USD Billion), by Japan, 2018-2029
Figure 83: Asia Pacific Automotive AMOLED Display Market Forecast (USD Billion), by Australia, 2018-2029
Figure 84: Asia Pacific Automotive AMOLED Display Market Forecast (USD Billion), by Southeast Asia, 2018-2029
Figure 85: Asia Pacific Automotive AMOLED Display Market Forecast (USD Billion), by Rest of Asia Pacific, 2018-2029
Figure 86: Middle East & Africa Automotive AMOLED Display Market Value Share (%), By Segment 1, 2022 & 2029
Figure 87: Middle East & Africa Automotive AMOLED Display Market Forecast (USD Billion), by Sub-Segment 1, 2018-2029
Figure 88: Middle East & Africa Automotive AMOLED Display Market Forecast (USD Billion), by Sub-Segment 2, 2018-2029
Figure 89: Middle East & Africa Automotive AMOLED Display Market Value Share (%), By Segment 2, 2022 & 2029
Figure 90: Middle East & Africa Automotive AMOLED Display Market Forecast (USD Billion), by Sub-Segment 1, 2018-2029
Figure 91: Middle East & Africa Automotive AMOLED Display Market Forecast (USD Billion), by Sub-Segment 2, 2018-2029
Figure 92: Middle East & Africa Automotive AMOLED Display Market Forecast (USD Billion), by Sub-Segment 3, 2018-2029
Figure 93: Middle East & Africa Automotive AMOLED Display Market Forecast (USD Billion), by Others, 2018-2029
Figure 94: Middle East & Africa Automotive AMOLED Display Market Value Share (%), By Segment 3, 2022 & 2029
Figure 95: Middle East & Africa Automotive AMOLED Display Market Forecast (USD Billion), by Sub-Segment 1, 2018-2029
Figure 96: Middle East & Africa Automotive AMOLED Display Market Forecast (USD Billion), by Sub-Segment 2, 2018-2029
Figure 97: Middle East & Africa Automotive AMOLED Display Market Forecast (USD Billion), by Sub-Segment 3, 2018-2029
Figure 98: Middle East & Africa Automotive AMOLED Display Market Forecast (USD Billion), by Others, 2018-2029
Figure 99: Middle East & Africa Automotive AMOLED Display Market Forecast (USD Billion), by GCC, 2018-2029
Figure 100: Middle East & Africa Automotive AMOLED Display Market Forecast (USD Billion), by South Africa, 2018-2029
Figure 101: Middle East & Africa Automotive AMOLED Display Market Forecast (USD Billion), by Rest of Middle East & Africa, 2018-2029
List of Tables
Table 1: Global Automotive AMOLED Display Market Revenue (USD Billion) Forecast, by Segment 1, 2018-2029
Table 2: Global Automotive AMOLED Display Market Revenue (USD Billion) Forecast, by Segment 2, 2018-2029
Table 3: Global Automotive AMOLED Display Market Revenue (USD Billion) Forecast, by Segment 3, 2018-2029
Table 4: Global Automotive AMOLED Display Market Revenue (USD Billion) Forecast, by Region, 2018-2029
Table 5: North America Automotive AMOLED Display Market Revenue (USD Billion) Forecast, by Segment 1, 2018-2029
Table 6: North America Automotive AMOLED Display Market Revenue (USD Billion) Forecast, by Segment 2, 2018-2029
Table 7: North America Automotive AMOLED Display Market Revenue (USD Billion) Forecast, by Segment 3, 2018-2029
Table 8: North America Automotive AMOLED Display Market Revenue (USD Billion) Forecast, by Country, 2018-2029
Table 9: Europe Automotive AMOLED Display Market Revenue (USD Billion) Forecast, by Segment 1, 2018-2029
Table 10: Europe Automotive AMOLED Display Market Revenue (USD Billion) Forecast, by Segment 2, 2018-2029
Table 11: Europe Automotive AMOLED Display Market Revenue (USD Billion) Forecast, by Segment 3, 2018-2029
Table 12: Europe Automotive AMOLED Display Market Revenue (USD Billion) Forecast, by Country, 2018-2029
Table 13: Latin America Automotive AMOLED Display Market Revenue (USD Billion) Forecast, by Segment 1, 2018-2029
Table 14: Latin America Automotive AMOLED Display Market Revenue (USD Billion) Forecast, by Segment 2, 2018-2029
Table 15: Latin America Automotive AMOLED Display Market Revenue (USD Billion) Forecast, by Segment 3, 2018-2029
Table 16: Latin America Automotive AMOLED Display Market Revenue (USD Billion) Forecast, by Country, 2018-2029
Table 17: Asia Pacific Automotive AMOLED Display Market Revenue (USD Billion) Forecast, by Segment 1, 2018-2029
Table 18: Asia Pacific Automotive AMOLED Display Market Revenue (USD Billion) Forecast, by Segment 2, 2018-2029
Table 19: Asia Pacific Automotive AMOLED Display Market Revenue (USD Billion) Forecast, by Segment 3, 2018-2029
Table 20: Asia Pacific Automotive AMOLED Display Market Revenue (USD Billion) Forecast, by Country, 2018-2029
Table 21: Middle East & Africa Automotive AMOLED Display Market Revenue (USD Billion) Forecast, by Segment 1, 2018-2029
Table 22: Middle East & Africa Automotive AMOLED Display Market Revenue (USD Billion) Forecast, by Segment 2, 2018-2029
Table 23: Middle East & Africa Automotive AMOLED Display Market Revenue (USD Billion) Forecast, by Segment 3, 2018-2029
Table 24: Middle East & Africa Automotive AMOLED Display Market Revenue (USD Billion) Forecast, by Country, 2018-2029
Research Process
Data Library Research are conducted by industry experts who offer insight on
industry structure, market segmentations technology assessment and competitive landscape (CL), and penetration, as well as on emerging trends. Their analysis is based on primary interviews (~ 80%) and secondary research (~ 20%) as well as years of professional expertise in their respective industries. Adding to this, by analysing historical trends and current market positions, our analysts predict where the market will be headed for the next five years. Furthermore, the varying trends of segment & categories geographically presented are also studied and the estimated based on the primary & secondary research.
In this particular report from the supply side Data Library Research has conducted primary surveys (interviews) with the key level executives (VP, CEO’s, Marketing Director, Business Development Manager
and SOFT) of the companies that active & prominent as well as the midsized organization
FIGURE 1: DLR RESEARH PROCESS
![research-methodology1]()
Primary Research
Extensive primary research was conducted to gain a deeper insight of the market and industry performance. The analysis is based on both primary and secondary research as well as years of professional expertise in the respective industries.
In addition to analysing current and historical trends, our analysts predict where the market is headed over the next five years.
It varies by segment for these categories geographically presented in the list of market tables. Speaking about this particular report we have conducted primary surveys (interviews) with the key level executives (VP, CEO’s, Marketing Director, Business Development Manager and many more) of the major players active in the market.
Secondary Research
Secondary research was mainly used to collect and identify information useful for the extensive, technical, market-oriented, and Friend’s study of the Global Extra Neutral Alcohol. It was also used to obtain key information about major players, market classification and segmentation according to the industry trends, geographical markets, and developments related to the market and technology perspectives. For this study, analysts have gathered information from various credible sources, such as annual reports, sec filings, journals, white papers, SOFT presentations, and company web sites.
Market Size Estimation
Both, top-down and bottom-up approaches were used to estimate and validate the size of the Global market and to estimate the size of various other dependent submarkets in the overall Extra Neutral Alcohol. The key players in the market were identified through secondary research and their market contributions in the respective geographies were determined through primary and secondary research.
Forecast Model
![research-methodology2]()