Agriculture Seeding Drone Market Overview and Analysis
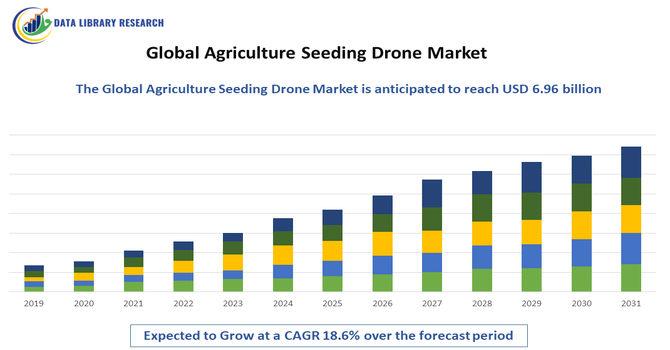
- The Global Agriculture Seeding Drone Market is experiencing robust expansion, projected to reach approximately USD 6.96 billion by 2032, from USD 1.21 billion in 2025 as precision farming adoption increases. This growth is forecasted to achieve a strong Compound Annual Growth Rate (CAGR) of around 18.6% between 2025 and 2032.
Get Complete Analysis Of The Report - Download Updated Free Sample PDF
The Global Agriculture Seeding Drone Market is experiencing robust growth, driven primarily by the increasing need for precision agriculture, labor cost reduction, and enhanced crop productivity. Farmers and agribusinesses are increasingly adopting seeding drones to improve sowing efficiency, reduce seed wastage, and ensure uniform crop distribution, particularly in large-scale and difficult-to-access farmland. The rising integration of GPS, AI, and IoT technologies in agricultural drones enables precise seed placement and real-time monitoring, further boosting operational efficiency.
Agriculture Seeding Drone Market Latest Trends
The Global Agriculture Seeding Drone Market is evolving rapidly with several notable trends. First, there is growing integration of AI, machine learning and sensor-driven precision systems into seeding drones — enabling real time terrain mapping, variable rate seeding, and optimal seed placement based on soil data, which boosts efficiency and crop yields. Second, seeding drones are increasingly part of a broader smart farming and automation ecosystem, combining seeding, spraying, monitoring, and data analytics in a unified, drone enabled workflow to reduce labour dependence and increase productivity. Third, there is rising adoption of drone as a service (DaaS) and leasing models that make advanced drone technology accessible to small and medium size farms without large upfront investment — helping democratize precision agriculture.
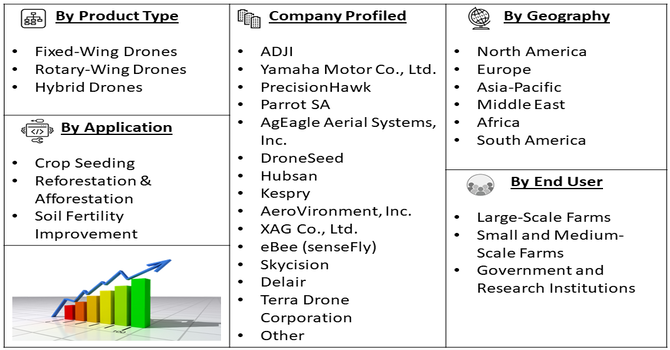
Segmentation: Global Agriculture Seeding Drone Market is segmented By Type (Fixed-Wing Drones, Rotary-Wing Drones, Hybrid Drones), Application (Crop Seeding, Reforestation & Afforestation, Soil Fertility Improvement), By Crop Type (Cereals & Grains, Fruits & Vegetables, Oilseeds & Pulses), End User (Large-Scale Farms, Small and Medium-Scale Farms, Government and Research Institutions), and Geography (North America, Europe, Asia-Pacific, Middle East and Africa, and South America). The report provides the value (in USD million) for the above segments.
For Detailed Market Segmentation - Get a Free Sample PDF
Market Drivers:
- Increasing Adoption of Precision Agriculture
The growing demand for precision agriculture is a major driver for the seeding drone market. Farmers are seeking technologies that enable efficient and accurate seed placement, reduce wastage, and improve crop yield. For instance, in November 2025, Agritechnica 2025, XAG’s launch of the P150 Max drone and R Series rover highlighted rapid advancements in autonomous, high-precision farming tools. Their capabilities in payload handling and targeted crop management accelerated the shift toward precision agriculture, boosting global interest and adoption of advanced seeding drones and strengthening growth in the global agriculture seeding drone market.
Agriculture seeding drones equipped with GPS, AI, and sensor technologies allow precise monitoring of soil conditions, topography, and moisture levels, which helps optimize seeding operations. This level of precision reduces input costs, enhances productivity, and supports sustainable farming practices, making drones an attractive solution for modern agriculture.
- Labour Shortages and Rising Operational Efficiency Needs
Labour shortages in the agricultural sector, especially in large-scale and remote farmlands, are driving the adoption of seeding drones. Traditional seeding methods are labor-intensive and time-consuming, whereas drones can cover vast areas quickly and autonomously. By reducing reliance on manual labor and increasing operational efficiency, seeding drones help farmers manage larger tracts of land effectively. This is particularly important in regions facing an aging farming population or migration of workers to urban areas, making drone-based seeding a cost-effective and timely solution.
Market Restraints:
- High Initial Investment and Maintenance Costs
The major restraints for the agriculture seeding drone market is the high upfront cost of purchasing advanced drones equipped with GPS, AI, and precision sensors. In addition to the initial investment, maintenance, calibration, and occasional software or hardware upgrades add to the operational expenses. Small-scale and resource-constrained farmers, especially in developing regions, may find these costs prohibitive, limiting widespread adoption of drone technology for seeding purposes.
Socioeconomic Impact on Agriculture Seeding Drone Market
The global agriculture seeding drone market is creating notable socioeconomic benefits by helping farmers increase efficiency, reduce labor costs, and improve crop yields. These drones allow precise seed placement, saving time and resources while reducing the physical effort required in traditional farming. As a result, small and large farms alike can boost productivity and profitability. The technology also supports more sustainable farming practices by minimizing seed waste and enabling better land management. Growing adoption of seeding drones encourages job creation in drone operation, maintenance, and manufacturing. Thus, the market contributes to stronger agricultural output, improved rural livelihoods, and more resilient food systems worldwide.
Segmental Analysis:
- Rotary-Wing Drones segment is expected to witness the highest growth over the forecast period
Rotary-wing drones are the most widely used type in agricultural seeding due to their ability to hover, take off and land vertically, and navigate uneven terrains. These drones are particularly effective for precise seed distribution in small or irregularly shaped fields and for areas with obstacles such as trees or irrigation systems. Their versatility and maneuverability make them ideal for both small and large-scale farming operations.
- Crop Seeding segment is expected to witness the highest growth over the forecast period
Crop seeding is the primary application segment, driven by the need to enhance sowing efficiency and improve crop yield. Seeding drones enable uniform seed placement, minimize wastage, and allow planting in hard-to-reach areas, reducing labor costs and time. With rising adoption of precision agriculture, crop seeding via drones is becoming an essential practice for modern farming operations.
- Cereals & Grains segment is expected to witness the highest growth over the forecast period
Cereals and grains represent a key crop type for seeding drones, as they are often grown on large-scale farms where traditional sowing methods can be labor-intensive and time-consuming. Drones can efficiently cover vast tracts of farmland, ensuring uniform seed distribution and optimal germination, which improves overall yield and reduces resource use.
- Large-Scale Farms segment is expected to witness the highest growth over the forecast period
Large-scale farms are the major end users of seeding drones, as they require high-efficiency solutions to manage extensive farmland with minimal labor. The use of drones allows these farms to reduce operational costs, increase productivity, and implement precision agriculture techniques at scale, making them the primary adopters of advanced seeding drone technology.
- North America region is expected to witness the highest growth over the forecast period
The North America region is expected to witness the highest growth over the forecast period in the Agriculture Seeding Drone Market, driven by the widespread adoption of precision agriculture technologies, advanced drone infrastructure, and supportive regulatory frameworks.
The region benefits from large-scale commercial farms, high investment in smart farming solutions, and growing integration of AI, GPS, and IoT technologies in agriculture. For instance, in June 2025, Guardian Ag’s development of large autonomous drones capable of carrying 200-pound payloads offered a safer, more efficient alternative to traditional low-flying agricultural aircraft. With advanced spraying capabilities and durable design, these drones improved farm safety and productivity, significantly boosting adoption and growth in the North American agriculture seeding drone market. Additionally, increasing labor costs and the need for efficient, automated crop management are accelerating the adoption of seeding drones, positioning North America as a key growth hub for this market.
| Report Matrics |
Details |
| Market Size Value |
USD 6.96 billion |
| Growth Rate |
CAGR of 18.6 % |
| Forecast |
2026-2033 |
| Historical data |
2021-2024 |
| Base Year |
2025 |
| Report Coverage |
Forecasted revenue, company rating, competitive environment, growth drivers, and trends |
| Segment Coverage |
Type, Application, End-User, Geography |
| Regional Scope |
North America, Europe, Asia Pacific, Middle East |
| Customized scope |
Free customization of reports (With 3 months' analysis support) |
| To Learn More About This Report |
Request a Free Sample Copy |
Agriculture Seeding Drone Market Competitive Landscape
The Global Agriculture Seeding Drone Market is highly competitive, with key players focusing on technological innovation, precision agriculture solutions, and strategic collaborations to expand their market presence. Companies are developing drones with advanced GPS, AI, and sensor-based systems for accurate seed placement, real-time monitoring, and improved operational efficiency. The market is also witnessing partnerships between drone manufacturers, agricultural service providers, and software developers to offer integrated solutions that address the needs of large-scale farms, research institutions, and government programs. Emphasis on product reliability, battery efficiency, payload capacity, and user-friendly interfaces is driving differentiation among competitors, while ongoing investments in R&D are enabling the introduction of high-performance and cost-effective seeding drones for diverse agricultural applications.
The major players for this market are:
- DJI
- Yamaha Motor Co., Ltd.
- PrecisionHawk
- Parrot SA
- AgEagle Aerial Systems, Inc.
- DroneSeed
- Hubsan
- Kespry
- AeroVironment, Inc.
- XAG Co., Ltd.
- eBee (senseFly)
- Skycision
- Delair
- Terra Drone Corporation
- Flytrex
- Agras (DJI subsidiary)
- Draganfly Innovations Inc.
- Topcon Positioning Systems
- Quantum Systems GmbH
- Hitec Commercial Drones
Recent Development
- In August 2025, Terra Drone’s partnership with Yanmar Diesel Indonesia expanded access to its agricultural drones across the region, enabling more farmers to adopt modern seeding and crop-management technology. This collaboration strengthened distribution networks, encouraged wider use of precision farming tools, and positively supported growth and technological advancement in the global agriculture seeding drone market.
- In July 2025, Kerala Agricultural University’s successful drone-based seed sowing trial in waterlogged paddy fields showcased the technology’s ability to replace labor-intensive methods. Supported by the World Bank, the initiative demonstrated greater efficiency and reduced manual effort, reinforcing global confidence in drone-driven precision agriculture and contributing to growth in the global agriculture seeding drone market.
Frequently Asked Questions (FAQ) :
Q1. What are the main growth-driving factors for this market?
The biggest drivers are the rising global demand for precision agriculture and the need for higher crop yields with fewer resources. Drones offer optimized seeding, targeted spraying, and real-time monitoring, significantly improving efficiency and reducing labor costs in farm operations, especially amid growing labor shortages worldwide.
Q2. What are the main restraining factors for this market?
The main limitations stem from regulatory issues, such as strict rules governing beyond-visual-line-of-sight (BVLOS) operations, which restrict drone usage over large areas. Additionally, the initial high capital cost of advanced drones, coupled with complex data management and limited battery endurance, restrains wider adoption, particularly among small farms.
Q3. Which segment is expected to witness high growth?
The Software and Services segment is expected to exhibit very high growth. While hardware dominates current revenue, the fastest expansion is in data analytics, cloud integration, and Drone-as-a-Service (DaaS) models. These services make the technology accessible and valuable to farmers by translating drone data into actionable farming insights.
Q4. Who are the top major players for this market?
The market is led by companies that excel in drone technology and precision agriculture solutions. Key players include Chinese giant DJI (which often leads by market share), along with specialized firms like AeroVironment, Trimble Inc., PrecisionHawk, and Parrot SA. These companies focus on increasing drone payload and autonomy.
Q5. Which country is the largest player?
North America (primarily the U.S. and Canada) holds the largest revenue share in the agriculture drone market. This is due to the large farm sizes, high adoption rate of precision farming technologies, and substantial R&D investments in the region, which has established infrastructure for advanced agricultural technology.
List of Figures
Figure 1: Global Agriculture Seeding Drone Market Revenue Breakdown (USD Billion, %) by Region, 2022 & 2029
Figure 2: Global Agriculture Seeding Drone Market Value Share (%), By Segment 1, 2022 & 2029
Figure 3: Global Agriculture Seeding Drone Market Forecast (USD Billion), by Sub-Segment 1, 2018-2029
Figure 4: Global Agriculture Seeding Drone Market Forecast (USD Billion), by Sub-Segment 2, 2018-2029
Figure 5: Global Agriculture Seeding Drone Market Value Share (%), By Segment 2, 2022 & 2029
Figure 6: Global Agriculture Seeding Drone Market Forecast (USD Billion), by Sub-Segment 1, 2018-2029
Figure 7: Global Agriculture Seeding Drone Market Forecast (USD Billion), by Sub-Segment 2, 2018-2029
Figure 8: Global Agriculture Seeding Drone Market Forecast (USD Billion), by Sub-Segment 3, 2018-2029
Figure 9: Global Agriculture Seeding Drone Market Forecast (USD Billion), by Others, 2018-2029
Figure 10: Global Agriculture Seeding Drone Market Value Share (%), By Segment 3, 2022 & 2029
Figure 11: Global Agriculture Seeding Drone Market Forecast (USD Billion), by Sub-Segment 1, 2018-2029
Figure 12: Global Agriculture Seeding Drone Market Forecast (USD Billion), by Sub-Segment 2, 2018-2029
Figure 13: Global Agriculture Seeding Drone Market Forecast (USD Billion), by Sub-Segment 3, 2018-2029
Figure 14: Global Agriculture Seeding Drone Market Forecast (USD Billion), by Others, 2018-2029
Figure 15: Global Agriculture Seeding Drone Market Value (USD Billion), by Region, 2022 & 2029
Figure 16: North America Agriculture Seeding Drone Market Value Share (%), By Segment 1, 2022 & 2029
Figure 17: North America Agriculture Seeding Drone Market Forecast (USD Billion), by Sub-Segment 1, 2018-2029
Figure 18: North America Agriculture Seeding Drone Market Forecast (USD Billion), by Sub-Segment 2, 2018-2029
Figure 19: North America Agriculture Seeding Drone Market Value Share (%), By Segment 2, 2022 & 2029
Figure 20: North America Agriculture Seeding Drone Market Forecast (USD Billion), by Sub-Segment 1, 2018-2029
Figure 21: North America Agriculture Seeding Drone Market Forecast (USD Billion), by Sub-Segment 2, 2018-2029
Figure 22: North America Agriculture Seeding Drone Market Forecast (USD Billion), by Sub-Segment 3, 2018-2029
Figure 23: North America Agriculture Seeding Drone Market Forecast (USD Billion), by Others, 2018-2029
Figure 24: North America Agriculture Seeding Drone Market Value Share (%), By Segment 3, 2022 & 2029
Figure 25: North America Agriculture Seeding Drone Market Forecast (USD Billion), by Sub-Segment 1, 2018-2029
Figure 26: North America Agriculture Seeding Drone Market Forecast (USD Billion), by Sub-Segment 2, 2018-2029
Figure 27: North America Agriculture Seeding Drone Market Forecast (USD Billion), by Sub-Segment 3, 2018-2029
Figure 28: North America Agriculture Seeding Drone Market Forecast (USD Billion), by Others, 2018-2029
Figure 29: North America Agriculture Seeding Drone Market Forecast (USD Billion), by U.S., 2018-2029
Figure 30: North America Agriculture Seeding Drone Market Forecast (USD Billion), by Canada, 2018-2029
Figure 31: Latin America Agriculture Seeding Drone Market Value Share (%), By Segment 1, 2022 & 2029
Figure 32: Latin America Agriculture Seeding Drone Market Forecast (USD Billion), by Sub-Segment 1, 2018-2029
Figure 33: Latin America Agriculture Seeding Drone Market Forecast (USD Billion), by Sub-Segment 2, 2018-2029
Figure 34: Latin America Agriculture Seeding Drone Market Value Share (%), By Segment 2, 2022 & 2029
Figure 35: Latin America Agriculture Seeding Drone Market Forecast (USD Billion), by Sub-Segment 1, 2018-2029
Figure 36: Latin America Agriculture Seeding Drone Market Forecast (USD Billion), by Sub-Segment 2, 2018-2029
Figure 37: Latin America Agriculture Seeding Drone Market Forecast (USD Billion), by Sub-Segment 3, 2018-2029
Figure 38: Latin America Agriculture Seeding Drone Market Forecast (USD Billion), by Others, 2018-2029
Figure 39: Latin America Agriculture Seeding Drone Market Value Share (%), By Segment 3, 2022 & 2029
Figure 40: Latin America Agriculture Seeding Drone Market Forecast (USD Billion), by Sub-Segment 1, 2018-2029
Figure 41: Latin America Agriculture Seeding Drone Market Forecast (USD Billion), by Sub-Segment 2, 2018-2029
Figure 42: Latin America Agriculture Seeding Drone Market Forecast (USD Billion), by Sub-Segment 3, 2018-2029
Figure 43: Latin America Agriculture Seeding Drone Market Forecast (USD Billion), by Others, 2018-2029
Figure 44: Latin America Agriculture Seeding Drone Market Forecast (USD Billion), by Brazil, 2018-2029
Figure 45: Latin America Agriculture Seeding Drone Market Forecast (USD Billion), by Mexico, 2018-2029
Figure 46: Latin America Agriculture Seeding Drone Market Forecast (USD Billion), by Rest of Latin America, 2018-2029
Figure 47: Europe Agriculture Seeding Drone Market Value Share (%), By Segment 1, 2022 & 2029
Figure 48: Europe Agriculture Seeding Drone Market Forecast (USD Billion), by Sub-Segment 1, 2018-2029
Figure 49: Europe Agriculture Seeding Drone Market Forecast (USD Billion), by Sub-Segment 2, 2018-2029
Figure 50: Europe Agriculture Seeding Drone Market Value Share (%), By Segment 2, 2022 & 2029
Figure 51: Europe Agriculture Seeding Drone Market Forecast (USD Billion), by Sub-Segment 1, 2018-2029
Figure 52: Europe Agriculture Seeding Drone Market Forecast (USD Billion), by Sub-Segment 2, 2018-2029
Figure 53: Europe Agriculture Seeding Drone Market Forecast (USD Billion), by Sub-Segment 3, 2018-2029
Figure 54: Europe Agriculture Seeding Drone Market Forecast (USD Billion), by Others, 2018-2029
Figure 55: Europe Agriculture Seeding Drone Market Value Share (%), By Segment 3, 2022 & 2029
Figure 56: Europe Agriculture Seeding Drone Market Forecast (USD Billion), by Sub-Segment 1, 2018-2029
Figure 57: Europe Agriculture Seeding Drone Market Forecast (USD Billion), by Sub-Segment 2, 2018-2029
Figure 58: Europe Agriculture Seeding Drone Market Forecast (USD Billion), by Sub-Segment 3, 2018-2029
Figure 59: Europe Agriculture Seeding Drone Market Forecast (USD Billion), by Others, 2018-2029
Figure 60: Europe Agriculture Seeding Drone Market Forecast (USD Billion), by U.K., 2018-2029
Figure 61: Europe Agriculture Seeding Drone Market Forecast (USD Billion), by Germany, 2018-2029
Figure 62: Europe Agriculture Seeding Drone Market Forecast (USD Billion), by France, 2018-2029
Figure 63: Europe Agriculture Seeding Drone Market Forecast (USD Billion), by Italy, 2018-2029
Figure 64: Europe Agriculture Seeding Drone Market Forecast (USD Billion), by Spain, 2018-2029
Figure 65: Europe Agriculture Seeding Drone Market Forecast (USD Billion), by Russia, 2018-2029
Figure 66: Europe Agriculture Seeding Drone Market Forecast (USD Billion), by Rest of Europe, 2018-2029
Figure 67: Asia Pacific Agriculture Seeding Drone Market Value Share (%), By Segment 1, 2022 & 2029
Figure 68: Asia Pacific Agriculture Seeding Drone Market Forecast (USD Billion), by Sub-Segment 1, 2018-2029
Figure 69: Asia Pacific Agriculture Seeding Drone Market Forecast (USD Billion), by Sub-Segment 2, 2018-2029
Figure 70: Asia Pacific Agriculture Seeding Drone Market Value Share (%), By Segment 2, 2022 & 2029
Figure 71: Asia Pacific Agriculture Seeding Drone Market Forecast (USD Billion), by Sub-Segment 1, 2018-2029
Figure 72: Asia Pacific Agriculture Seeding Drone Market Forecast (USD Billion), by Sub-Segment 2, 2018-2029
Figure 73: Asia Pacific Agriculture Seeding Drone Market Forecast (USD Billion), by Sub-Segment 3, 2018-2029
Figure 74: Asia Pacific Agriculture Seeding Drone Market Forecast (USD Billion), by Others, 2018-2029
Figure 75: Asia Pacific Agriculture Seeding Drone Market Value Share (%), By Segment 3, 2022 & 2029
Figure 76: Asia Pacific Agriculture Seeding Drone Market Forecast (USD Billion), by Sub-Segment 1, 2018-2029
Figure 77: Asia Pacific Agriculture Seeding Drone Market Forecast (USD Billion), by Sub-Segment 2, 2018-2029
Figure 78: Asia Pacific Agriculture Seeding Drone Market Forecast (USD Billion), by Sub-Segment 3, 2018-2029
Figure 79: Asia Pacific Agriculture Seeding Drone Market Forecast (USD Billion), by Others, 2018-2029
Figure 80: Asia Pacific Agriculture Seeding Drone Market Forecast (USD Billion), by China, 2018-2029
Figure 81: Asia Pacific Agriculture Seeding Drone Market Forecast (USD Billion), by India, 2018-2029
Figure 82: Asia Pacific Agriculture Seeding Drone Market Forecast (USD Billion), by Japan, 2018-2029
Figure 83: Asia Pacific Agriculture Seeding Drone Market Forecast (USD Billion), by Australia, 2018-2029
Figure 84: Asia Pacific Agriculture Seeding Drone Market Forecast (USD Billion), by Southeast Asia, 2018-2029
Figure 85: Asia Pacific Agriculture Seeding Drone Market Forecast (USD Billion), by Rest of Asia Pacific, 2018-2029
Figure 86: Middle East & Africa Agriculture Seeding Drone Market Value Share (%), By Segment 1, 2022 & 2029
Figure 87: Middle East & Africa Agriculture Seeding Drone Market Forecast (USD Billion), by Sub-Segment 1, 2018-2029
Figure 88: Middle East & Africa Agriculture Seeding Drone Market Forecast (USD Billion), by Sub-Segment 2, 2018-2029
Figure 89: Middle East & Africa Agriculture Seeding Drone Market Value Share (%), By Segment 2, 2022 & 2029
Figure 90: Middle East & Africa Agriculture Seeding Drone Market Forecast (USD Billion), by Sub-Segment 1, 2018-2029
Figure 91: Middle East & Africa Agriculture Seeding Drone Market Forecast (USD Billion), by Sub-Segment 2, 2018-2029
Figure 92: Middle East & Africa Agriculture Seeding Drone Market Forecast (USD Billion), by Sub-Segment 3, 2018-2029
Figure 93: Middle East & Africa Agriculture Seeding Drone Market Forecast (USD Billion), by Others, 2018-2029
Figure 94: Middle East & Africa Agriculture Seeding Drone Market Value Share (%), By Segment 3, 2022 & 2029
Figure 95: Middle East & Africa Agriculture Seeding Drone Market Forecast (USD Billion), by Sub-Segment 1, 2018-2029
Figure 96: Middle East & Africa Agriculture Seeding Drone Market Forecast (USD Billion), by Sub-Segment 2, 2018-2029
Figure 97: Middle East & Africa Agriculture Seeding Drone Market Forecast (USD Billion), by Sub-Segment 3, 2018-2029
Figure 98: Middle East & Africa Agriculture Seeding Drone Market Forecast (USD Billion), by Others, 2018-2029
Figure 99: Middle East & Africa Agriculture Seeding Drone Market Forecast (USD Billion), by GCC, 2018-2029
Figure 100: Middle East & Africa Agriculture Seeding Drone Market Forecast (USD Billion), by South Africa, 2018-2029
Figure 101: Middle East & Africa Agriculture Seeding Drone Market Forecast (USD Billion), by Rest of Middle East & Africa, 2018-2029
List of Tables
Table 1: Global Agriculture Seeding Drone Market Revenue (USD Billion) Forecast, by Segment 1, 2018-2029
Table 2: Global Agriculture Seeding Drone Market Revenue (USD Billion) Forecast, by Segment 2, 2018-2029
Table 3: Global Agriculture Seeding Drone Market Revenue (USD Billion) Forecast, by Segment 3, 2018-2029
Table 4: Global Agriculture Seeding Drone Market Revenue (USD Billion) Forecast, by Region, 2018-2029
Table 5: North America Agriculture Seeding Drone Market Revenue (USD Billion) Forecast, by Segment 1, 2018-2029
Table 6: North America Agriculture Seeding Drone Market Revenue (USD Billion) Forecast, by Segment 2, 2018-2029
Table 7: North America Agriculture Seeding Drone Market Revenue (USD Billion) Forecast, by Segment 3, 2018-2029
Table 8: North America Agriculture Seeding Drone Market Revenue (USD Billion) Forecast, by Country, 2018-2029
Table 9: Europe Agriculture Seeding Drone Market Revenue (USD Billion) Forecast, by Segment 1, 2018-2029
Table 10: Europe Agriculture Seeding Drone Market Revenue (USD Billion) Forecast, by Segment 2, 2018-2029
Table 11: Europe Agriculture Seeding Drone Market Revenue (USD Billion) Forecast, by Segment 3, 2018-2029
Table 12: Europe Agriculture Seeding Drone Market Revenue (USD Billion) Forecast, by Country, 2018-2029
Table 13: Latin America Agriculture Seeding Drone Market Revenue (USD Billion) Forecast, by Segment 1, 2018-2029
Table 14: Latin America Agriculture Seeding Drone Market Revenue (USD Billion) Forecast, by Segment 2, 2018-2029
Table 15: Latin America Agriculture Seeding Drone Market Revenue (USD Billion) Forecast, by Segment 3, 2018-2029
Table 16: Latin America Agriculture Seeding Drone Market Revenue (USD Billion) Forecast, by Country, 2018-2029
Table 17: Asia Pacific Agriculture Seeding Drone Market Revenue (USD Billion) Forecast, by Segment 1, 2018-2029
Table 18: Asia Pacific Agriculture Seeding Drone Market Revenue (USD Billion) Forecast, by Segment 2, 2018-2029
Table 19: Asia Pacific Agriculture Seeding Drone Market Revenue (USD Billion) Forecast, by Segment 3, 2018-2029
Table 20: Asia Pacific Agriculture Seeding Drone Market Revenue (USD Billion) Forecast, by Country, 2018-2029
Table 21: Middle East & Africa Agriculture Seeding Drone Market Revenue (USD Billion) Forecast, by Segment 1, 2018-2029
Table 22: Middle East & Africa Agriculture Seeding Drone Market Revenue (USD Billion) Forecast, by Segment 2, 2018-2029
Table 23: Middle East & Africa Agriculture Seeding Drone Market Revenue (USD Billion) Forecast, by Segment 3, 2018-2029
Table 24: Middle East & Africa Agriculture Seeding Drone Market Revenue (USD Billion) Forecast, by Country, 2018-2029
Research Process
Data Library Research are conducted by industry experts who offer insight on
industry structure, market segmentations technology assessment and competitive landscape (CL), and penetration, as well as on emerging trends. Their analysis is based on primary interviews (~ 80%) and secondary research (~ 20%) as well as years of professional expertise in their respective industries. Adding to this, by analysing historical trends and current market positions, our analysts predict where the market will be headed for the next five years. Furthermore, the varying trends of segment & categories geographically presented are also studied and the estimated based on the primary & secondary research.
In this particular report from the supply side Data Library Research has conducted primary surveys (interviews) with the key level executives (VP, CEO’s, Marketing Director, Business Development Manager
and SOFT) of the companies that active & prominent as well as the midsized organization
FIGURE 1: DLR RESEARH PROCESS
![research-methodology1]()
Primary Research
Extensive primary research was conducted to gain a deeper insight of the market and industry performance. The analysis is based on both primary and secondary research as well as years of professional expertise in the respective industries.
In addition to analysing current and historical trends, our analysts predict where the market is headed over the next five years.
It varies by segment for these categories geographically presented in the list of market tables. Speaking about this particular report we have conducted primary surveys (interviews) with the key level executives (VP, CEO’s, Marketing Director, Business Development Manager and many more) of the major players active in the market.
Secondary Research
Secondary research was mainly used to collect and identify information useful for the extensive, technical, market-oriented, and Friend’s study of the Global Extra Neutral Alcohol. It was also used to obtain key information about major players, market classification and segmentation according to the industry trends, geographical markets, and developments related to the market and technology perspectives. For this study, analysts have gathered information from various credible sources, such as annual reports, sec filings, journals, white papers, SOFT presentations, and company web sites.
Market Size Estimation
Both, top-down and bottom-up approaches were used to estimate and validate the size of the Global market and to estimate the size of various other dependent submarkets in the overall Extra Neutral Alcohol. The key players in the market were identified through secondary research and their market contributions in the respective geographies were determined through primary and secondary research.
Forecast Model
![research-methodology2]()