AI-driven Drug Discovery Market Overview and Analysis:
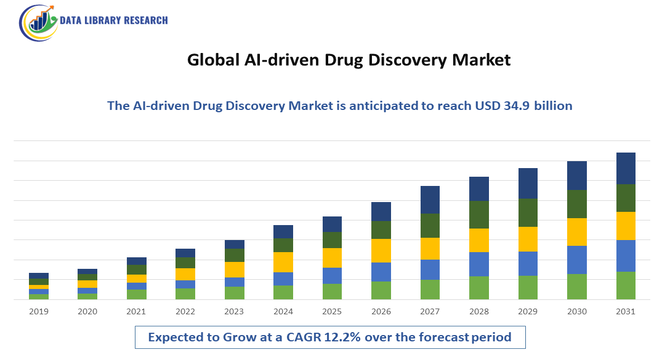
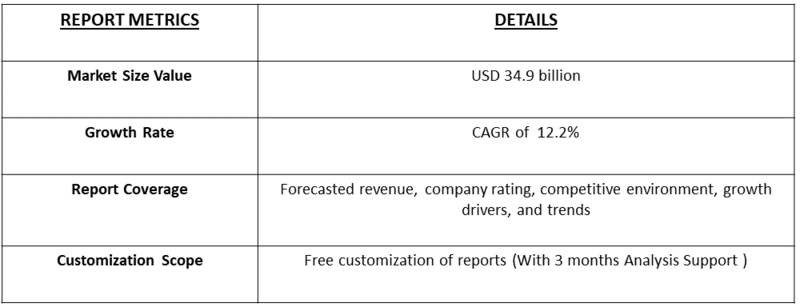
- It is projected to reach approximately USD 7.3 billion in 2025 to USD 34.9 billion by 2032, with a remarkably high Compound Annual Growth Rate (CAGR) ranging from 12.2% from 2025-2032.
Get Complete Analysis Of The Report - Download Updated Free Sample PDF
The Global AI-driven Drug Discovery Market is experiencing significant growth, driven by the increasing demand for faster, cost-effective, and more accurate drug development processes. Traditional drug discovery is time-consuming and expensive, often taking over a decade from target identification to market approval. AI technologies, including machine learning, deep learning, and natural language processing, are transforming this landscape by enabling rapid identification of drug targets, prediction of compound efficacy, and optimization of preclinical and clinical trial design.
AI-driven Drug Discovery Market Latest Trends:
The Global AI-driven Drug Discovery Market is witnessing several transformative trends as artificial intelligence reshapes pharmaceutical research. A key trend is the integration of machine learning and deep learning algorithms to predict drug-target interactions, optimize molecular structures, and accelerate lead compound identification. The use of big data analytics and multi-omics datasets is enabling more precise biomarker discovery and personalized therapy development. Additionally, cloud-based AI platforms and AI-as-a-service models are gaining traction, allowing smaller biotech firms and startups to leverage advanced computational tools without heavy infrastructure investment.
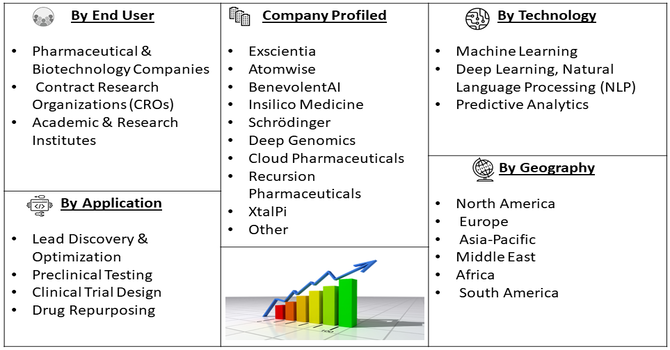
Segmentation: Global AI-driven Drug Discovery Market is segmented By Technology (Machine Learning, Deep Learning, Natural Language Processing (NLP), and Predictive Analytics), Application (Lead Discovery & Optimization, Preclinical Testing, Clinical Trial Design, and Drug Repurposing), Therapeutic Area (Oncology, Infectious Diseases, Cardiovascular Diseases, Neurological Disorders), End User (Pharmaceutical & Biotechnology Companies, Contract Research Organizations (CROs), and Academic & Research Institutes), and Geography (North America, Europe, Asia-Pacific, Middle East and Africa, and South America). The report provides the value (in USD million) for the above segments.
For Detailed Market Segmentation - Get a Free Sample PDF
Market Drivers:
- Increasing Need to Reduce Drug Development Time and Costs
The primary drivers of the AI-driven drug discovery market is the growing pressure on pharmaceutical companies to accelerate drug development while minimizing costs. For instance, in October 2025, the execution of a non-binding letter of Intent with Molecule.ai was announced by Shuttle Pharmaceuticals Holdings, Inc. The identification of the successful therapeutic candidates will be enhanced, and the development timelines and costs will be minimized with this platform.
AI technologies, including machine learning and deep learning, allow researchers to analyze vast datasets, identify promising drug candidates, and predict their efficacy and safety profiles at an early stage. This accelerates the preclinical and clinical trial processes, reduces the number of failed candidates, and significantly cuts development timelines and expenses. The ability to rapidly screen compounds and optimize molecular structures using AI is particularly valuable in responding to urgent healthcare needs, such as emerging infectious diseases and oncology therapeutics.
- Advancements in Computational Tools and Big Data Analytics
The proliferation of big data and advanced computational tools is another key driver for AI adoption in drug discovery. AI algorithms can integrate and analyze these complex datasets to uncover novel drug targets, predict potential side effects, and optimize drug design. For instance, In July 2025, a EUR 15 million Series A financing was announced by One Biosciences. The funding will be used to accelerate the clinical development of the OneMap platform and to support the scaling of strategic pharmaceutical and biotech companies' collaboration. The convergence of AI with cloud computing and high-performance computing infrastructure enables real-time simulations and modeling, supporting faster decision-making and improving the overall efficiency and success rate of drug discovery programs.
Market Restraints:
- High Implementation Costs and Resource Requirements
Implementing AI-driven drug discovery platforms involves substantial upfront investment in software, hardware, cloud computing infrastructure, and skilled personnel. Small and mid-sized pharmaceutical companies or startups may find these costs prohibitive, limiting widespread adoption. Additionally, ongoing maintenance, data management, and system upgrades further increase operational expenses, making AI integration challenging for organizations with limited budgets.
Segmental Analysis:
- Machine Learning segment is expected to witness highest growth over the forecast period
The Machine Learning segment is expected to dominate the market due to its ability to analyze vast datasets, identify patterns, and predict compound efficacy and toxicity at an early stage. Machine learning algorithms accelerate target identification, optimize lead compounds, and reduce the probability of failures during preclinical and clinical trials, making it a widely adopted technology in pharmaceutical R&D.
- Lead Discovery & Optimization segment is expected to witness highest growth over the forecast period
Lead Discovery & Optimization accounts for the largest share. AI-driven tools enable rapid screening of millions of chemical compounds, predicting their binding affinity, bioactivity, and pharmacokinetics. This accelerates the drug discovery process, reduces costs, and improves the efficiency of identifying promising drug candidates. In November 2025, Onco-Innovations Limited announced a pilot project with Kuano Ltd. to advance development of its PNKP Inhibitor Technology (A83B4C63). The collaboration leveraged Kuano’s computational platforms to accelerate discovery and optimization of novel cancer therapies. This initiative represented a key step in Onco’s mission to utilize advanced technologies for faster, more precise therapeutic innovation, aiming to unlock new mechanisms for effective cancer treatment.
- Oncology segment is expected to witness highest growth over the forecast period
The Oncology segment leads the market due to the high prevalence of cancer worldwide and the urgent need for targeted and personalized therapies. AI technologies are extensively used in oncology for predicting tumor targets, identifying biomarkers, and optimizing therapeutic molecules, thereby improving treatment outcomes and accelerating the development of innovative cancer drugs.
Additionally, the growing availability of large-scale clinical and genomic datasets has further fueled AI adoption in oncology. By integrating machine learning and predictive analytics, researchers can streamline clinical trial design, reduce development costs, and minimize time-to-market for novel therapies. This convergence of AI and oncology not only enhances precision medicine but also drives increased investment in AI-driven drug discovery platforms, reinforcing the segment’s dominance.
- Pharmaceutical & Biotechnology Companies segment is expected to witness highest growth over the forecast period
Pharmaceutical & Biotechnology Companies dominate the market. These organizations leverage AI-driven platforms to enhance research efficiency, reduce R&D costs, and accelerate the drug development pipeline. Collaborations with AI technology providers further support innovation and the discovery of novel therapeutics. In 2024, AstraZeneca announced a USD 3.5 billion capital investment in the U.S. to expand its research and manufacturing footprint by 2026, including USD 2 billion creating over a thousand high-skilled jobs. The expansion encompassed a state-of-the-art R&D center in Massachusetts, biologics and cell therapy manufacturing facilities on both coasts, and specialty manufacturing in Texas. This move strengthened pharmaceutical and biotechnology capabilities while supporting growth and adoption in this segment’s growth thereby driving the global AI-driven drug discovery market.
- North America region is expected to witness highest growth over the forecast period
The North America region is expected to witness the highest growth over the forecast period in the Global AI-driven Drug Discovery Market. This growth is driven by the region’s advanced healthcare infrastructure, strong presence of leading pharmaceutical and biotechnology companies, and significant investments in research and development.
The rapid adoption of AI technologies, including machine learning, deep learning, and predictive analytics, enables faster drug target identification, compound optimization, and clinical trial design. For instance, in November 2025, Nona Biosciences, a global biotech company specializing in end-to-end drug discovery, announced a non-exclusive license agreement with Pfizer to accelerate preclinical antibody discovery. Under the agreement, Pfizer gained global access to Nona’s HCAb platform to generate fully human heavy chain-only antibodies. Nona received an upfront payment and became eligible for milestone payments, while collaborating with Pfizer on antibody discovery, development, and engineering using its HCAb platform, B-cell screening technologies, and integrated services.
Additionally, supportive regulatory frameworks, high healthcare expenditure, and increasing demand for innovative therapies for chronic and complex diseases further contribute to North America’s leading position in the market. For instance, Merck’s 2024 R&D spending was nearly USD 13 billion, yet the New Jersey-based pharma remained USD 700 million ahead of Johnson & Johnson. Thus, such high pharma R&D expenditure by is expected to drive the above market’s growth in this region.
To Learn More About This Report - Request a Free Sample Copy
AI-driven Drug Discovery Market Competitive Landscape:
The Global AI driven Drug Discovery Market features a dynamic competitive environment with a diverse mix of AI native biotech firms, large pharmaceutical companies partnering with technology providers, and specialist AI software vendors. These companies are challenging traditional discovery paradigms by integrating machine learning, deep learning, predictive analytics and multi omics data for faster target identification, lead optimization, preclinical modelling, and clinical design. The competitive pressures and collaboration networks are driving rapid innovation and consolidation in the market.
Key Players:
- Exscientia
- Atomwise
- BenevolentAI
- Insilico Medicine
- Schrödinger
- Deep Genomics
- Cloud Pharmaceuticals
- Recursion Pharmaceuticals
- XtalPi
- Owkin
- Isomorphic Labs
- IBM Watson Health
- NVIDIA Corporation
- Alphabet Inc. (via its AI drug discovery initiatives)
- Atomwise (listed again for prominence)
- BioSymetrics
- Verge Genomics
- Insitro
- twoXAR Pharmaceuticals
- Numerate
Recent Development
- In November 2025, Insilico Medicine, a clinical-stage AI-driven drug discovery company, announced a research collaboration with Eli Lilly to combine Insilico’s Pharma.AI platforms with Lilly’s development and disease expertise to discover and advance new therapies. Insilico used its Pharma.AI platform to generate, design, and optimize candidate compounds and became eligible to receive over USD 100 million through upfront payments, milestones, and tiered royalties on net sales of any resulting drugs.
- In Novemver 2024, NVIDIA and Amgen partnered on the AI project ‘Freyja’ at deCODE genetics in Reykjavik, Iceland, to advance disease diagnostics and drug target discovery. The collaboration combined NVIDIA’s AI technologies with Amgen’s biotechnology expertise, deploying Freyja to analyze extensive human datasets. The AI platform identified drug targets and biomarkers, providing critical insights into disease progression, regression, and diagnostics, and supporting more effective drug development strategies.
Frequently Asked Questions (FAQ) :
Q1. What are the main growth-driving factors for this market?
The market's main driver is the immense pressure to cut the decade-long timelines and astronomical costs of traditional drug development. AI is uniquely positioned to handle vast scientific data quickly, helping scientists find new drug targets and predict how effective a compound will be. This efficiency is expected to lead to higher success rates for new drug candidates.
Q2. What are the main restraining factors for this market?
A primary hurdle is the poor quality and lack of uniform standards in the huge biological datasets used to train AI models, which can cause unreliable results. There's also a serious shortage of talent, specifically people who are experts in both AI modeling and pharmaceutical science. Finally, the process for getting AI-discovered drugs approved by regulatory bodies is still developing and unclear.
Q3. Which segment is expected to witness high growth?
The segment expected to see the fastest growth is Target Identification and Validation. This is where AI excels, using complex algorithms to quickly analyze genetic and protein information to pinpoint the exact molecules responsible for a disease. Identifying and prioritizing viable drug targets early in the process is highly valuable because it avoids wasted effort and massive expenditure on the wrong therapeutic routes.
Q4. Who are the top major players for this market?
The key players include major pharmaceutical companies like Bayer and several leading specialized AI companies such as BenevolentAI, Exscientia, and Schrödinger. Competition is focused on creating advanced, proprietary AI platforms with unique algorithms. Successful strategies rely on forming strong, exclusive collaboration agreements with big pharma to co-develop new drugs, not just sell software.
Q5. Which country is the largest player?
The United States holds the largest share of this market by revenue. This dominance is due to the presence of the world's highest concentration of innovative AI biotech startups and abundant venture capital funding. The strong connection between major U.S. pharmaceutical companies, tech hubs, and academic research institutions creates an ideal environment for rapidly translating AI research into commercial drug pipelines.
List of Figures
Figure 1: Global AI-driven Drug Discovery Market Revenue Breakdown (USD Billion, %) by Region, 2022 & 2029
Figure 2: Global AI-driven Drug Discovery Market Value Share (%), By Segment 1, 2022 & 2029
Figure 3: Global AI-driven Drug Discovery Market Forecast (USD Billion), by Sub-Segment 1, 2018-2029
Figure 4: Global AI-driven Drug Discovery Market Forecast (USD Billion), by Sub-Segment 2, 2018-2029
Figure 5: Global AI-driven Drug Discovery Market Value Share (%), By Segment 2, 2022 & 2029
Figure 6: Global AI-driven Drug Discovery Market Forecast (USD Billion), by Sub-Segment 1, 2018-2029
Figure 7: Global AI-driven Drug Discovery Market Forecast (USD Billion), by Sub-Segment 2, 2018-2029
Figure 8: Global AI-driven Drug Discovery Market Forecast (USD Billion), by Sub-Segment 3, 2018-2029
Figure 9: Global AI-driven Drug Discovery Market Forecast (USD Billion), by Others, 2018-2029
Figure 10: Global AI-driven Drug Discovery Market Value Share (%), By Segment 3, 2022 & 2029
Figure 11: Global AI-driven Drug Discovery Market Forecast (USD Billion), by Sub-Segment 1, 2018-2029
Figure 12: Global AI-driven Drug Discovery Market Forecast (USD Billion), by Sub-Segment 2, 2018-2029
Figure 13: Global AI-driven Drug Discovery Market Forecast (USD Billion), by Sub-Segment 3, 2018-2029
Figure 14: Global AI-driven Drug Discovery Market Forecast (USD Billion), by Others, 2018-2029
Figure 15: Global AI-driven Drug Discovery Market Value (USD Billion), by Region, 2022 & 2029
Figure 16: North America AI-driven Drug Discovery Market Value Share (%), By Segment 1, 2022 & 2029
Figure 17: North America AI-driven Drug Discovery Market Forecast (USD Billion), by Sub-Segment 1, 2018-2029
Figure 18: North America AI-driven Drug Discovery Market Forecast (USD Billion), by Sub-Segment 2, 2018-2029
Figure 19: North America AI-driven Drug Discovery Market Value Share (%), By Segment 2, 2022 & 2029
Figure 20: North America AI-driven Drug Discovery Market Forecast (USD Billion), by Sub-Segment 1, 2018-2029
Figure 21: North America AI-driven Drug Discovery Market Forecast (USD Billion), by Sub-Segment 2, 2018-2029
Figure 22: North America AI-driven Drug Discovery Market Forecast (USD Billion), by Sub-Segment 3, 2018-2029
Figure 23: North America AI-driven Drug Discovery Market Forecast (USD Billion), by Others, 2018-2029
Figure 24: North America AI-driven Drug Discovery Market Value Share (%), By Segment 3, 2022 & 2029
Figure 25: North America AI-driven Drug Discovery Market Forecast (USD Billion), by Sub-Segment 1, 2018-2029
Figure 26: North America AI-driven Drug Discovery Market Forecast (USD Billion), by Sub-Segment 2, 2018-2029
Figure 27: North America AI-driven Drug Discovery Market Forecast (USD Billion), by Sub-Segment 3, 2018-2029
Figure 28: North America AI-driven Drug Discovery Market Forecast (USD Billion), by Others, 2018-2029
Figure 29: North America AI-driven Drug Discovery Market Forecast (USD Billion), by U.S., 2018-2029
Figure 30: North America AI-driven Drug Discovery Market Forecast (USD Billion), by Canada, 2018-2029
Figure 31: Latin America AI-driven Drug Discovery Market Value Share (%), By Segment 1, 2022 & 2029
Figure 32: Latin America AI-driven Drug Discovery Market Forecast (USD Billion), by Sub-Segment 1, 2018-2029
Figure 33: Latin America AI-driven Drug Discovery Market Forecast (USD Billion), by Sub-Segment 2, 2018-2029
Figure 34: Latin America AI-driven Drug Discovery Market Value Share (%), By Segment 2, 2022 & 2029
Figure 35: Latin America AI-driven Drug Discovery Market Forecast (USD Billion), by Sub-Segment 1, 2018-2029
Figure 36: Latin America AI-driven Drug Discovery Market Forecast (USD Billion), by Sub-Segment 2, 2018-2029
Figure 37: Latin America AI-driven Drug Discovery Market Forecast (USD Billion), by Sub-Segment 3, 2018-2029
Figure 38: Latin America AI-driven Drug Discovery Market Forecast (USD Billion), by Others, 2018-2029
Figure 39: Latin America AI-driven Drug Discovery Market Value Share (%), By Segment 3, 2022 & 2029
Figure 40: Latin America AI-driven Drug Discovery Market Forecast (USD Billion), by Sub-Segment 1, 2018-2029
Figure 41: Latin America AI-driven Drug Discovery Market Forecast (USD Billion), by Sub-Segment 2, 2018-2029
Figure 42: Latin America AI-driven Drug Discovery Market Forecast (USD Billion), by Sub-Segment 3, 2018-2029
Figure 43: Latin America AI-driven Drug Discovery Market Forecast (USD Billion), by Others, 2018-2029
Figure 44: Latin America AI-driven Drug Discovery Market Forecast (USD Billion), by Brazil, 2018-2029
Figure 45: Latin America AI-driven Drug Discovery Market Forecast (USD Billion), by Mexico, 2018-2029
Figure 46: Latin America AI-driven Drug Discovery Market Forecast (USD Billion), by Rest of Latin America, 2018-2029
Figure 47: Europe AI-driven Drug Discovery Market Value Share (%), By Segment 1, 2022 & 2029
Figure 48: Europe AI-driven Drug Discovery Market Forecast (USD Billion), by Sub-Segment 1, 2018-2029
Figure 49: Europe AI-driven Drug Discovery Market Forecast (USD Billion), by Sub-Segment 2, 2018-2029
Figure 50: Europe AI-driven Drug Discovery Market Value Share (%), By Segment 2, 2022 & 2029
Figure 51: Europe AI-driven Drug Discovery Market Forecast (USD Billion), by Sub-Segment 1, 2018-2029
Figure 52: Europe AI-driven Drug Discovery Market Forecast (USD Billion), by Sub-Segment 2, 2018-2029
Figure 53: Europe AI-driven Drug Discovery Market Forecast (USD Billion), by Sub-Segment 3, 2018-2029
Figure 54: Europe AI-driven Drug Discovery Market Forecast (USD Billion), by Others, 2018-2029
Figure 55: Europe AI-driven Drug Discovery Market Value Share (%), By Segment 3, 2022 & 2029
Figure 56: Europe AI-driven Drug Discovery Market Forecast (USD Billion), by Sub-Segment 1, 2018-2029
Figure 57: Europe AI-driven Drug Discovery Market Forecast (USD Billion), by Sub-Segment 2, 2018-2029
Figure 58: Europe AI-driven Drug Discovery Market Forecast (USD Billion), by Sub-Segment 3, 2018-2029
Figure 59: Europe AI-driven Drug Discovery Market Forecast (USD Billion), by Others, 2018-2029
Figure 60: Europe AI-driven Drug Discovery Market Forecast (USD Billion), by U.K., 2018-2029
Figure 61: Europe AI-driven Drug Discovery Market Forecast (USD Billion), by Germany, 2018-2029
Figure 62: Europe AI-driven Drug Discovery Market Forecast (USD Billion), by France, 2018-2029
Figure 63: Europe AI-driven Drug Discovery Market Forecast (USD Billion), by Italy, 2018-2029
Figure 64: Europe AI-driven Drug Discovery Market Forecast (USD Billion), by Spain, 2018-2029
Figure 65: Europe AI-driven Drug Discovery Market Forecast (USD Billion), by Russia, 2018-2029
Figure 66: Europe AI-driven Drug Discovery Market Forecast (USD Billion), by Rest of Europe, 2018-2029
Figure 67: Asia Pacific AI-driven Drug Discovery Market Value Share (%), By Segment 1, 2022 & 2029
Figure 68: Asia Pacific AI-driven Drug Discovery Market Forecast (USD Billion), by Sub-Segment 1, 2018-2029
Figure 69: Asia Pacific AI-driven Drug Discovery Market Forecast (USD Billion), by Sub-Segment 2, 2018-2029
Figure 70: Asia Pacific AI-driven Drug Discovery Market Value Share (%), By Segment 2, 2022 & 2029
Figure 71: Asia Pacific AI-driven Drug Discovery Market Forecast (USD Billion), by Sub-Segment 1, 2018-2029
Figure 72: Asia Pacific AI-driven Drug Discovery Market Forecast (USD Billion), by Sub-Segment 2, 2018-2029
Figure 73: Asia Pacific AI-driven Drug Discovery Market Forecast (USD Billion), by Sub-Segment 3, 2018-2029
Figure 74: Asia Pacific AI-driven Drug Discovery Market Forecast (USD Billion), by Others, 2018-2029
Figure 75: Asia Pacific AI-driven Drug Discovery Market Value Share (%), By Segment 3, 2022 & 2029
Figure 76: Asia Pacific AI-driven Drug Discovery Market Forecast (USD Billion), by Sub-Segment 1, 2018-2029
Figure 77: Asia Pacific AI-driven Drug Discovery Market Forecast (USD Billion), by Sub-Segment 2, 2018-2029
Figure 78: Asia Pacific AI-driven Drug Discovery Market Forecast (USD Billion), by Sub-Segment 3, 2018-2029
Figure 79: Asia Pacific AI-driven Drug Discovery Market Forecast (USD Billion), by Others, 2018-2029
Figure 80: Asia Pacific AI-driven Drug Discovery Market Forecast (USD Billion), by China, 2018-2029
Figure 81: Asia Pacific AI-driven Drug Discovery Market Forecast (USD Billion), by India, 2018-2029
Figure 82: Asia Pacific AI-driven Drug Discovery Market Forecast (USD Billion), by Japan, 2018-2029
Figure 83: Asia Pacific AI-driven Drug Discovery Market Forecast (USD Billion), by Australia, 2018-2029
Figure 84: Asia Pacific AI-driven Drug Discovery Market Forecast (USD Billion), by Southeast Asia, 2018-2029
Figure 85: Asia Pacific AI-driven Drug Discovery Market Forecast (USD Billion), by Rest of Asia Pacific, 2018-2029
Figure 86: Middle East & Africa AI-driven Drug Discovery Market Value Share (%), By Segment 1, 2022 & 2029
Figure 87: Middle East & Africa AI-driven Drug Discovery Market Forecast (USD Billion), by Sub-Segment 1, 2018-2029
Figure 88: Middle East & Africa AI-driven Drug Discovery Market Forecast (USD Billion), by Sub-Segment 2, 2018-2029
Figure 89: Middle East & Africa AI-driven Drug Discovery Market Value Share (%), By Segment 2, 2022 & 2029
Figure 90: Middle East & Africa AI-driven Drug Discovery Market Forecast (USD Billion), by Sub-Segment 1, 2018-2029
Figure 91: Middle East & Africa AI-driven Drug Discovery Market Forecast (USD Billion), by Sub-Segment 2, 2018-2029
Figure 92: Middle East & Africa AI-driven Drug Discovery Market Forecast (USD Billion), by Sub-Segment 3, 2018-2029
Figure 93: Middle East & Africa AI-driven Drug Discovery Market Forecast (USD Billion), by Others, 2018-2029
Figure 94: Middle East & Africa AI-driven Drug Discovery Market Value Share (%), By Segment 3, 2022 & 2029
Figure 95: Middle East & Africa AI-driven Drug Discovery Market Forecast (USD Billion), by Sub-Segment 1, 2018-2029
Figure 96: Middle East & Africa AI-driven Drug Discovery Market Forecast (USD Billion), by Sub-Segment 2, 2018-2029
Figure 97: Middle East & Africa AI-driven Drug Discovery Market Forecast (USD Billion), by Sub-Segment 3, 2018-2029
Figure 98: Middle East & Africa AI-driven Drug Discovery Market Forecast (USD Billion), by Others, 2018-2029
Figure 99: Middle East & Africa AI-driven Drug Discovery Market Forecast (USD Billion), by GCC, 2018-2029
Figure 100: Middle East & Africa AI-driven Drug Discovery Market Forecast (USD Billion), by South Africa, 2018-2029
Figure 101: Middle East & Africa AI-driven Drug Discovery Market Forecast (USD Billion), by Rest of Middle East & Africa, 2018-2029
List of Tables
Table 1: Global AI-driven Drug Discovery Market Revenue (USD Billion) Forecast, by Segment 1, 2018-2029
Table 2: Global AI-driven Drug Discovery Market Revenue (USD Billion) Forecast, by Segment 2, 2018-2029
Table 3: Global AI-driven Drug Discovery Market Revenue (USD Billion) Forecast, by Segment 3, 2018-2029
Table 4: Global AI-driven Drug Discovery Market Revenue (USD Billion) Forecast, by Region, 2018-2029
Table 5: North America AI-driven Drug Discovery Market Revenue (USD Billion) Forecast, by Segment 1, 2018-2029
Table 6: North America AI-driven Drug Discovery Market Revenue (USD Billion) Forecast, by Segment 2, 2018-2029
Table 7: North America AI-driven Drug Discovery Market Revenue (USD Billion) Forecast, by Segment 3, 2018-2029
Table 8: North America AI-driven Drug Discovery Market Revenue (USD Billion) Forecast, by Country, 2018-2029
Table 9: Europe AI-driven Drug Discovery Market Revenue (USD Billion) Forecast, by Segment 1, 2018-2029
Table 10: Europe AI-driven Drug Discovery Market Revenue (USD Billion) Forecast, by Segment 2, 2018-2029
Table 11: Europe AI-driven Drug Discovery Market Revenue (USD Billion) Forecast, by Segment 3, 2018-2029
Table 12: Europe AI-driven Drug Discovery Market Revenue (USD Billion) Forecast, by Country, 2018-2029
Table 13: Latin America AI-driven Drug Discovery Market Revenue (USD Billion) Forecast, by Segment 1, 2018-2029
Table 14: Latin America AI-driven Drug Discovery Market Revenue (USD Billion) Forecast, by Segment 2, 2018-2029
Table 15: Latin America AI-driven Drug Discovery Market Revenue (USD Billion) Forecast, by Segment 3, 2018-2029
Table 16: Latin America AI-driven Drug Discovery Market Revenue (USD Billion) Forecast, by Country, 2018-2029
Table 17: Asia Pacific AI-driven Drug Discovery Market Revenue (USD Billion) Forecast, by Segment 1, 2018-2029
Table 18: Asia Pacific AI-driven Drug Discovery Market Revenue (USD Billion) Forecast, by Segment 2, 2018-2029
Table 19: Asia Pacific AI-driven Drug Discovery Market Revenue (USD Billion) Forecast, by Segment 3, 2018-2029
Table 20: Asia Pacific AI-driven Drug Discovery Market Revenue (USD Billion) Forecast, by Country, 2018-2029
Table 21: Middle East & Africa AI-driven Drug Discovery Market Revenue (USD Billion) Forecast, by Segment 1, 2018-2029
Table 22: Middle East & Africa AI-driven Drug Discovery Market Revenue (USD Billion) Forecast, by Segment 2, 2018-2029
Table 23: Middle East & Africa AI-driven Drug Discovery Market Revenue (USD Billion) Forecast, by Segment 3, 2018-2029
Table 24: Middle East & Africa AI-driven Drug Discovery Market Revenue (USD Billion) Forecast, by Country, 2018-2029
Research Process
Data Library Research are conducted by industry experts who offer insight on
industry structure, market segmentations technology assessment and competitive landscape (CL), and penetration, as well as on emerging trends. Their analysis is based on primary interviews (~ 80%) and secondary research (~ 20%) as well as years of professional expertise in their respective industries. Adding to this, by analysing historical trends and current market positions, our analysts predict where the market will be headed for the next five years. Furthermore, the varying trends of segment & categories geographically presented are also studied and the estimated based on the primary & secondary research.
In this particular report from the supply side Data Library Research has conducted primary surveys (interviews) with the key level executives (VP, CEO’s, Marketing Director, Business Development Manager
and SOFT) of the companies that active & prominent as well as the midsized organization
FIGURE 1: DLR RESEARH PROCESS
![research-methodology1]()
Primary Research
Extensive primary research was conducted to gain a deeper insight of the market and industry performance. The analysis is based on both primary and secondary research as well as years of professional expertise in the respective industries.
In addition to analysing current and historical trends, our analysts predict where the market is headed over the next five years.
It varies by segment for these categories geographically presented in the list of market tables. Speaking about this particular report we have conducted primary surveys (interviews) with the key level executives (VP, CEO’s, Marketing Director, Business Development Manager and many more) of the major players active in the market.
Secondary Research
Secondary research was mainly used to collect and identify information useful for the extensive, technical, market-oriented, and Friend’s study of the Global Extra Neutral Alcohol. It was also used to obtain key information about major players, market classification and segmentation according to the industry trends, geographical markets, and developments related to the market and technology perspectives. For this study, analysts have gathered information from various credible sources, such as annual reports, sec filings, journals, white papers, SOFT presentations, and company web sites.
Market Size Estimation
Both, top-down and bottom-up approaches were used to estimate and validate the size of the Global market and to estimate the size of various other dependent submarkets in the overall Extra Neutral Alcohol. The key players in the market were identified through secondary research and their market contributions in the respective geographies were determined through primary and secondary research.
Forecast Model
![research-methodology2]()