Air Conditioning Health Comfort Customization Market Overview and Analysis
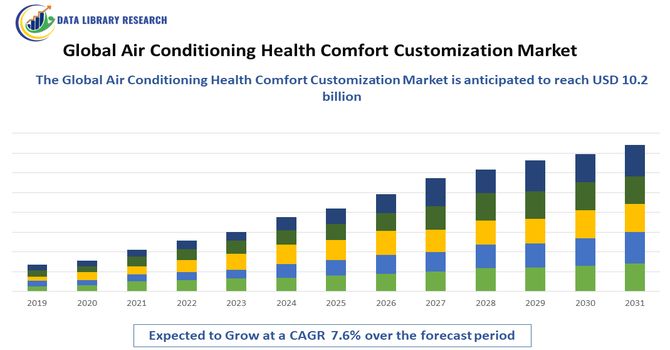
- The Global Air Conditioning Health, Comfort, and Customization Market was valued at USD 6.26 billion in 2025 and is forecasted to grow to USD 10.2 billion by 2035, expanding at a Compound Annual Growth Rate (CAGR) of 7.6% over the forecast period, 2025-2032.
Get Complete Analysis Of The Report - Download Updated Free Sample PDF
The Global Air Conditioning Health Comfort Customization Market is experiencing strong growth driven by rising consumer demand for personalized indoor climate solutions that enhance health, comfort, and well-being. Increasing awareness of air quality, humidity control, and allergen management is encouraging adoption of smart HVAC systems with customizable features. Technological advancements, including IoT-enabled sensors, AI-based climate control, and mobile app integration, allow users to tailor temperature, airflow, and air purification settings. Additionally, the growing trend of smart homes, energy-efficient solutions, and commercial buildings seeking occupant-centric comfort further fuels market expansion globally.
Air Conditioning Health Comfort Customization Market Latest Trends
The Global Air Conditioning Health Comfort Customization Market is witnessing trends centered on smart, personalized, and health-focused climate control. Integration of IoT-enabled sensors and AI-driven systems allows real-time monitoring and automatic adjustment of temperature, humidity, and air quality to individual preferences. There is a rising adoption of air purification technologies, UV sterilization, and allergen filtering in HVAC systems to improve indoor health and comfort. Additionally, mobile app-based controls, voice command integration, and cloud connectivity are gaining traction, enabling users to customize their environment remotely. Energy-efficient and sustainable solutions are also becoming key features in modern customized AC systems.
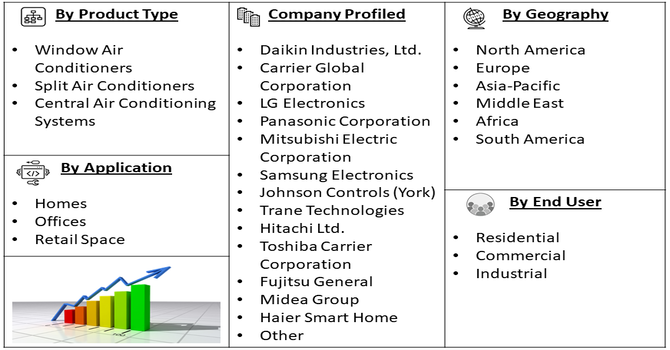
Segmentation: Global Air Conditioning Health Comfort Customization Market is segmented By Product Type (Window Air Conditioners, Split Air Conditioners, and Central Air Conditioning Systems), Customization Feature (Temperature Control, Humidity Control, and Air Quality & Purification Control), End-User (Residential, Commercial, Industrial), Application (Homes, Offices, and Retail Space), and Geography (North America, Europe, Asia-Pacific, Middle East and Africa, and South America). The report provides the value (in USD million) for the above segments.
For Detailed Market Segmentation - Get a Free Sample PDF
Market Drivers:
- Rising Awareness of Health and Indoor Air Quality
Growing concerns about indoor air quality, allergens, pollutants, and humidity-related health issues are driving the adoption of customized air conditioning systems. Consumers and businesses are increasingly looking for HVAC solutions that not only provide cooling but also improve overall health and comfort. Features such as air purification, HEPA filters, UV sterilization, and humidity control help reduce respiratory problems, allergies, and airborne pathogens. This heightened awareness is fueling demand for AC systems with health-focused customization options, especially in residential spaces, healthcare facilities, and offices.
- Increasing Adoption of Smart and IoT-Enabled HVAC Systems
The trend toward smart homes and intelligent building management is accelerating demand for air conditioning systems with advanced customization features. IoT-enabled sensors, AI-driven climate control, and mobile app integration allow users to remotely adjust temperature, airflow, humidity, and air quality according to personal preferences.
In February 2025, Daikin Applied expanded its U.S. service footprint by acquiring Varitec Solutions and absorbing over 200 field technicians. This move strengthens Daikin’s presence in the Southwest, a region experiencing prolonged heatwaves, boosting demand for new-build and retrofit cooling solutions and supporting regional growth in air conditioning services. Such real-time control enhances comfort, energy efficiency, and convenience, encouraging consumers and commercial establishments to invest in customizable AC solutions. The growing integration of AI and connectivity features is therefore a major driver for market growth globally.
Market Restraints:
- High Initial Cost and Installation Expenses
The primary restraints for this market is the high upfront cost associated with health-focused, customizable air conditioning systems. Advanced features such as air purification modules, humidity control, smart sensors, and IoT-enabled connectivity significantly increase the price compared to conventional AC units. Additionally, installation and integration of these sophisticated systems require skilled labor and often involve retrofitting existing infrastructure, which adds to overall expenses. This high cost can discourage adoption, especially among price-sensitive residential customers and small commercial establishments.
Socioeconomic Impact on Air Conditioning Health Comfort Customization Market
The Global Air Conditioning Health Comfort Customization Market has notable socioeconomic impacts by improving indoor air quality, thermal comfort, and overall well-being across residential, commercial, and industrial settings. Enhanced air conditioning systems that allow health-focused customization reduce risks of heat-related illnesses, respiratory problems, and workplace fatigue, contributing to higher productivity and lower healthcare costs. The market also stimulates economic growth by generating employment in HVAC design, installation, maintenance, and technology development sectors. Rising consumer awareness and demand for personalized climate control drive investments in smart and energy-efficient systems, promoting sustainability. Furthermore, improved indoor environments enhance quality of life, particularly for vulnerable populations, while supporting urban infrastructure development and the broader adoption of advanced building technologies worldwide.
Segmental Analysis:
- Split Air Conditioners segment is expected to witness the highest growth over the forecast period
Split air conditioners dominate the product type segment due to their flexibility, efficiency, and suitability for both residential and commercial spaces. They allow targeted cooling and comfort customization in individual rooms or zones, making them ideal for users seeking personalized climate control. Their relatively easier installation and integration with smart and IoT-enabled systems enhance their adoption for health-focused AC solutions.
- Air Quality & Purification Control segment is expected to witness the highest growth over the forecast period
Air quality and purification control is a key driver as consumers increasingly demand cleaner indoor air to reduce allergens, dust, pollutants, and airborne pathogens. Systems equipped with HEPA filters, UV sterilization, and ionization modules help maintain a healthier indoor environment, making this feature highly sought-after in residential, commercial, and healthcare applications.
- Residential segment is expected to witness the highest growth over the forecast period
The residential segment leads market adoption, as homeowners increasingly prioritize comfort, health, and energy efficiency. Customized AC solutions in homes provide temperature, airflow, and air quality control tailored to individual preferences, supporting wellness and lifestyle-focused living spaces. Rising awareness of indoor air quality and smart home integration further fuels growth in this segment.
- Offices segment is expected to witness highest growth over the forecast period
Offices are a significant application segment, as employers aim to enhance employee productivity and well-being through improved indoor climate conditions. Customizable AC systems enable precise temperature, humidity, and air quality control, creating a healthier, comfortable work environment, which is particularly important in commercial buildings and co-working spaces.
- Asia Pacific segment is expected to witness the highest growth over the forecast period
The Asia Pacific segment is expected to witness the highest growth in the Global Air Conditioning Health Comfort Customization Market over the forecast period. Rapid urbanization, rising disposable incomes, and increasing awareness of health and wellness are driving demand for advanced, customizable air conditioning solutions.
The region’s hot and humid climate further fuels the need for personalized indoor comfort and improved air quality. Growing investments in smart building technologies and expanding commercial infrastructure are also key growth factors. Additionally, government initiatives focusing on energy efficiency and sustainability encourage adoption of innovative HVAC systems.
Emerging economies like China, India, and Southeast Asian countries are leading this surge, making Asia Pacific a critical market for air conditioning customization and health-focused comfort technologies. For instance, in January 2025, LG launched the DUALCOOL AI Air Conditioner featuring depth sensors to track occupant location and an ionizer filtration module. This flagship model targets premium residential buyers seeking smart-home integration and enhanced indoor air quality, reflecting growing consumer demand for advanced, health-focused climate control solutions.
Thus, such factors are expected to drive this market’s growth in this region.
| Report Matrics |
Details |
| Market Size Value |
USD 10.2 billion |
| Growth Rate |
CAGR of 7.6 % |
| Forecast |
2026-2033 |
| Historical data |
2021-2024 |
| Base Year |
2025 |
| Report Coverage |
Forecasted revenue, company rating, competitive environment, growth drivers, and trends |
| Segment Coverage |
Type, Application, End-User, Geography |
| Regional Scope |
North America, Europe, Asia Pacific, Middle East |
| Customized scope |
Free customization of reports (With 3 months' analysis support) |
| To Learn More About This Report |
Request a Free Sample Copy |
Air Conditioning Health Comfort Customization Market Competitive Landscape
The Global Air Conditioning Health Comfort Customization Market is highly competitive, with key players focusing on innovation in smart and health centric HVAC technologies, integration of IoT and AI for personalized user control, and strategic partnerships to expand their product portfolios. Manufacturers are investing in advanced air purification, humidity control, energy efficient solutions, and cloud connected platforms to meet rising consumer demand for enhanced comfort and indoor air quality. Companies are also emphasizing after sales service, sustainability features, and regional expansion to differentiate their offerings and capture greater market share in both residential and commercial segments.
Key Players:
- Daikin Industries, Ltd.
- Carrier Global Corporation
- LG Electronics
- Panasonic Corporation
- Mitsubishi Electric Corporation
- Samsung Electronics
- Johnson Controls (York)
- Trane Technologies
- Hitachi Ltd.
- Toshiba Carrier Corporation
- Fujitsu General
- Midea Group
- Haier Smart Home
- Rheem Manufacturing Company
- Lennox International
- Bosch Thermotechnology
- Whirlpool Corporation
- Sanyo Electric Co., Ltd.
- Blue Star Limited
- Voltas Limited
Recent Development
- In May 2025, Samsung finalized its EUR 1.5 billion acquisition of FläktGroup, adding precision air handlers and energy-recovery ventilators to its portfolio. This strategic move positions Samsung to meet Europe’s growing demand for data-center cooling solutions, enhancing its capabilities in energy-efficient ventilation technologies and strengthening its competitive edge in the expanding data-center cooling market.
- In March 2025, Carrier and Google Cloud unveiled an AI-powered Home Energy Management platform that integrates HVAC, rooftop solar, and battery storage into a single control system. This collaboration promises households up to 20% energy savings and introduces a recurring revenue software layer for Carrier, enhancing smart energy management and sustainable living for consumers.
Frequently Asked Questions (FAQ) :
Q1. What are the main growth-driving factors for this market?
Rising global temperatures, driven by climate change and increased frequency of heatwaves, make air conditioning a necessity for health and productivity. This demand is amplified by rapid urbanization and the growing middle class in emerging economies. Consumers are increasingly prioritizing systems that offer not just cooling, but superior indoor air quality and energy efficiency, driving innovation and sales.
Q2. What are the main restraining factors for this market?
The significant high upfront costs for advanced, energy-efficient, and customized AC systems, including installation and ongoing maintenance, act as a major restraint. These costs often pose a substantial barrier to adoption, particularly for price-sensitive consumers and smaller businesses in developing countries, slowing down mass market penetration.
Q3. Which segment is expected to witness high growth?
The Air Quality & Purification Control segment is expected to witness the highest growth over the forecast period due to increasing concerns about indoor air pollution and health. Rising demand for advanced filtration, purification technologies, and regulatory emphasis on air quality are driving widespread adoption across residential, commercial, and industrial sectors.
Q4. Who are the top major players for this market?
The market is led by established global manufacturers known for quality, technology, and energy efficiency. Key players include Daikin Industries, Carrier Global Corporation, Trane Technologies, and Mitsubishi Electric Corporation. These companies focus on developing smart, IoT-enabled, and highly customized cooling solutions that address both environmental regulations and consumer health concerns.
Q5. Which country is the largest player?
China is considered the largest player in the air conditioning market, primarily due to its massive manufacturing and export capacity, making it the world's largest producer of AC units. However, North America (led by the US) often retains a dominant position in terms of revenue share for high-tech, centralized, and advanced smart AC system adoption.
List of Figures
Figure 1: Global Air Conditioning Health Comfort Customization Market Revenue Breakdown (USD Billion, %) by Region, 2022 & 2029
Figure 2: Global Air Conditioning Health Comfort Customization Market Value Share (%), By Segment 1, 2022 & 2029
Figure 3: Global Air Conditioning Health Comfort Customization Market Forecast (USD Billion), by Sub-Segment 1, 2018-2029
Figure 4: Global Air Conditioning Health Comfort Customization Market Forecast (USD Billion), by Sub-Segment 2, 2018-2029
Figure 5: Global Air Conditioning Health Comfort Customization Market Value Share (%), By Segment 2, 2022 & 2029
Figure 6: Global Air Conditioning Health Comfort Customization Market Forecast (USD Billion), by Sub-Segment 1, 2018-2029
Figure 7: Global Air Conditioning Health Comfort Customization Market Forecast (USD Billion), by Sub-Segment 2, 2018-2029
Figure 8: Global Air Conditioning Health Comfort Customization Market Forecast (USD Billion), by Sub-Segment 3, 2018-2029
Figure 9: Global Air Conditioning Health Comfort Customization Market Forecast (USD Billion), by Others, 2018-2029
Figure 10: Global Air Conditioning Health Comfort Customization Market Value Share (%), By Segment 3, 2022 & 2029
Figure 11: Global Air Conditioning Health Comfort Customization Market Forecast (USD Billion), by Sub-Segment 1, 2018-2029
Figure 12: Global Air Conditioning Health Comfort Customization Market Forecast (USD Billion), by Sub-Segment 2, 2018-2029
Figure 13: Global Air Conditioning Health Comfort Customization Market Forecast (USD Billion), by Sub-Segment 3, 2018-2029
Figure 14: Global Air Conditioning Health Comfort Customization Market Forecast (USD Billion), by Others, 2018-2029
Figure 15: Global Air Conditioning Health Comfort Customization Market Value (USD Billion), by Region, 2022 & 2029
Figure 16: North America Air Conditioning Health Comfort Customization Market Value Share (%), By Segment 1, 2022 & 2029
Figure 17: North America Air Conditioning Health Comfort Customization Market Forecast (USD Billion), by Sub-Segment 1, 2018-2029
Figure 18: North America Air Conditioning Health Comfort Customization Market Forecast (USD Billion), by Sub-Segment 2, 2018-2029
Figure 19: North America Air Conditioning Health Comfort Customization Market Value Share (%), By Segment 2, 2022 & 2029
Figure 20: North America Air Conditioning Health Comfort Customization Market Forecast (USD Billion), by Sub-Segment 1, 2018-2029
Figure 21: North America Air Conditioning Health Comfort Customization Market Forecast (USD Billion), by Sub-Segment 2, 2018-2029
Figure 22: North America Air Conditioning Health Comfort Customization Market Forecast (USD Billion), by Sub-Segment 3, 2018-2029
Figure 23: North America Air Conditioning Health Comfort Customization Market Forecast (USD Billion), by Others, 2018-2029
Figure 24: North America Air Conditioning Health Comfort Customization Market Value Share (%), By Segment 3, 2022 & 2029
Figure 25: North America Air Conditioning Health Comfort Customization Market Forecast (USD Billion), by Sub-Segment 1, 2018-2029
Figure 26: North America Air Conditioning Health Comfort Customization Market Forecast (USD Billion), by Sub-Segment 2, 2018-2029
Figure 27: North America Air Conditioning Health Comfort Customization Market Forecast (USD Billion), by Sub-Segment 3, 2018-2029
Figure 28: North America Air Conditioning Health Comfort Customization Market Forecast (USD Billion), by Others, 2018-2029
Figure 29: North America Air Conditioning Health Comfort Customization Market Forecast (USD Billion), by U.S., 2018-2029
Figure 30: North America Air Conditioning Health Comfort Customization Market Forecast (USD Billion), by Canada, 2018-2029
Figure 31: Latin America Air Conditioning Health Comfort Customization Market Value Share (%), By Segment 1, 2022 & 2029
Figure 32: Latin America Air Conditioning Health Comfort Customization Market Forecast (USD Billion), by Sub-Segment 1, 2018-2029
Figure 33: Latin America Air Conditioning Health Comfort Customization Market Forecast (USD Billion), by Sub-Segment 2, 2018-2029
Figure 34: Latin America Air Conditioning Health Comfort Customization Market Value Share (%), By Segment 2, 2022 & 2029
Figure 35: Latin America Air Conditioning Health Comfort Customization Market Forecast (USD Billion), by Sub-Segment 1, 2018-2029
Figure 36: Latin America Air Conditioning Health Comfort Customization Market Forecast (USD Billion), by Sub-Segment 2, 2018-2029
Figure 37: Latin America Air Conditioning Health Comfort Customization Market Forecast (USD Billion), by Sub-Segment 3, 2018-2029
Figure 38: Latin America Air Conditioning Health Comfort Customization Market Forecast (USD Billion), by Others, 2018-2029
Figure 39: Latin America Air Conditioning Health Comfort Customization Market Value Share (%), By Segment 3, 2022 & 2029
Figure 40: Latin America Air Conditioning Health Comfort Customization Market Forecast (USD Billion), by Sub-Segment 1, 2018-2029
Figure 41: Latin America Air Conditioning Health Comfort Customization Market Forecast (USD Billion), by Sub-Segment 2, 2018-2029
Figure 42: Latin America Air Conditioning Health Comfort Customization Market Forecast (USD Billion), by Sub-Segment 3, 2018-2029
Figure 43: Latin America Air Conditioning Health Comfort Customization Market Forecast (USD Billion), by Others, 2018-2029
Figure 44: Latin America Air Conditioning Health Comfort Customization Market Forecast (USD Billion), by Brazil, 2018-2029
Figure 45: Latin America Air Conditioning Health Comfort Customization Market Forecast (USD Billion), by Mexico, 2018-2029
Figure 46: Latin America Air Conditioning Health Comfort Customization Market Forecast (USD Billion), by Rest of Latin America, 2018-2029
Figure 47: Europe Air Conditioning Health Comfort Customization Market Value Share (%), By Segment 1, 2022 & 2029
Figure 48: Europe Air Conditioning Health Comfort Customization Market Forecast (USD Billion), by Sub-Segment 1, 2018-2029
Figure 49: Europe Air Conditioning Health Comfort Customization Market Forecast (USD Billion), by Sub-Segment 2, 2018-2029
Figure 50: Europe Air Conditioning Health Comfort Customization Market Value Share (%), By Segment 2, 2022 & 2029
Figure 51: Europe Air Conditioning Health Comfort Customization Market Forecast (USD Billion), by Sub-Segment 1, 2018-2029
Figure 52: Europe Air Conditioning Health Comfort Customization Market Forecast (USD Billion), by Sub-Segment 2, 2018-2029
Figure 53: Europe Air Conditioning Health Comfort Customization Market Forecast (USD Billion), by Sub-Segment 3, 2018-2029
Figure 54: Europe Air Conditioning Health Comfort Customization Market Forecast (USD Billion), by Others, 2018-2029
Figure 55: Europe Air Conditioning Health Comfort Customization Market Value Share (%), By Segment 3, 2022 & 2029
Figure 56: Europe Air Conditioning Health Comfort Customization Market Forecast (USD Billion), by Sub-Segment 1, 2018-2029
Figure 57: Europe Air Conditioning Health Comfort Customization Market Forecast (USD Billion), by Sub-Segment 2, 2018-2029
Figure 58: Europe Air Conditioning Health Comfort Customization Market Forecast (USD Billion), by Sub-Segment 3, 2018-2029
Figure 59: Europe Air Conditioning Health Comfort Customization Market Forecast (USD Billion), by Others, 2018-2029
Figure 60: Europe Air Conditioning Health Comfort Customization Market Forecast (USD Billion), by U.K., 2018-2029
Figure 61: Europe Air Conditioning Health Comfort Customization Market Forecast (USD Billion), by Germany, 2018-2029
Figure 62: Europe Air Conditioning Health Comfort Customization Market Forecast (USD Billion), by France, 2018-2029
Figure 63: Europe Air Conditioning Health Comfort Customization Market Forecast (USD Billion), by Italy, 2018-2029
Figure 64: Europe Air Conditioning Health Comfort Customization Market Forecast (USD Billion), by Spain, 2018-2029
Figure 65: Europe Air Conditioning Health Comfort Customization Market Forecast (USD Billion), by Russia, 2018-2029
Figure 66: Europe Air Conditioning Health Comfort Customization Market Forecast (USD Billion), by Rest of Europe, 2018-2029
Figure 67: Asia Pacific Air Conditioning Health Comfort Customization Market Value Share (%), By Segment 1, 2022 & 2029
Figure 68: Asia Pacific Air Conditioning Health Comfort Customization Market Forecast (USD Billion), by Sub-Segment 1, 2018-2029
Figure 69: Asia Pacific Air Conditioning Health Comfort Customization Market Forecast (USD Billion), by Sub-Segment 2, 2018-2029
Figure 70: Asia Pacific Air Conditioning Health Comfort Customization Market Value Share (%), By Segment 2, 2022 & 2029
Figure 71: Asia Pacific Air Conditioning Health Comfort Customization Market Forecast (USD Billion), by Sub-Segment 1, 2018-2029
Figure 72: Asia Pacific Air Conditioning Health Comfort Customization Market Forecast (USD Billion), by Sub-Segment 2, 2018-2029
Figure 73: Asia Pacific Air Conditioning Health Comfort Customization Market Forecast (USD Billion), by Sub-Segment 3, 2018-2029
Figure 74: Asia Pacific Air Conditioning Health Comfort Customization Market Forecast (USD Billion), by Others, 2018-2029
Figure 75: Asia Pacific Air Conditioning Health Comfort Customization Market Value Share (%), By Segment 3, 2022 & 2029
Figure 76: Asia Pacific Air Conditioning Health Comfort Customization Market Forecast (USD Billion), by Sub-Segment 1, 2018-2029
Figure 77: Asia Pacific Air Conditioning Health Comfort Customization Market Forecast (USD Billion), by Sub-Segment 2, 2018-2029
Figure 78: Asia Pacific Air Conditioning Health Comfort Customization Market Forecast (USD Billion), by Sub-Segment 3, 2018-2029
Figure 79: Asia Pacific Air Conditioning Health Comfort Customization Market Forecast (USD Billion), by Others, 2018-2029
Figure 80: Asia Pacific Air Conditioning Health Comfort Customization Market Forecast (USD Billion), by China, 2018-2029
Figure 81: Asia Pacific Air Conditioning Health Comfort Customization Market Forecast (USD Billion), by India, 2018-2029
Figure 82: Asia Pacific Air Conditioning Health Comfort Customization Market Forecast (USD Billion), by Japan, 2018-2029
Figure 83: Asia Pacific Air Conditioning Health Comfort Customization Market Forecast (USD Billion), by Australia, 2018-2029
Figure 84: Asia Pacific Air Conditioning Health Comfort Customization Market Forecast (USD Billion), by Southeast Asia, 2018-2029
Figure 85: Asia Pacific Air Conditioning Health Comfort Customization Market Forecast (USD Billion), by Rest of Asia Pacific, 2018-2029
Figure 86: Middle East & Africa Air Conditioning Health Comfort Customization Market Value Share (%), By Segment 1, 2022 & 2029
Figure 87: Middle East & Africa Air Conditioning Health Comfort Customization Market Forecast (USD Billion), by Sub-Segment 1, 2018-2029
Figure 88: Middle East & Africa Air Conditioning Health Comfort Customization Market Forecast (USD Billion), by Sub-Segment 2, 2018-2029
Figure 89: Middle East & Africa Air Conditioning Health Comfort Customization Market Value Share (%), By Segment 2, 2022 & 2029
Figure 90: Middle East & Africa Air Conditioning Health Comfort Customization Market Forecast (USD Billion), by Sub-Segment 1, 2018-2029
Figure 91: Middle East & Africa Air Conditioning Health Comfort Customization Market Forecast (USD Billion), by Sub-Segment 2, 2018-2029
Figure 92: Middle East & Africa Air Conditioning Health Comfort Customization Market Forecast (USD Billion), by Sub-Segment 3, 2018-2029
Figure 93: Middle East & Africa Air Conditioning Health Comfort Customization Market Forecast (USD Billion), by Others, 2018-2029
Figure 94: Middle East & Africa Air Conditioning Health Comfort Customization Market Value Share (%), By Segment 3, 2022 & 2029
Figure 95: Middle East & Africa Air Conditioning Health Comfort Customization Market Forecast (USD Billion), by Sub-Segment 1, 2018-2029
Figure 96: Middle East & Africa Air Conditioning Health Comfort Customization Market Forecast (USD Billion), by Sub-Segment 2, 2018-2029
Figure 97: Middle East & Africa Air Conditioning Health Comfort Customization Market Forecast (USD Billion), by Sub-Segment 3, 2018-2029
Figure 98: Middle East & Africa Air Conditioning Health Comfort Customization Market Forecast (USD Billion), by Others, 2018-2029
Figure 99: Middle East & Africa Air Conditioning Health Comfort Customization Market Forecast (USD Billion), by GCC, 2018-2029
Figure 100: Middle East & Africa Air Conditioning Health Comfort Customization Market Forecast (USD Billion), by South Africa, 2018-2029
Figure 101: Middle East & Africa Air Conditioning Health Comfort Customization Market Forecast (USD Billion), by Rest of Middle East & Africa, 2018-2029
List of Tables
Table 1: Global Air Conditioning Health Comfort Customization Market Revenue (USD Billion) Forecast, by Segment 1, 2018-2029
Table 2: Global Air Conditioning Health Comfort Customization Market Revenue (USD Billion) Forecast, by Segment 2, 2018-2029
Table 3: Global Air Conditioning Health Comfort Customization Market Revenue (USD Billion) Forecast, by Segment 3, 2018-2029
Table 4: Global Air Conditioning Health Comfort Customization Market Revenue (USD Billion) Forecast, by Region, 2018-2029
Table 5: North America Air Conditioning Health Comfort Customization Market Revenue (USD Billion) Forecast, by Segment 1, 2018-2029
Table 6: North America Air Conditioning Health Comfort Customization Market Revenue (USD Billion) Forecast, by Segment 2, 2018-2029
Table 7: North America Air Conditioning Health Comfort Customization Market Revenue (USD Billion) Forecast, by Segment 3, 2018-2029
Table 8: North America Air Conditioning Health Comfort Customization Market Revenue (USD Billion) Forecast, by Country, 2018-2029
Table 9: Europe Air Conditioning Health Comfort Customization Market Revenue (USD Billion) Forecast, by Segment 1, 2018-2029
Table 10: Europe Air Conditioning Health Comfort Customization Market Revenue (USD Billion) Forecast, by Segment 2, 2018-2029
Table 11: Europe Air Conditioning Health Comfort Customization Market Revenue (USD Billion) Forecast, by Segment 3, 2018-2029
Table 12: Europe Air Conditioning Health Comfort Customization Market Revenue (USD Billion) Forecast, by Country, 2018-2029
Table 13: Latin America Air Conditioning Health Comfort Customization Market Revenue (USD Billion) Forecast, by Segment 1, 2018-2029
Table 14: Latin America Air Conditioning Health Comfort Customization Market Revenue (USD Billion) Forecast, by Segment 2, 2018-2029
Table 15: Latin America Air Conditioning Health Comfort Customization Market Revenue (USD Billion) Forecast, by Segment 3, 2018-2029
Table 16: Latin America Air Conditioning Health Comfort Customization Market Revenue (USD Billion) Forecast, by Country, 2018-2029
Table 17: Asia Pacific Air Conditioning Health Comfort Customization Market Revenue (USD Billion) Forecast, by Segment 1, 2018-2029
Table 18: Asia Pacific Air Conditioning Health Comfort Customization Market Revenue (USD Billion) Forecast, by Segment 2, 2018-2029
Table 19: Asia Pacific Air Conditioning Health Comfort Customization Market Revenue (USD Billion) Forecast, by Segment 3, 2018-2029
Table 20: Asia Pacific Air Conditioning Health Comfort Customization Market Revenue (USD Billion) Forecast, by Country, 2018-2029
Table 21: Middle East & Africa Air Conditioning Health Comfort Customization Market Revenue (USD Billion) Forecast, by Segment 1, 2018-2029
Table 22: Middle East & Africa Air Conditioning Health Comfort Customization Market Revenue (USD Billion) Forecast, by Segment 2, 2018-2029
Table 23: Middle East & Africa Air Conditioning Health Comfort Customization Market Revenue (USD Billion) Forecast, by Segment 3, 2018-2029
Table 24: Middle East & Africa Air Conditioning Health Comfort Customization Market Revenue (USD Billion) Forecast, by Country, 2018-2029
Research Process
Data Library Research are conducted by industry experts who offer insight on
industry structure, market segmentations technology assessment and competitive landscape (CL), and penetration, as well as on emerging trends. Their analysis is based on primary interviews (~ 80%) and secondary research (~ 20%) as well as years of professional expertise in their respective industries. Adding to this, by analysing historical trends and current market positions, our analysts predict where the market will be headed for the next five years. Furthermore, the varying trends of segment & categories geographically presented are also studied and the estimated based on the primary & secondary research.
In this particular report from the supply side Data Library Research has conducted primary surveys (interviews) with the key level executives (VP, CEO’s, Marketing Director, Business Development Manager
and SOFT) of the companies that active & prominent as well as the midsized organization
FIGURE 1: DLR RESEARH PROCESS
![research-methodology1]()
Primary Research
Extensive primary research was conducted to gain a deeper insight of the market and industry performance. The analysis is based on both primary and secondary research as well as years of professional expertise in the respective industries.
In addition to analysing current and historical trends, our analysts predict where the market is headed over the next five years.
It varies by segment for these categories geographically presented in the list of market tables. Speaking about this particular report we have conducted primary surveys (interviews) with the key level executives (VP, CEO’s, Marketing Director, Business Development Manager and many more) of the major players active in the market.
Secondary Research
Secondary research was mainly used to collect and identify information useful for the extensive, technical, market-oriented, and Friend’s study of the Global Extra Neutral Alcohol. It was also used to obtain key information about major players, market classification and segmentation according to the industry trends, geographical markets, and developments related to the market and technology perspectives. For this study, analysts have gathered information from various credible sources, such as annual reports, sec filings, journals, white papers, SOFT presentations, and company web sites.
Market Size Estimation
Both, top-down and bottom-up approaches were used to estimate and validate the size of the Global market and to estimate the size of various other dependent submarkets in the overall Extra Neutral Alcohol. The key players in the market were identified through secondary research and their market contributions in the respective geographies were determined through primary and secondary research.
Forecast Model
![research-methodology2]()