Souvenir Customization Service Market Overview and Analysis
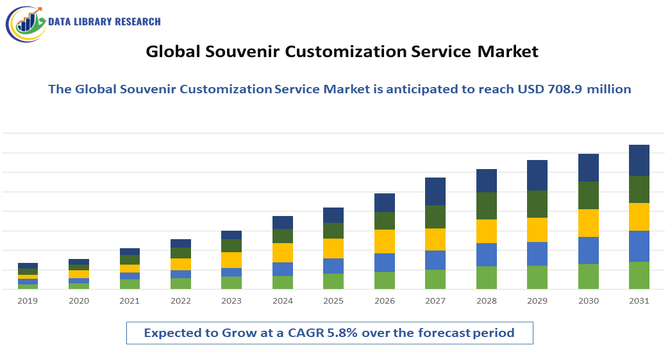
- The Global Souvenir Customization Service Market is currently valued at USD 421.9 million market in 2026, projected to grow at a 5.8% CAGR from 2026-2033, reaching USD 708.9 million in 2033.
Get Complete Analysis Of The Report - Download Updated Free Sample PDF
The Global Souvenir Customization Service Market refers to the worldwide industry where personalized keepsakes and gifts are designed, produced, and sold. This market includes services that allow travelers, tourists, and consumers to customize items—such as keychains, apparel, mugs, magnets, and photo products—based on individual preferences, images, text, or themes. Driven by tourism, e-commerce, and digital printing technologies, the market serves travelers seeking unique, memorable items and businesses looking for branded merchandise. Growth is supported by online platforms, social media trends, and demand for bespoke experiences.
Souvenir Customization Service Market Latest Trends
The global souvenir customization service market is expanding robustly, driven by widespread demand for personalized and unique memorabilia that reflect individual experiences. Travelers increasingly seek bespoke items such as customized apparel, keychains, mugs, and home décor that tell personal stories rather than generic souvenirs. Digital technologies like advanced printing, 3D printing, and online design platforms empower consumers with instant customization options, while e-commerce and mobile apps make these services widely accessible.
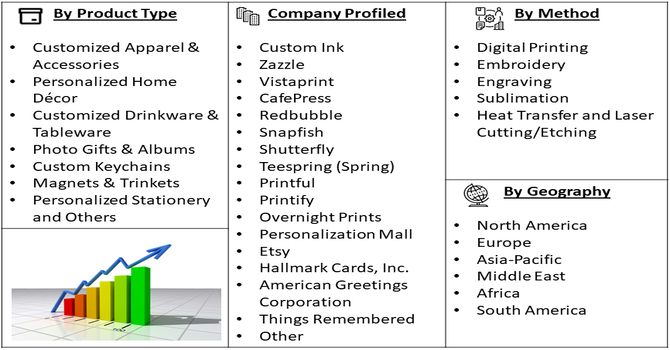
Segmentation: The Global Souvenir Customization Service Market is segmented by Product Type (Customized Apparel & Accessories, Personalized Home Décor, Customized Drinkware & Tableware, Photo Gifts & Albums, Custom Keychains, Magnets & Trinkets, Personalized Stationery and Others), Customization Method (Digital Printing, Embroidery, Engraving, Sublimation, Heat Transfer and Laser Cutting/Etching), Sales Channel (Online (E-commerce Platforms) and Offline (Brick-and-Mortar Retail)), and Geography (North America, Europe, Asia-Pacific, Middle East and Africa, and South America). The report provides the value (in USD million) for the above segments.
For Detailed Market Segmentation - Get a Free Sample PDF
Market Drivers:
- Rising Demand for Personalized and Experiential Gifts
The key drivers of the global souvenir customization service market is the growing consumer preference for personalized and experience-driven gifts. Modern consumers increasingly value emotional connection, individuality, and storytelling in products, especially souvenirs linked to travel, celebrations, and special moments. Customized items such as photo gifts, engraved keepsakes, and location-based memorabilia allow buyers to preserve memories in a unique and meaningful way. The shift away from mass-produced souvenirs toward bespoke products has been accelerated by social media influence and gift-giving trends. This demand encourages service providers to expand offerings, adopt new technologies, and deliver highly tailored souvenir solutions.
- Technological Advancements and E-commerce Growth
The advancements in digital printing, laser engraving, 3D printing, and online design tools have significantly fueled the growth of the souvenir customization service market. These technologies enable faster production, improved quality, and cost-effective customization even for small order volumes.
Simultaneously, the expansion of e-commerce platforms and mobile applications has made personalized souvenir services easily accessible to a global customer base. For instance, in September 2025, IGP’s 30-minute personalized gift delivery across 30 cities showcased significant technological advancements and e-commerce growth in the global souvenir customization market. By localizing production and using specialized personalization machines in dark stores, IGP enhanced fulfillment speed and efficiency. This innovation set new standards for rapid customization and delivery, driving customer expectations and accelerating market expansion worldwide.
Market Restraints
- High Costs and Operational Complexities
Despite strong growth potential, the global souvenir customization service market faces restraints related to high operational costs and production complexities. Customized products often require specialized equipment, skilled labor, and flexible manufacturing processes, increasing overall expenses compared to mass-produced items. Small and medium-sized businesses may struggle with investment in advanced customization technologies and inventory management. Additionally, managing short turnaround times, quality consistency, and logistics—especially for international orders—poses challenges.
Socioeconomic Impact on Souvenir Customization Service Market
The souvenir customization market influences both local economies and broader socioeconomic patterns. It supports tourism by enhancing visitor spending on personalized keepsakes, which contributes to revenue for local retailers and artisans. As tourism rebounds globally, demand for culturally relevant custom products helps preserve local crafts and traditions, increasing community engagement and employment. E-commerce expansion also creates digital entrepreneurship opportunities, enabling small vendors to reach global audiences. Eco-friendly product demand fosters sustainable business practices, reducing environmental impact. Moreover, rising middle-class incomes in developing regions drive discretionary purchases of customized items, stimulating consumption and boosting related industries such as printing technology services and logistics.
Segmental Analysis:
- Personalized Home Décor segment is expected to witness highest growth over the forecast period
The personalized home décor segment is expected to witness the highest growth over the forecast period due to increasing consumer preference for unique, customizable items that enhance personal living spaces. Products such as customized wall art, cushions, photo frames, and decorative pieces allow individuals to express their style and preserve memories. Growing urbanization, rising disposable incomes, and a shift toward experiential home personalization are driving demand. Additionally, social media influence encourages consumers to showcase distinctive home interiors. Suppliers are expanding offerings with innovative designs and eco-friendly materials, further boosting market adoption in both domestic and gifting contexts.
- Digital Printing segment is expected to witness highest growth over the forecast period
The digital printing segment is projected to lead the market over the forecast period as it offers cost-effective, high-quality, and versatile customization solutions. Digital printing enables precise designs, faster turnaround times, and the ability to produce low-volume orders efficiently. The technology supports a wide range of materials, including textiles, ceramics, metals, and plastics, making it ideal for souvenirs and personalized gifts. Increasing adoption by small and medium enterprises, coupled with advancements like AI-assisted design and high-resolution printers, is accelerating growth. Consumer demand for vibrant, detailed, and personalized products further drives the expansion of digital printing applications in the souvenir market.
- Online (E-commerce Platforms) segment is expected to witness highest growth over the forecast period
The online segment, primarily through e-commerce platforms, is anticipated to experience the highest growth during the forecast period. Consumers increasingly prefer the convenience of browsing, customizing, and ordering personalized souvenirs from the comfort of their homes. E-commerce platforms offer a wide product variety, instant customization previews, secure payment options, and reliable delivery services, enhancing the customer experience. The rise of mobile shopping, social media marketing, and global shipping solutions has further expanded the reach of online personalized gifts. Companies leveraging online platforms can efficiently target both individual and corporate customers, driving significant market growth in the digital era.
- North America Region is expected to witness highest growth over the forecast period
North America is expected to witness the highest growth in the global souvenir customization service market over the forecast period. The region’s growth is fueled by strong tourism activity, high disposable incomes, and a growing preference for personalized and meaningful gifts. For instance, In December 2025, Printshop4me announced its expansion in the personalized gifting market across the United States and Canada, driven by rising demand for meaningful, customized gifts. The company expanded its reach with a range of custom-made products, emphasizing its commitment to helping customers create gifts that preserve memories and celebrate personal connections.
Advanced technology adoption, widespread e-commerce penetration, and awareness of experiential gifting trends further support market expansion. Consumers in the U.S. and Canada increasingly seek custom home décor, apparel, and keepsakes, while businesses leverage personalized products for corporate gifting. The presence of key market players, coupled with supportive logistics and digital infrastructure, positions North America as a leading growth region in this sector.
| Report Matrics |
Details |
| Market Size Value |
USD 708.9 million |
| Growth Rate |
CAGR of 5.8 % |
| Forecast |
2026-2033 |
| Historical data |
2021-2024 |
| Base Year |
2025 |
| Report Coverage |
Forecasted revenue, company rating, competitive environment, growth drivers, and trends |
| Segment Coverage |
Type, Application, End-User, Geography |
| Regional Scope |
North America, Europe, Asia Pacific, Middle East |
| Customized scope |
Free customization of reports (With 3 months Analysis Support ) |
| To Learn More About This Report |
Request a Free Sample Copy |
Souvenir Customization Service Market Competitive Landscape
The competitive landscape of the global souvenir customization service market comprises both established brands and agile digital platforms. Key players include online customization services and print-on-demand firms that offer wide product portfolios and intuitive design tools. Partnerships with e-commerce platforms and strategic expansions help firms capture international demand and diversify offerings. Local artisan collaborations and sustainable product lines are used as differentiators to appeal to niche segments. Competition also centers on pricing, rapid fulfillment, and technology integration. Market share is fragmented, with major players balancing brand recognition and personal service, while new entrants focus on online visibility, social media marketing, and unique cultural products to attract customers.
The major players for above market are:
- Custom Ink
- Zazzle
- Vistaprint
- CafePress
- Redbubble
- Snapfish
- Shutterfly
- Teespring (Spring)
- Printful
- Printify
- Overnight Prints
- Personalization Mall
- Etsy
- Hallmark Cards, Inc.
- American Greetings Corporation
- Things Remembered
- IGP (India)
- Archies Limited
- Moonpig Group PLC
- Not On The High Street
Recent Development
- In December 2025, FNP, had launched its New Year 2026 Collection, which featured a wide range of New Year gifts available online. The collection had included cakes, flowers, personalised gifts, plants, hampers, and gift combos, thoughtfully curated to celebrate fresh beginnings, meaningful relationships, and joyful moments across diverse tastes, occasions, and budgets.
- In October 2025, Merchlist’s launch in Qatar highlighted the growing adoption of specialized platforms and streamlined delivery solutions, reflecting broader efficiency-driven market trends. Similar innovations in service accessibility, customization, and rapid deployment influenced the Global Nuclear Medicine Management Software Market by emphasizing the importance of localized solutions, fast implementation, and tailored offerings to meet diverse organizational and patient-specific needs worldwide.
Frequently Asked Questions (FAQ) :
Q1. What are the main growth-driving factors for this market?
The resurgence of global tourism and a growing consumer preference for personalized, "one-of-a-kind" experiences are primary drivers. Advances in digital printing and 3D scanning allow for rapid, on-site customization. Furthermore, social media culture encourages travelers to seek unique, photogenic mementos that reflect individual identities rather than mass-produced items.
Q2. What are the main restraining factors for this market?
High production costs for small-batch custom items can limit market reach compared to traditional souvenirs. Intellectual property concerns regarding local cultural designs and trademarks also present legal hurdles. Additionally, economic fluctuations and reduced discretionary spending during inflation can lead tourists to prioritize travel essentials over high-end, personalized memorabilia.
Q3. Which segment is expected to witness high growth?
The Personalized Apparel and Accessories segment is expected to see the highest growth. Tourists increasingly favor wearable souvenirs like custom-engraved jewelry, bespoke t-shirts, and embroidered hats that serve a functional purpose. This trend is bolstered by "print-on-demand" services that allow travelers to design items digitally at kiosks.
Q4. Who are the top major players for this market?
Major players include global gifting giants and specialized platforms such as Vistaprint (Cimpress), Shutterfly, and Zazzle. On the experiential side, companies like Disney Parks Merchandise and Hard Rock Cafe dominate through localized customization. Many regional players also thrive by partnering with heritage sites to offer artisanal, bespoke goods.
Q5. Which country is the largest player?
The United States remains the largest player in this market. This dominance is attributed to a highly developed gifting culture, the presence of major theme park conglomerates, and the rapid adoption of e-commerce customization platforms. Strong domestic tourism and high consumer spending on personalized lifestyle products further solidify its position.
List of Figures
Figure 1: Global Souvenir Customization Service Market Revenue Breakdown (USD Billion, %) by Region, 2022 & 2029
Figure 2: Global Souvenir Customization Service Market Value Share (%), By Segment 1, 2022 & 2029
Figure 3: Global Souvenir Customization Service Market Forecast (USD Billion), by Sub-Segment 1, 2018-2029
Figure 4: Global Souvenir Customization Service Market Forecast (USD Billion), by Sub-Segment 2, 2018-2029
Figure 5: Global Souvenir Customization Service Market Value Share (%), By Segment 2, 2022 & 2029
Figure 6: Global Souvenir Customization Service Market Forecast (USD Billion), by Sub-Segment 1, 2018-2029
Figure 7: Global Souvenir Customization Service Market Forecast (USD Billion), by Sub-Segment 2, 2018-2029
Figure 8: Global Souvenir Customization Service Market Forecast (USD Billion), by Sub-Segment 3, 2018-2029
Figure 9: Global Souvenir Customization Service Market Forecast (USD Billion), by Others, 2018-2029
Figure 10: Global Souvenir Customization Service Market Value Share (%), By Segment 3, 2022 & 2029
Figure 11: Global Souvenir Customization Service Market Forecast (USD Billion), by Sub-Segment 1, 2018-2029
Figure 12: Global Souvenir Customization Service Market Forecast (USD Billion), by Sub-Segment 2, 2018-2029
Figure 13: Global Souvenir Customization Service Market Forecast (USD Billion), by Sub-Segment 3, 2018-2029
Figure 14: Global Souvenir Customization Service Market Forecast (USD Billion), by Others, 2018-2029
Figure 15: Global Souvenir Customization Service Market Value (USD Billion), by Region, 2022 & 2029
Figure 16: North America Souvenir Customization Service Market Value Share (%), By Segment 1, 2022 & 2029
Figure 17: North America Souvenir Customization Service Market Forecast (USD Billion), by Sub-Segment 1, 2018-2029
Figure 18: North America Souvenir Customization Service Market Forecast (USD Billion), by Sub-Segment 2, 2018-2029
Figure 19: North America Souvenir Customization Service Market Value Share (%), By Segment 2, 2022 & 2029
Figure 20: North America Souvenir Customization Service Market Forecast (USD Billion), by Sub-Segment 1, 2018-2029
Figure 21: North America Souvenir Customization Service Market Forecast (USD Billion), by Sub-Segment 2, 2018-2029
Figure 22: North America Souvenir Customization Service Market Forecast (USD Billion), by Sub-Segment 3, 2018-2029
Figure 23: North America Souvenir Customization Service Market Forecast (USD Billion), by Others, 2018-2029
Figure 24: North America Souvenir Customization Service Market Value Share (%), By Segment 3, 2022 & 2029
Figure 25: North America Souvenir Customization Service Market Forecast (USD Billion), by Sub-Segment 1, 2018-2029
Figure 26: North America Souvenir Customization Service Market Forecast (USD Billion), by Sub-Segment 2, 2018-2029
Figure 27: North America Souvenir Customization Service Market Forecast (USD Billion), by Sub-Segment 3, 2018-2029
Figure 28: North America Souvenir Customization Service Market Forecast (USD Billion), by Others, 2018-2029
Figure 29: North America Souvenir Customization Service Market Forecast (USD Billion), by U.S., 2018-2029
Figure 30: North America Souvenir Customization Service Market Forecast (USD Billion), by Canada, 2018-2029
Figure 31: Latin America Souvenir Customization Service Market Value Share (%), By Segment 1, 2022 & 2029
Figure 32: Latin America Souvenir Customization Service Market Forecast (USD Billion), by Sub-Segment 1, 2018-2029
Figure 33: Latin America Souvenir Customization Service Market Forecast (USD Billion), by Sub-Segment 2, 2018-2029
Figure 34: Latin America Souvenir Customization Service Market Value Share (%), By Segment 2, 2022 & 2029
Figure 35: Latin America Souvenir Customization Service Market Forecast (USD Billion), by Sub-Segment 1, 2018-2029
Figure 36: Latin America Souvenir Customization Service Market Forecast (USD Billion), by Sub-Segment 2, 2018-2029
Figure 37: Latin America Souvenir Customization Service Market Forecast (USD Billion), by Sub-Segment 3, 2018-2029
Figure 38: Latin America Souvenir Customization Service Market Forecast (USD Billion), by Others, 2018-2029
Figure 39: Latin America Souvenir Customization Service Market Value Share (%), By Segment 3, 2022 & 2029
Figure 40: Latin America Souvenir Customization Service Market Forecast (USD Billion), by Sub-Segment 1, 2018-2029
Figure 41: Latin America Souvenir Customization Service Market Forecast (USD Billion), by Sub-Segment 2, 2018-2029
Figure 42: Latin America Souvenir Customization Service Market Forecast (USD Billion), by Sub-Segment 3, 2018-2029
Figure 43: Latin America Souvenir Customization Service Market Forecast (USD Billion), by Others, 2018-2029
Figure 44: Latin America Souvenir Customization Service Market Forecast (USD Billion), by Brazil, 2018-2029
Figure 45: Latin America Souvenir Customization Service Market Forecast (USD Billion), by Mexico, 2018-2029
Figure 46: Latin America Souvenir Customization Service Market Forecast (USD Billion), by Rest of Latin America, 2018-2029
Figure 47: Europe Souvenir Customization Service Market Value Share (%), By Segment 1, 2022 & 2029
Figure 48: Europe Souvenir Customization Service Market Forecast (USD Billion), by Sub-Segment 1, 2018-2029
Figure 49: Europe Souvenir Customization Service Market Forecast (USD Billion), by Sub-Segment 2, 2018-2029
Figure 50: Europe Souvenir Customization Service Market Value Share (%), By Segment 2, 2022 & 2029
Figure 51: Europe Souvenir Customization Service Market Forecast (USD Billion), by Sub-Segment 1, 2018-2029
Figure 52: Europe Souvenir Customization Service Market Forecast (USD Billion), by Sub-Segment 2, 2018-2029
Figure 53: Europe Souvenir Customization Service Market Forecast (USD Billion), by Sub-Segment 3, 2018-2029
Figure 54: Europe Souvenir Customization Service Market Forecast (USD Billion), by Others, 2018-2029
Figure 55: Europe Souvenir Customization Service Market Value Share (%), By Segment 3, 2022 & 2029
Figure 56: Europe Souvenir Customization Service Market Forecast (USD Billion), by Sub-Segment 1, 2018-2029
Figure 57: Europe Souvenir Customization Service Market Forecast (USD Billion), by Sub-Segment 2, 2018-2029
Figure 58: Europe Souvenir Customization Service Market Forecast (USD Billion), by Sub-Segment 3, 2018-2029
Figure 59: Europe Souvenir Customization Service Market Forecast (USD Billion), by Others, 2018-2029
Figure 60: Europe Souvenir Customization Service Market Forecast (USD Billion), by U.K., 2018-2029
Figure 61: Europe Souvenir Customization Service Market Forecast (USD Billion), by Germany, 2018-2029
Figure 62: Europe Souvenir Customization Service Market Forecast (USD Billion), by France, 2018-2029
Figure 63: Europe Souvenir Customization Service Market Forecast (USD Billion), by Italy, 2018-2029
Figure 64: Europe Souvenir Customization Service Market Forecast (USD Billion), by Spain, 2018-2029
Figure 65: Europe Souvenir Customization Service Market Forecast (USD Billion), by Russia, 2018-2029
Figure 66: Europe Souvenir Customization Service Market Forecast (USD Billion), by Rest of Europe, 2018-2029
Figure 67: Asia Pacific Souvenir Customization Service Market Value Share (%), By Segment 1, 2022 & 2029
Figure 68: Asia Pacific Souvenir Customization Service Market Forecast (USD Billion), by Sub-Segment 1, 2018-2029
Figure 69: Asia Pacific Souvenir Customization Service Market Forecast (USD Billion), by Sub-Segment 2, 2018-2029
Figure 70: Asia Pacific Souvenir Customization Service Market Value Share (%), By Segment 2, 2022 & 2029
Figure 71: Asia Pacific Souvenir Customization Service Market Forecast (USD Billion), by Sub-Segment 1, 2018-2029
Figure 72: Asia Pacific Souvenir Customization Service Market Forecast (USD Billion), by Sub-Segment 2, 2018-2029
Figure 73: Asia Pacific Souvenir Customization Service Market Forecast (USD Billion), by Sub-Segment 3, 2018-2029
Figure 74: Asia Pacific Souvenir Customization Service Market Forecast (USD Billion), by Others, 2018-2029
Figure 75: Asia Pacific Souvenir Customization Service Market Value Share (%), By Segment 3, 2022 & 2029
Figure 76: Asia Pacific Souvenir Customization Service Market Forecast (USD Billion), by Sub-Segment 1, 2018-2029
Figure 77: Asia Pacific Souvenir Customization Service Market Forecast (USD Billion), by Sub-Segment 2, 2018-2029
Figure 78: Asia Pacific Souvenir Customization Service Market Forecast (USD Billion), by Sub-Segment 3, 2018-2029
Figure 79: Asia Pacific Souvenir Customization Service Market Forecast (USD Billion), by Others, 2018-2029
Figure 80: Asia Pacific Souvenir Customization Service Market Forecast (USD Billion), by China, 2018-2029
Figure 81: Asia Pacific Souvenir Customization Service Market Forecast (USD Billion), by India, 2018-2029
Figure 82: Asia Pacific Souvenir Customization Service Market Forecast (USD Billion), by Japan, 2018-2029
Figure 83: Asia Pacific Souvenir Customization Service Market Forecast (USD Billion), by Australia, 2018-2029
Figure 84: Asia Pacific Souvenir Customization Service Market Forecast (USD Billion), by Southeast Asia, 2018-2029
Figure 85: Asia Pacific Souvenir Customization Service Market Forecast (USD Billion), by Rest of Asia Pacific, 2018-2029
Figure 86: Middle East & Africa Souvenir Customization Service Market Value Share (%), By Segment 1, 2022 & 2029
Figure 87: Middle East & Africa Souvenir Customization Service Market Forecast (USD Billion), by Sub-Segment 1, 2018-2029
Figure 88: Middle East & Africa Souvenir Customization Service Market Forecast (USD Billion), by Sub-Segment 2, 2018-2029
Figure 89: Middle East & Africa Souvenir Customization Service Market Value Share (%), By Segment 2, 2022 & 2029
Figure 90: Middle East & Africa Souvenir Customization Service Market Forecast (USD Billion), by Sub-Segment 1, 2018-2029
Figure 91: Middle East & Africa Souvenir Customization Service Market Forecast (USD Billion), by Sub-Segment 2, 2018-2029
Figure 92: Middle East & Africa Souvenir Customization Service Market Forecast (USD Billion), by Sub-Segment 3, 2018-2029
Figure 93: Middle East & Africa Souvenir Customization Service Market Forecast (USD Billion), by Others, 2018-2029
Figure 94: Middle East & Africa Souvenir Customization Service Market Value Share (%), By Segment 3, 2022 & 2029
Figure 95: Middle East & Africa Souvenir Customization Service Market Forecast (USD Billion), by Sub-Segment 1, 2018-2029
Figure 96: Middle East & Africa Souvenir Customization Service Market Forecast (USD Billion), by Sub-Segment 2, 2018-2029
Figure 97: Middle East & Africa Souvenir Customization Service Market Forecast (USD Billion), by Sub-Segment 3, 2018-2029
Figure 98: Middle East & Africa Souvenir Customization Service Market Forecast (USD Billion), by Others, 2018-2029
Figure 99: Middle East & Africa Souvenir Customization Service Market Forecast (USD Billion), by GCC, 2018-2029
Figure 100: Middle East & Africa Souvenir Customization Service Market Forecast (USD Billion), by South Africa, 2018-2029
Figure 101: Middle East & Africa Souvenir Customization Service Market Forecast (USD Billion), by Rest of Middle East & Africa, 2018-2029
List of Tables
Table 1: Global Souvenir Customization Service Market Revenue (USD Billion) Forecast, by Segment 1, 2018-2029
Table 2: Global Souvenir Customization Service Market Revenue (USD Billion) Forecast, by Segment 2, 2018-2029
Table 3: Global Souvenir Customization Service Market Revenue (USD Billion) Forecast, by Segment 3, 2018-2029
Table 4: Global Souvenir Customization Service Market Revenue (USD Billion) Forecast, by Region, 2018-2029
Table 5: North America Souvenir Customization Service Market Revenue (USD Billion) Forecast, by Segment 1, 2018-2029
Table 6: North America Souvenir Customization Service Market Revenue (USD Billion) Forecast, by Segment 2, 2018-2029
Table 7: North America Souvenir Customization Service Market Revenue (USD Billion) Forecast, by Segment 3, 2018-2029
Table 8: North America Souvenir Customization Service Market Revenue (USD Billion) Forecast, by Country, 2018-2029
Table 9: Europe Souvenir Customization Service Market Revenue (USD Billion) Forecast, by Segment 1, 2018-2029
Table 10: Europe Souvenir Customization Service Market Revenue (USD Billion) Forecast, by Segment 2, 2018-2029
Table 11: Europe Souvenir Customization Service Market Revenue (USD Billion) Forecast, by Segment 3, 2018-2029
Table 12: Europe Souvenir Customization Service Market Revenue (USD Billion) Forecast, by Country, 2018-2029
Table 13: Latin America Souvenir Customization Service Market Revenue (USD Billion) Forecast, by Segment 1, 2018-2029
Table 14: Latin America Souvenir Customization Service Market Revenue (USD Billion) Forecast, by Segment 2, 2018-2029
Table 15: Latin America Souvenir Customization Service Market Revenue (USD Billion) Forecast, by Segment 3, 2018-2029
Table 16: Latin America Souvenir Customization Service Market Revenue (USD Billion) Forecast, by Country, 2018-2029
Table 17: Asia Pacific Souvenir Customization Service Market Revenue (USD Billion) Forecast, by Segment 1, 2018-2029
Table 18: Asia Pacific Souvenir Customization Service Market Revenue (USD Billion) Forecast, by Segment 2, 2018-2029
Table 19: Asia Pacific Souvenir Customization Service Market Revenue (USD Billion) Forecast, by Segment 3, 2018-2029
Table 20: Asia Pacific Souvenir Customization Service Market Revenue (USD Billion) Forecast, by Country, 2018-2029
Table 21: Middle East & Africa Souvenir Customization Service Market Revenue (USD Billion) Forecast, by Segment 1, 2018-2029
Table 22: Middle East & Africa Souvenir Customization Service Market Revenue (USD Billion) Forecast, by Segment 2, 2018-2029
Table 23: Middle East & Africa Souvenir Customization Service Market Revenue (USD Billion) Forecast, by Segment 3, 2018-2029
Table 24: Middle East & Africa Souvenir Customization Service Market Revenue (USD Billion) Forecast, by Country, 2018-2029
Research Process
Data Library Research are conducted by industry experts who offer insight on
industry structure, market segmentations technology assessment and competitive landscape (CL), and penetration, as well as on emerging trends. Their analysis is based on primary interviews (~ 80%) and secondary research (~ 20%) as well as years of professional expertise in their respective industries. Adding to this, by analysing historical trends and current market positions, our analysts predict where the market will be headed for the next five years. Furthermore, the varying trends of segment & categories geographically presented are also studied and the estimated based on the primary & secondary research.
In this particular report from the supply side Data Library Research has conducted primary surveys (interviews) with the key level executives (VP, CEO’s, Marketing Director, Business Development Manager
and SOFT) of the companies that active & prominent as well as the midsized organization
FIGURE 1: DLR RESEARH PROCESS
![research-methodology1]()
Primary Research
Extensive primary research was conducted to gain a deeper insight of the market and industry performance. The analysis is based on both primary and secondary research as well as years of professional expertise in the respective industries.
In addition to analysing current and historical trends, our analysts predict where the market is headed over the next five years.
It varies by segment for these categories geographically presented in the list of market tables. Speaking about this particular report we have conducted primary surveys (interviews) with the key level executives (VP, CEO’s, Marketing Director, Business Development Manager and many more) of the major players active in the market.
Secondary Research
Secondary research was mainly used to collect and identify information useful for the extensive, technical, market-oriented, and Friend’s study of the Global Extra Neutral Alcohol. It was also used to obtain key information about major players, market classification and segmentation according to the industry trends, geographical markets, and developments related to the market and technology perspectives. For this study, analysts have gathered information from various credible sources, such as annual reports, sec filings, journals, white papers, SOFT presentations, and company web sites.
Market Size Estimation
Both, top-down and bottom-up approaches were used to estimate and validate the size of the Global market and to estimate the size of various other dependent submarkets in the overall Extra Neutral Alcohol. The key players in the market were identified through secondary research and their market contributions in the respective geographies were determined through primary and secondary research.
Forecast Model
![research-methodology2]()