Dredging Consulting Service Market Overview and Analysis
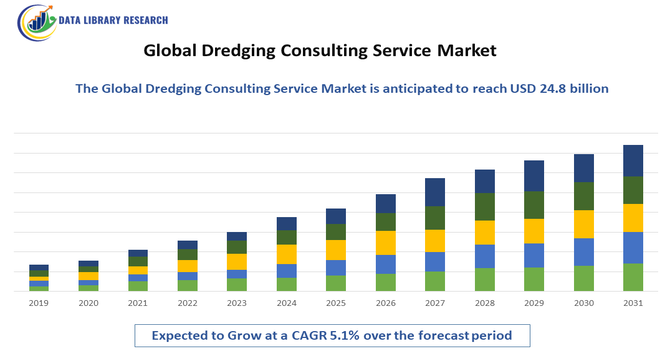
- The Global Dredging Consulting Service Market was worth USD 18.9 billion in 2025, and is predicted to grow to USD 24.8 billion by 2035, with a CAGR of 5.1% from 2025-2032.
Get Complete Analysis Of The Report - Download Updated Free Sample PDF
The Global Dredging Consulting Service Market refers to the worldwide industry that provides expert guidance, planning, engineering support, environmental assessments, and project management for dredging activities. These services help governments, ports, and private companies maintain waterways, expand harbors, manage coastal erosion, and ensure safe marine infrastructure development through specialized technical and regulatory expertise.
Rising global trade, the need for deeper navigation channels, and frequent siltation in waterways accelerate demand for expert dredging guidance. Additionally, climate change–related challenges such as coastal erosion, flooding, and rising sea levels require specialized environmental and engineering assessments, further strengthening the need for consulting services.
Dredging Consulting Service Market Latest Trends
The Global Dredging Consulting Service Market is shaped by increasing demand for sustainable and technology-driven marine infrastructure solutions. Clients are seeking advanced hydrographic surveying, digital modeling, and real-time project monitoring to improve accuracy and reduce costs. Environmental compliance has become a central trend, with consultants integrating eco-friendly dredging practices, sediment management strategies, and habitat protection measures.
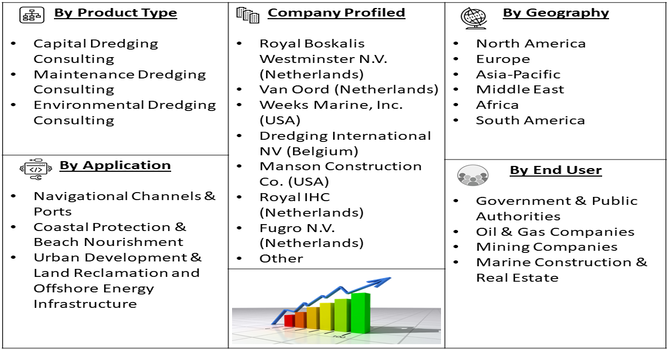
Segmentation: The Global Dredging Consulting Service Market is segmented by Type of Dredging (Capital Dredging Consulting, Maintenance Dredging Consulting and Environmental Dredging Consulting), End-User (Government & Public Authorities, Oil & Gas Companies, Mining Companies and Marine Construction & Real Estate), Application (Navigational Channels & Ports, Coastal Protection & Beach Nourishment, Urban Development & Land Reclamation and Offshore Energy Infrastructure), and Geography (North America, Europe, Asia-Pacific, Middle East and Africa, and South America). The report provides the value (in USD million) for the above segments.
For Detailed Market Segmentation - Get a Free Sample PDF
Market Drivers:
- Expansion of Coastal Infrastructure and Port Development
A key driver of the global dredging consulting service market is the steady growth of coastal infrastructure and port development projects worldwide. Many governments and private developers are investing in new ports, harbor expansions, and waterfront modernization to support rising trade volumes and urban coastal growth. These initiatives require expert consulting to ensure dredging activities are designed and executed safely, efficiently, and in compliance with regulatory standards. As global shipping routes expand and coastal populations increase, demand for strategic planning, risk assessment, and engineering guidance continues to rise, significantly boosting the need for professional dredging consulting services across multiple regions.
- Growing Emphasis on Environmental Compliance and Sustainable Waterway Management
Another major driver is the increasing focus on environmental protection and sustainable management of waterways. Heightened awareness of issues such as sedimentation, shoreline erosion, and ecological disturbance has led to stricter environmental regulations governing dredging operations. Project owners therefore rely on specialized consultants to conduct impact assessments, develop environmentally responsible dredging plans, and ensure compliance with complex legal frameworks. Additionally, climate change is contributing to more frequent flooding, siltation, and waterway blockages, creating ongoing demand for maintenance dredging. Consulting firms play a critical role in modeling hydrological conditions, evaluating ecosystem impacts, and advising on sustainable practices, further strengthening market growth.
Market Restraints:
- High Consulting Costs and Limited Availability of Specialized Expertise
A significant restraint affecting the global dredging consulting service market is the high cost associated with specialized expertise, technical studies, and regulatory documentation. Comprehensive environmental assessments, hydrological modeling, and engineering analyses can be expensive, posing challenges for smaller organizations or developing regions with limited budgets. These financial constraints may lead to project delays, reduced consulting engagements, or scaled-down dredging plans. Moreover, lengthy and complex approval procedures can slow project timelines, reducing the immediate need for consulting services. In some regions, a shortage of experienced dredging consultants further limits accessibility, affecting timely project execution and increasing overall operational burdens.
Socioeconomic Impact on Dredging Consulting Service Market
The dredging consulting sector plays a vital socioeconomic role by enabling safe navigation, efficient global trade, and resilient coastal infrastructure. By supporting port expansion and maintenance, these services help countries strengthen economic competitiveness and attract maritime investment. Coastal communities benefit from erosion control, flood mitigation, and improved climate resilience driven by professional dredging strategies. The market also generates employment for engineers, environmental scientists, surveyors, and marine technicians. In emerging economies, better-designed dredging projects enhance fisheries, tourism, and industrial development. Additionally, consulting-driven environmental safeguards help protect ecosystems, ensuring that development and economic growth occur responsibly and sustainably.
Segmental Analysis:
- Capital Dredging Consulting segment is expected to witness the highest growth over the forecast period
The capital dredging consulting segment is expected to witness the highest growth over the forecast period due to increasing investments in large-scale infrastructure and port expansion projects worldwide. Governments and private developers are prioritizing deepening and widening of waterways, constructing new terminals, and preparing coastal areas for industrial and commercial use. These complex, high-value projects require extensive feasibility studies, environmental assessments, and engineering expertise, driving strong demand for specialized consulting services. As global trade continues to expand and coastal urbanization accelerates, capital dredging projects will remain a strategic priority, securing robust and sustained growth for the consulting segment.
- Oil & Gas Companies segment is expected to witness the highest growth over the forecast period
The oil and gas companies segment is expected to experience the highest growth as offshore exploration, pipeline installation, and terminal expansion activities increase worldwide. These operations require precise seabed preparation, channel deepening, and continuous maintenance, making professional dredging consulting crucial for operational safety and regulatory compliance. Rising investment in LNG terminals, offshore drilling sites, and underwater infrastructure further strengthens demand for technical guidance. Consultants help oil and gas operators navigate environmental regulations, optimize project design, and manage sediment-related risks. With energy companies expanding into deeper waters and new regions, the need for specialized dredging advisory services is set to grow significantly.
- Navigational Channels & Ports segment is expected to witness the highest growth over the forecast period
The navigational channels and ports segment is projected to witness the highest growth, driven by expanding global trade and increasing vessel traffic. Ports around the world are upgrading their infrastructure to accommodate larger ships, enhance cargo handling efficiency, and ensure safe navigation. These improvements require continuous dredging, channel deepening, and sediment management, all of which depend on expert consulting support. Advisors provide essential guidance on engineering design, environmental compliance, and long-term maintenance strategies. As international shipping routes evolve and maritime logistics become more complex, the demand for consulting services in navigational channel and port development is expected to rise sharply.
- Asia-Pacific region is expected to witness the highest growth over the forecast period
The Asia-Pacific region is expected to record the highest growth over the forecast period due to rapid coastal development, expanding maritime trade, and large-scale port modernization initiatives. Countries such as China, India, Indonesia, and Vietnam are heavily investing in new port infrastructure, industrial waterfronts, and navigational channel upgrades.
The region’s strong economic growth and increasing container traffic further strengthen demand for dredging planning and advisory services. For instance, in November 2025, Dredging Corporation of India (DCI) released Q2 financial results showed a 6% increase in revenue to ₹2.12 billion. However, net loss widened to INR 342 million. EBITDA turned positive at INR 249 million, with an 11.78% margin. Total assets stood at INR 268,243.30 lakhs, with total equity at INR 115,805.78 lakhs. The company reported positive operating cash flow of INR 17,123.16 lakhs. DCI’s improved revenue, positive EBITDA, and strong operating cash flow strengthened confidence in regional dredging activity. Despite a wider net loss, its financial stability and asset base signaled continued project execution, which positively influenced demand for advisory expertise in the Asia-Pacific dredging consulting market, supporting future planning, feasibility, and compliance services.
Additionally, rising environmental concerns and stricter regional regulations require expert consulting to ensure responsible dredging practices. For instance, in January 2025, JICA’s loan agreement with Indonesia strengthened regional investment in coastal and port infrastructure. The financing spurred new dredging, waterway improvement, and maritime development projects, which increased demand for technical planning, environmental assessment, and regulatory guidance. This positively influenced the Asia-Pacific dredging consulting service market by expanding project pipelines and consulting opportunities. Thus, with ongoing urbanization and strategic marine development programs, Asia-Pacific will remain the fastest-growing market for dredging consulting services.
| Report Matrics |
Details |
| Market Size Value |
USD 24.8 billion |
| Growth Rate |
CAGR of 5.1 % |
| Forecast |
2026-2033 |
| Historical data |
2021-2024 |
| Base Year |
2025 |
| Report Coverage |
Forecasted revenue, company rating, competitive environment, growth drivers, and trends |
| Segment Coverage |
Type, Application, End-User, Geography |
| Regional Scope |
North America, Europe, Asia Pacific, Middle East |
| Customized scope |
Free customization of reports (With 3 months Analysis Support ) |
| To Learn More About This Report |
Request a Free Sample Copy |
Dredging Consulting Service Market Competitive Landscape
The competitive landscape of the Global Dredging Consulting Service Market is characterized by a mix of international engineering firms, specialized marine consultancies, and multidisciplinary environmental service providers. Companies compete through technical expertise, environmental proficiency, and advanced digital capabilities. Strong emphasis is placed on offering integrated solutions—from feasibility studies and regulatory approvals to design, monitoring, and project management. As environmental regulations tighten, consultants offering sustainable and compliant methodologies are gaining greater market share.
The major players for above market:
- Royal Boskalis Westminster N.V. (Netherlands)
- Van Oord (Netherlands)
- Jan De Nul Group (Belgium)
- DEME Group (Belgium)
- Great Lakes Dredge & Dock Corporation (USA)
- China Harbour Engineering Company Ltd. (China)
- National Marine Dredging Company (NMDC) (UAE)
- Penta-Ocean Construction Co., Ltd. (Japan)
- TOA Corporation (Japan)
- Hyundai Engineering & Construction Co., Ltd. (South Korea)
- Weeks Marine, Inc. (USA)
- Dredging International NV (Belgium)
- Manson Construction Co. (USA)
- Royal IHC (Netherlands)
- Fugro N.V. (Netherlands)
- China Communications Construction Company (CCCC) (China)
- Callan Marine Ltd. (UK)
- Saipem S.p.A. (Italy)
- Boskalis Offshore (Netherlands)
- Van Oord Offshore (Netherlands)
Recent Development
- September 2025, The U.S. Army Corps of Engineers’ Philadelphia District awarded Curtin Maritime Corp. a USD 10.8 million contract to complete maintenance dredging of Chesapeake Bay approach channels. About 500,000 yards of sediment were removed and transported to the Pearce Creek placement facility. Work, part of the C&D Canal navigation project, occurred from December 2025 to February 2026.
- In June 2025, BMT’s presentation of its next-generation AI-enabled dredging decision-intelligence tools at WODCON XXIV strengthened global awareness of advanced digital solutions in the dredging sector. The event’s focus on resilience encouraged wider adoption of data-driven planning, boosting demand for technology-oriented consulting services and accelerating innovation across the global dredging consulting service market.
Frequently Asked Questions (FAQ) :
Q1. What are the main growth-driving factors for this market?
Key growth factors include the expansion of global maritime trade and the need for deeper shipping channels to accommodate mega-vessels. Significant government investment in coastal protection, port infrastructure development, and land reclamation projects worldwide also strongly drives demand for consulting expertise.
Q2. What are the main restraining factors for this market?
The market faces restrictions primarily from stringent and complex environmental regulations and the high operational costs associated with specialized dredging equipment and fuel. Furthermore, the difficulty of securing environmental permits and a shortage of skilled labor can lead to project delays and financial limitations.
Q3. Which segment is expected to witness high growth?
The Capital Dredging segment, which involves creating new harbors and significantly deepening channels, is expected to see high growth. This is driven by massive infrastructure development and port expansion projects, especially in rapidly industrializing coastal regions, requiring extensive expert consultation from the planning stage.
Q4. Who are the top major players for this market?
The market is led by major international dredging and maritime contractors who often provide consulting as part of their services. Top players include Royal Boskalis Westminster, Jan De Nul Group, and the DEME Group. These companies leverage specialized fleet management and technological innovation.
Q5. Which country is the largest player?
The Asia Pacific region, particularly driven by China, holds the largest market share. This dominance stems from immense government-backed port development, extensive coastal infrastructure projects, and continuous maintenance dredging necessary to support the region's massive manufacturing and trade activities.
List of Figures
Figure 1: Global Dredging Consulting Service Market Revenue Breakdown (USD Billion, %) by Region, 2022 & 2029
Figure 2: Global Dredging Consulting Service Market Value Share (%), By Segment 1, 2022 & 2029
Figure 3: Global Dredging Consulting Service Market Forecast (USD Billion), by Sub-Segment 1, 2018-2029
Figure 4: Global Dredging Consulting Service Market Forecast (USD Billion), by Sub-Segment 2, 2018-2029
Figure 5: Global Dredging Consulting Service Market Value Share (%), By Segment 2, 2022 & 2029
Figure 6: Global Dredging Consulting Service Market Forecast (USD Billion), by Sub-Segment 1, 2018-2029
Figure 7: Global Dredging Consulting Service Market Forecast (USD Billion), by Sub-Segment 2, 2018-2029
Figure 8: Global Dredging Consulting Service Market Forecast (USD Billion), by Sub-Segment 3, 2018-2029
Figure 9: Global Dredging Consulting Service Market Forecast (USD Billion), by Others, 2018-2029
Figure 10: Global Dredging Consulting Service Market Value Share (%), By Segment 3, 2022 & 2029
Figure 11: Global Dredging Consulting Service Market Forecast (USD Billion), by Sub-Segment 1, 2018-2029
Figure 12: Global Dredging Consulting Service Market Forecast (USD Billion), by Sub-Segment 2, 2018-2029
Figure 13: Global Dredging Consulting Service Market Forecast (USD Billion), by Sub-Segment 3, 2018-2029
Figure 14: Global Dredging Consulting Service Market Forecast (USD Billion), by Others, 2018-2029
Figure 15: Global Dredging Consulting Service Market Value (USD Billion), by Region, 2022 & 2029
Figure 16: North America Dredging Consulting Service Market Value Share (%), By Segment 1, 2022 & 2029
Figure 17: North America Dredging Consulting Service Market Forecast (USD Billion), by Sub-Segment 1, 2018-2029
Figure 18: North America Dredging Consulting Service Market Forecast (USD Billion), by Sub-Segment 2, 2018-2029
Figure 19: North America Dredging Consulting Service Market Value Share (%), By Segment 2, 2022 & 2029
Figure 20: North America Dredging Consulting Service Market Forecast (USD Billion), by Sub-Segment 1, 2018-2029
Figure 21: North America Dredging Consulting Service Market Forecast (USD Billion), by Sub-Segment 2, 2018-2029
Figure 22: North America Dredging Consulting Service Market Forecast (USD Billion), by Sub-Segment 3, 2018-2029
Figure 23: North America Dredging Consulting Service Market Forecast (USD Billion), by Others, 2018-2029
Figure 24: North America Dredging Consulting Service Market Value Share (%), By Segment 3, 2022 & 2029
Figure 25: North America Dredging Consulting Service Market Forecast (USD Billion), by Sub-Segment 1, 2018-2029
Figure 26: North America Dredging Consulting Service Market Forecast (USD Billion), by Sub-Segment 2, 2018-2029
Figure 27: North America Dredging Consulting Service Market Forecast (USD Billion), by Sub-Segment 3, 2018-2029
Figure 28: North America Dredging Consulting Service Market Forecast (USD Billion), by Others, 2018-2029
Figure 29: North America Dredging Consulting Service Market Forecast (USD Billion), by U.S., 2018-2029
Figure 30: North America Dredging Consulting Service Market Forecast (USD Billion), by Canada, 2018-2029
Figure 31: Latin America Dredging Consulting Service Market Value Share (%), By Segment 1, 2022 & 2029
Figure 32: Latin America Dredging Consulting Service Market Forecast (USD Billion), by Sub-Segment 1, 2018-2029
Figure 33: Latin America Dredging Consulting Service Market Forecast (USD Billion), by Sub-Segment 2, 2018-2029
Figure 34: Latin America Dredging Consulting Service Market Value Share (%), By Segment 2, 2022 & 2029
Figure 35: Latin America Dredging Consulting Service Market Forecast (USD Billion), by Sub-Segment 1, 2018-2029
Figure 36: Latin America Dredging Consulting Service Market Forecast (USD Billion), by Sub-Segment 2, 2018-2029
Figure 37: Latin America Dredging Consulting Service Market Forecast (USD Billion), by Sub-Segment 3, 2018-2029
Figure 38: Latin America Dredging Consulting Service Market Forecast (USD Billion), by Others, 2018-2029
Figure 39: Latin America Dredging Consulting Service Market Value Share (%), By Segment 3, 2022 & 2029
Figure 40: Latin America Dredging Consulting Service Market Forecast (USD Billion), by Sub-Segment 1, 2018-2029
Figure 41: Latin America Dredging Consulting Service Market Forecast (USD Billion), by Sub-Segment 2, 2018-2029
Figure 42: Latin America Dredging Consulting Service Market Forecast (USD Billion), by Sub-Segment 3, 2018-2029
Figure 43: Latin America Dredging Consulting Service Market Forecast (USD Billion), by Others, 2018-2029
Figure 44: Latin America Dredging Consulting Service Market Forecast (USD Billion), by Brazil, 2018-2029
Figure 45: Latin America Dredging Consulting Service Market Forecast (USD Billion), by Mexico, 2018-2029
Figure 46: Latin America Dredging Consulting Service Market Forecast (USD Billion), by Rest of Latin America, 2018-2029
Figure 47: Europe Dredging Consulting Service Market Value Share (%), By Segment 1, 2022 & 2029
Figure 48: Europe Dredging Consulting Service Market Forecast (USD Billion), by Sub-Segment 1, 2018-2029
Figure 49: Europe Dredging Consulting Service Market Forecast (USD Billion), by Sub-Segment 2, 2018-2029
Figure 50: Europe Dredging Consulting Service Market Value Share (%), By Segment 2, 2022 & 2029
Figure 51: Europe Dredging Consulting Service Market Forecast (USD Billion), by Sub-Segment 1, 2018-2029
Figure 52: Europe Dredging Consulting Service Market Forecast (USD Billion), by Sub-Segment 2, 2018-2029
Figure 53: Europe Dredging Consulting Service Market Forecast (USD Billion), by Sub-Segment 3, 2018-2029
Figure 54: Europe Dredging Consulting Service Market Forecast (USD Billion), by Others, 2018-2029
Figure 55: Europe Dredging Consulting Service Market Value Share (%), By Segment 3, 2022 & 2029
Figure 56: Europe Dredging Consulting Service Market Forecast (USD Billion), by Sub-Segment 1, 2018-2029
Figure 57: Europe Dredging Consulting Service Market Forecast (USD Billion), by Sub-Segment 2, 2018-2029
Figure 58: Europe Dredging Consulting Service Market Forecast (USD Billion), by Sub-Segment 3, 2018-2029
Figure 59: Europe Dredging Consulting Service Market Forecast (USD Billion), by Others, 2018-2029
Figure 60: Europe Dredging Consulting Service Market Forecast (USD Billion), by U.K., 2018-2029
Figure 61: Europe Dredging Consulting Service Market Forecast (USD Billion), by Germany, 2018-2029
Figure 62: Europe Dredging Consulting Service Market Forecast (USD Billion), by France, 2018-2029
Figure 63: Europe Dredging Consulting Service Market Forecast (USD Billion), by Italy, 2018-2029
Figure 64: Europe Dredging Consulting Service Market Forecast (USD Billion), by Spain, 2018-2029
Figure 65: Europe Dredging Consulting Service Market Forecast (USD Billion), by Russia, 2018-2029
Figure 66: Europe Dredging Consulting Service Market Forecast (USD Billion), by Rest of Europe, 2018-2029
Figure 67: Asia Pacific Dredging Consulting Service Market Value Share (%), By Segment 1, 2022 & 2029
Figure 68: Asia Pacific Dredging Consulting Service Market Forecast (USD Billion), by Sub-Segment 1, 2018-2029
Figure 69: Asia Pacific Dredging Consulting Service Market Forecast (USD Billion), by Sub-Segment 2, 2018-2029
Figure 70: Asia Pacific Dredging Consulting Service Market Value Share (%), By Segment 2, 2022 & 2029
Figure 71: Asia Pacific Dredging Consulting Service Market Forecast (USD Billion), by Sub-Segment 1, 2018-2029
Figure 72: Asia Pacific Dredging Consulting Service Market Forecast (USD Billion), by Sub-Segment 2, 2018-2029
Figure 73: Asia Pacific Dredging Consulting Service Market Forecast (USD Billion), by Sub-Segment 3, 2018-2029
Figure 74: Asia Pacific Dredging Consulting Service Market Forecast (USD Billion), by Others, 2018-2029
Figure 75: Asia Pacific Dredging Consulting Service Market Value Share (%), By Segment 3, 2022 & 2029
Figure 76: Asia Pacific Dredging Consulting Service Market Forecast (USD Billion), by Sub-Segment 1, 2018-2029
Figure 77: Asia Pacific Dredging Consulting Service Market Forecast (USD Billion), by Sub-Segment 2, 2018-2029
Figure 78: Asia Pacific Dredging Consulting Service Market Forecast (USD Billion), by Sub-Segment 3, 2018-2029
Figure 79: Asia Pacific Dredging Consulting Service Market Forecast (USD Billion), by Others, 2018-2029
Figure 80: Asia Pacific Dredging Consulting Service Market Forecast (USD Billion), by China, 2018-2029
Figure 81: Asia Pacific Dredging Consulting Service Market Forecast (USD Billion), by India, 2018-2029
Figure 82: Asia Pacific Dredging Consulting Service Market Forecast (USD Billion), by Japan, 2018-2029
Figure 83: Asia Pacific Dredging Consulting Service Market Forecast (USD Billion), by Australia, 2018-2029
Figure 84: Asia Pacific Dredging Consulting Service Market Forecast (USD Billion), by Southeast Asia, 2018-2029
Figure 85: Asia Pacific Dredging Consulting Service Market Forecast (USD Billion), by Rest of Asia Pacific, 2018-2029
Figure 86: Middle East & Africa Dredging Consulting Service Market Value Share (%), By Segment 1, 2022 & 2029
Figure 87: Middle East & Africa Dredging Consulting Service Market Forecast (USD Billion), by Sub-Segment 1, 2018-2029
Figure 88: Middle East & Africa Dredging Consulting Service Market Forecast (USD Billion), by Sub-Segment 2, 2018-2029
Figure 89: Middle East & Africa Dredging Consulting Service Market Value Share (%), By Segment 2, 2022 & 2029
Figure 90: Middle East & Africa Dredging Consulting Service Market Forecast (USD Billion), by Sub-Segment 1, 2018-2029
Figure 91: Middle East & Africa Dredging Consulting Service Market Forecast (USD Billion), by Sub-Segment 2, 2018-2029
Figure 92: Middle East & Africa Dredging Consulting Service Market Forecast (USD Billion), by Sub-Segment 3, 2018-2029
Figure 93: Middle East & Africa Dredging Consulting Service Market Forecast (USD Billion), by Others, 2018-2029
Figure 94: Middle East & Africa Dredging Consulting Service Market Value Share (%), By Segment 3, 2022 & 2029
Figure 95: Middle East & Africa Dredging Consulting Service Market Forecast (USD Billion), by Sub-Segment 1, 2018-2029
Figure 96: Middle East & Africa Dredging Consulting Service Market Forecast (USD Billion), by Sub-Segment 2, 2018-2029
Figure 97: Middle East & Africa Dredging Consulting Service Market Forecast (USD Billion), by Sub-Segment 3, 2018-2029
Figure 98: Middle East & Africa Dredging Consulting Service Market Forecast (USD Billion), by Others, 2018-2029
Figure 99: Middle East & Africa Dredging Consulting Service Market Forecast (USD Billion), by GCC, 2018-2029
Figure 100: Middle East & Africa Dredging Consulting Service Market Forecast (USD Billion), by South Africa, 2018-2029
Figure 101: Middle East & Africa Dredging Consulting Service Market Forecast (USD Billion), by Rest of Middle East & Africa, 2018-2029
List of Tables
Table 1: Global Dredging Consulting Service Market Revenue (USD Billion) Forecast, by Segment 1, 2018-2029
Table 2: Global Dredging Consulting Service Market Revenue (USD Billion) Forecast, by Segment 2, 2018-2029
Table 3: Global Dredging Consulting Service Market Revenue (USD Billion) Forecast, by Segment 3, 2018-2029
Table 4: Global Dredging Consulting Service Market Revenue (USD Billion) Forecast, by Region, 2018-2029
Table 5: North America Dredging Consulting Service Market Revenue (USD Billion) Forecast, by Segment 1, 2018-2029
Table 6: North America Dredging Consulting Service Market Revenue (USD Billion) Forecast, by Segment 2, 2018-2029
Table 7: North America Dredging Consulting Service Market Revenue (USD Billion) Forecast, by Segment 3, 2018-2029
Table 8: North America Dredging Consulting Service Market Revenue (USD Billion) Forecast, by Country, 2018-2029
Table 9: Europe Dredging Consulting Service Market Revenue (USD Billion) Forecast, by Segment 1, 2018-2029
Table 10: Europe Dredging Consulting Service Market Revenue (USD Billion) Forecast, by Segment 2, 2018-2029
Table 11: Europe Dredging Consulting Service Market Revenue (USD Billion) Forecast, by Segment 3, 2018-2029
Table 12: Europe Dredging Consulting Service Market Revenue (USD Billion) Forecast, by Country, 2018-2029
Table 13: Latin America Dredging Consulting Service Market Revenue (USD Billion) Forecast, by Segment 1, 2018-2029
Table 14: Latin America Dredging Consulting Service Market Revenue (USD Billion) Forecast, by Segment 2, 2018-2029
Table 15: Latin America Dredging Consulting Service Market Revenue (USD Billion) Forecast, by Segment 3, 2018-2029
Table 16: Latin America Dredging Consulting Service Market Revenue (USD Billion) Forecast, by Country, 2018-2029
Table 17: Asia Pacific Dredging Consulting Service Market Revenue (USD Billion) Forecast, by Segment 1, 2018-2029
Table 18: Asia Pacific Dredging Consulting Service Market Revenue (USD Billion) Forecast, by Segment 2, 2018-2029
Table 19: Asia Pacific Dredging Consulting Service Market Revenue (USD Billion) Forecast, by Segment 3, 2018-2029
Table 20: Asia Pacific Dredging Consulting Service Market Revenue (USD Billion) Forecast, by Country, 2018-2029
Table 21: Middle East & Africa Dredging Consulting Service Market Revenue (USD Billion) Forecast, by Segment 1, 2018-2029
Table 22: Middle East & Africa Dredging Consulting Service Market Revenue (USD Billion) Forecast, by Segment 2, 2018-2029
Table 23: Middle East & Africa Dredging Consulting Service Market Revenue (USD Billion) Forecast, by Segment 3, 2018-2029
Table 24: Middle East & Africa Dredging Consulting Service Market Revenue (USD Billion) Forecast, by Country, 2018-2029
Research Process
Data Library Research are conducted by industry experts who offer insight on
industry structure, market segmentations technology assessment and competitive landscape (CL), and penetration, as well as on emerging trends. Their analysis is based on primary interviews (~ 80%) and secondary research (~ 20%) as well as years of professional expertise in their respective industries. Adding to this, by analysing historical trends and current market positions, our analysts predict where the market will be headed for the next five years. Furthermore, the varying trends of segment & categories geographically presented are also studied and the estimated based on the primary & secondary research.
In this particular report from the supply side Data Library Research has conducted primary surveys (interviews) with the key level executives (VP, CEO’s, Marketing Director, Business Development Manager
and SOFT) of the companies that active & prominent as well as the midsized organization
FIGURE 1: DLR RESEARH PROCESS
![research-methodology1]()
Primary Research
Extensive primary research was conducted to gain a deeper insight of the market and industry performance. The analysis is based on both primary and secondary research as well as years of professional expertise in the respective industries.
In addition to analysing current and historical trends, our analysts predict where the market is headed over the next five years.
It varies by segment for these categories geographically presented in the list of market tables. Speaking about this particular report we have conducted primary surveys (interviews) with the key level executives (VP, CEO’s, Marketing Director, Business Development Manager and many more) of the major players active in the market.
Secondary Research
Secondary research was mainly used to collect and identify information useful for the extensive, technical, market-oriented, and Friend’s study of the Global Extra Neutral Alcohol. It was also used to obtain key information about major players, market classification and segmentation according to the industry trends, geographical markets, and developments related to the market and technology perspectives. For this study, analysts have gathered information from various credible sources, such as annual reports, sec filings, journals, white papers, SOFT presentations, and company web sites.
Market Size Estimation
Both, top-down and bottom-up approaches were used to estimate and validate the size of the Global market and to estimate the size of various other dependent submarkets in the overall Extra Neutral Alcohol. The key players in the market were identified through secondary research and their market contributions in the respective geographies were determined through primary and secondary research.
Forecast Model
![research-methodology2]()