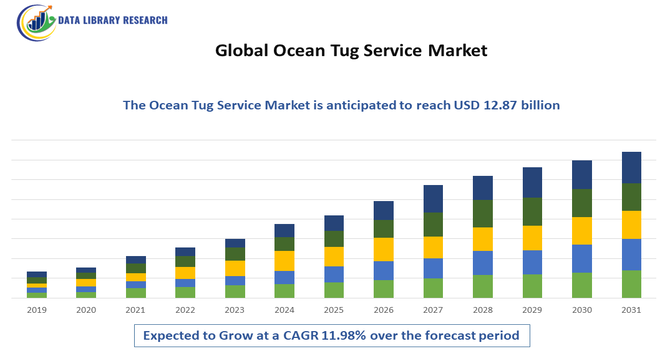
Ocean Tug Service Market Overview and Analysis:
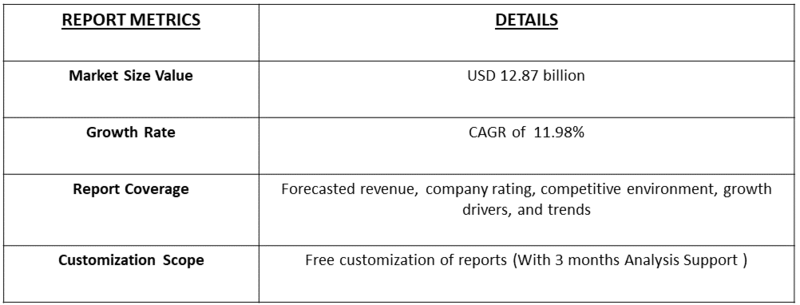
- The Global Ocean Tug Service Market size in 2025 is estimated at USD 4.25 billion, reaching USD 12.87 billion in 2032, growing with a CAGR of 11.98% from 2025-2032.
Get Complete Analysis Of The Report - Download Updated Free Sample PDF
The Global Ocean Tug Service Market refers to the industry providing specialized tugboat services that assist in maneuvering large vessels, such as container ships, oil tankers, and cruise ships, in ports, harbors, and through challenging sea routes. These services ensure safe navigation, docking, and undocking, reducing the risk of accidents. Growth is driven by increasing global maritime trade, larger vessel sizes, and stricter safety regulations in ports and shipping lanes.
The growth of the Global Ocean Tug Service Market is driven by the increasing volume of global maritime trade and the rising size of commercial vessels, which require specialized assistance for safe maneuvering. Strict port safety regulations and environmental guidelines have further boosted demand for reliable tug services. Additionally, the expansion of deep-water ports, offshore oil and gas operations, and growing cruise and container shipping industries have contributed significantly to market growth worldwide.
Ocean Tug Service Market Latest Trends:
The global ocean tug service market is increasingly shifting toward greener, more efficient tugboats, with many operators adopting hybrid, electric, or LNG propulsion systems to meet stricter environmental regulations. Automation and digitalization are also gaining momentum: towage firms are integrating remote-control systems, predictive maintenance, and real-time monitoring to optimize operations. Growing deep water and offshore activity, especially around renewable energy infrastructure, is pushing demand for powerful and specialized tug services.
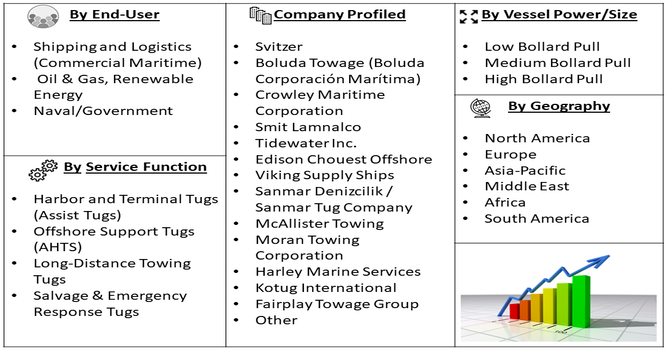
Segmentation: The Ocean Tug Service Market is segmented by Service Function (Harbor and Terminal Tugs (Assist Tugs), Offshore Support Tugs (AHTS), Long-Distance Towing Tugs, and Salvage & Emergency Response Tugs), Vessel Power/Size (Low Bollard Pull, Medium Bollard Pull and High Bollard Pull), End-User (Shipping and Logistics (Commercial Maritime), Oil & Gas, Renewable Energy and Naval/Government), and Geography (North America, Europe, Asia-Pacific, Middle East and Africa, and South America). The report provides the value (in USD million) for the above segments.
For Detailed Market Segmentation - Get a Free Sample PDF
Market Drivers:
- Growth in Global Maritime Trade
The growth of the global ocean tug service market is primarily driven by the increasing volume of global maritime trade. Expanding international shipping, particularly in container, bulk, and LNG segments, has resulted in the need for tugboats to assist in the safe docking, undocking, and maneuvering of larger vessels. With the rise of mega-ships, port congestion, and deeper drafts, tugs play a critical role in preventing accidents and ensuring efficient port operations. Furthermore, the expansion of offshore oil, gas, and renewable energy projects has increased demand for offshore support tugs capable of handling heavy loads, anchoring rigs, and providing emergency towing services, boosting market growth.
- Advancements in Tug Technology and Eco-Friendly Vessels
Technological advancements and the adoption of eco-friendly propulsion systems have emerged as a key growth driver. Modern tugboats are increasingly equipped with high bollard pull engines, hybrid-electric or LNG systems, and advanced navigation technologies, improving maneuverability, safety, and operational efficiency. Automation, remote control, and digital monitoring systems enable precise vessel handling, predictive maintenance, and fuel optimization. Environmental regulations are encouraging operators to adopt low-emission tugs, further driving market demand. The combination of performance, sustainability, and operational efficiency has made technologically advanced tug services indispensable in ports, offshore operations, and maritime logistics, reinforcing market expansion globally.
Market Restraints:
- High Operational and Maintenance Costs
The major restraint in the ocean tug service market is the high operational and maintenance costs associated with tug fleets. Building, maintaining, and upgrading high-capacity tugs, especially AHTS and high bollard pull vessels, requires substantial investment. Fuel, crew salaries, port fees, insurance, and regulatory compliance contribute to overall expenses. Small and mid-sized operators may face financial constraints, limiting fleet expansion or technological upgrades. Additionally, fluctuating fuel prices and maintenance requirements for sophisticated propulsion systems can impact profitability. These high costs can slow adoption, particularly in emerging markets or smaller ports, posing a challenge to the overall growth of the global ocean tug service market.
Socio Economic Impact on Ocean Tug Service Market
Ocean tug services play a critical role in global maritime trade by enabling the safe docking, undocking, and maneuvering of large vessels. This has a strong socioeconomic effect: tug fleets help prevent port accidents, reduce shipping delays, and support efficient logistics. The market also generates significant employment across shipyards, towage companies, and support services worldwide. With the rise of eco friendly tugboats, operations are becoming cleaner, which benefits both port communities and marine environments.
Segmental Analysis:
- Offshore Support Tugs (AHTS) segment is expected to witness highest growth over the forecast period
The Offshore Support Tugs (Anchor Handling Tug Supply, AHTS) segment is projected to witness the highest growth due to its critical role in offshore oil, gas, and renewable energy operations. These tugs are essential for anchoring rigs, towing vessels, and supporting subsea operations in deep waters. Increasing offshore exploration activities, particularly in emerging markets, have driven demand for high-capacity, technologically advanced AHTS vessels. Their versatility in handling heavy loads, assisting platform maintenance, and ensuring operational safety positions this segment as a key growth driver in the global ocean tug service market over the forecast period.
- High Bollard Pull segment is expected to witness highest growth over the forecast period
The high bollard pull tug segment is expected to experience the highest growth owing to the increasing size and draft of modern cargo and LNG carriers. High bollard pull tugs provide the necessary power to maneuver large vessels safely in ports and during offshore operations. Rising global trade, the expansion of container terminals, and the need for effective emergency towing services have elevated demand. These tugs’ capabilities in handling extreme loads, supporting oil and gas operations, and performing rescue or salvage missions contribute to their expanding market share and importance in global maritime logistics.
- Oil & Gas segment is expected to witness highest growth over the forecast period
The oil and gas sector is anticipated to lead growth in the ocean tug service market, driven by expanding offshore exploration and production activities worldwide. Tug services are essential for positioning rigs, transporting equipment, and ensuring operational safety in deepwater and remote locations. As oil and gas companies pursue exploration in challenging environments, demand for specialized tugs with high bollard pull, dynamic positioning, and advanced navigation systems rises. Additionally, environmental and safety regulations encourage the adoption of modern, eco-friendly tugs, further boosting the market within the oil and gas segment during the forecast period.
- Europe Region is expected to witness highest growth over the forecast period
Europe is expected to witness the highest growth in the global ocean tug service market due to its dense maritime trade networks, extensive port infrastructure, and robust offshore energy sector. The region’s focus on renewable energy, particularly offshore wind farms, drives demand for specialized tugs, including AHTS vessels. Strict environmental and safety regulations encourage the use of technologically advanced, fuel-efficient, and low-emission tugboats. Additionally, Europe’s investment in deepwater ports, maritime logistics, and fleet modernization supports growth, making it a key market for tug services, with continuous adoption of digital technologies, automation, and sustainable operations shaping the region’s market trajectory.
To Learn More About This Report - Request a Free Sample Copy
Ocean Tug Service Market Competitive Landscape:
The tug service market is competitive, featuring global providers, regional operators, and local towing firms. Major players include traditional towage companies that manage large, multinational operations and smaller niche operators focused on specific ports or offshore services. Competition is intensifying around fuel efficiency, eco-friendly propulsion, and digital towage capabilities. Some firms invest heavily in hybrid and electric tug design, while others forge alliances with shipbuilders to develop next generation, low-emission tugs. The fragmentation also allows for innovation from new entrants focused on green technologies and automation.
The major players for above market are:
- Svitzer
- Boluda Towage (Boluda Corporación Marítima)
- Crowley Maritime Corporation
- Smit Lamnalco
- Tidewater Inc.
- Edison Chouest Offshore
- Viking Supply Ships
- Sanmar Denizcilik / Sanmar Tug Company
- McAllister Towing
- Moran Towing Corporation
- Harley Marine Services
- Kotug International
- Fairplay Towage Group
- Multraship Towage
- Allseas Group
- Seacor Marine
- Esnaad
- BHP’s Port Towage Services
- Harbor Services (tug operator)
- ODC Marine
Recent Development
- In July 2025, The U.K. Royal Navy monitored a surfaced Russian submarine as it transited the North Sea and English Channel. HMS Mersey (P283), a Wildcat helicopter from 815 NAS, and a Merlin anti-submarine helicopter from 824 NAS were deployed to track Russian Navy submarine RFS Novorossiysk (B-61) and tug Yakov Grebelski. The operation reinforced the government’s commitment to protecting U.K. waters and national security under the Plan for Change initiative.
- In December 2024, Adani Ports and Special Economic Zone Ltd (APSEZ) procured eight advanced harbor tugs, all constructed by Cochin Shipyard Ltd. This initiative supported India’s Make in India and Aatmanirbhar Bharat programs, enhancing local manufacturing and maritime self-reliance. With a contract value of INR 450 Crore, the tugs were scheduled for delivery between December 2026 and May 2028, significantly improving efficiency, safety, and operational capabilities at Indian ports.
Frequently Asked Questions (FAQ) :
Q1. What are the main growth-driving factors for this market?
The primary driver is the expansion of global maritime trade, requiring more vessel assistance in busy ports and during long-distance transit. Growth is also fueled by the increasing size of container ships and oil tankers, which require high-horsepower tugs for safe maneuvering and harbor operations. Furthermore, stringent environmental and safety regulations mandate powerful standby salvage and emergency response capabilities.
Q2. What are the main restraining factors for this market?
A key constraint is the high capital investment required to build and maintain modern, high-specification ocean tugs and salvage vessels. The market also suffers from volatile fuel costs (bunkering), which directly impact operational expenses, and economic downturns that can slow down global shipping traffic. Additionally, maritime safety improvements slightly reduce the frequency of major salvage incidents.
Q3. Which segment is expected to witness high growth?
The Offshore Support and Energy Segment is projected to witness the highest growth. This is driven by the expansion of offshore wind farms and the continued maintenance of remote oil and gas platforms. These large-scale projects require specialized Anchor Handling Tug Supply (AHTS) vessels for moving rigs, laying pipelines, and providing reliable station-keeping, ensuring robust, high-value demand.
Q4. Who are the top major players for this market?
The market is dominated by large, international maritime service providers. Top major players include Boluda Corporación Marítima, Smit Lamnalco, Svitzer (part of Maersk), and Fairplay Towage Group. Competition centers on maintaining a young, versatile, and high-specification fleet, expanding global port coverage, and securing long-term contracts with major shipping lines and offshore energy companies for reliable, essential services.
Q5. Which country is the largest player?
The Netherlands is a major player, due to its centuries-long maritime tradition and the presence of dominant global players known for their expertise in complex towing and salvage operations. However, due to sheer volume and port activity, China is rapidly becoming the largest regional market by volume, driven by its massive port development and increasing naval fleet support requirements.
List of Figures
Figure 1: Global Ocean Tug Service Market Revenue Breakdown (USD Billion, %) by Region, 2022 & 2029
Figure 2: Global Ocean Tug Service Market Value Share (%), By Segment 1, 2022 & 2029
Figure 3: Global Ocean Tug Service Market Forecast (USD Billion), by Sub-Segment 1, 2018-2029
Figure 4: Global Ocean Tug Service Market Forecast (USD Billion), by Sub-Segment 2, 2018-2029
Figure 5: Global Ocean Tug Service Market Value Share (%), By Segment 2, 2022 & 2029
Figure 6: Global Ocean Tug Service Market Forecast (USD Billion), by Sub-Segment 1, 2018-2029
Figure 7: Global Ocean Tug Service Market Forecast (USD Billion), by Sub-Segment 2, 2018-2029
Figure 8: Global Ocean Tug Service Market Forecast (USD Billion), by Sub-Segment 3, 2018-2029
Figure 9: Global Ocean Tug Service Market Forecast (USD Billion), by Others, 2018-2029
Figure 10: Global Ocean Tug Service Market Value Share (%), By Segment 3, 2022 & 2029
Figure 11: Global Ocean Tug Service Market Forecast (USD Billion), by Sub-Segment 1, 2018-2029
Figure 12: Global Ocean Tug Service Market Forecast (USD Billion), by Sub-Segment 2, 2018-2029
Figure 13: Global Ocean Tug Service Market Forecast (USD Billion), by Sub-Segment 3, 2018-2029
Figure 14: Global Ocean Tug Service Market Forecast (USD Billion), by Others, 2018-2029
Figure 15: Global Ocean Tug Service Market Value (USD Billion), by Region, 2022 & 2029
Figure 16: North America Ocean Tug Service Market Value Share (%), By Segment 1, 2022 & 2029
Figure 17: North America Ocean Tug Service Market Forecast (USD Billion), by Sub-Segment 1, 2018-2029
Figure 18: North America Ocean Tug Service Market Forecast (USD Billion), by Sub-Segment 2, 2018-2029
Figure 19: North America Ocean Tug Service Market Value Share (%), By Segment 2, 2022 & 2029
Figure 20: North America Ocean Tug Service Market Forecast (USD Billion), by Sub-Segment 1, 2018-2029
Figure 21: North America Ocean Tug Service Market Forecast (USD Billion), by Sub-Segment 2, 2018-2029
Figure 22: North America Ocean Tug Service Market Forecast (USD Billion), by Sub-Segment 3, 2018-2029
Figure 23: North America Ocean Tug Service Market Forecast (USD Billion), by Others, 2018-2029
Figure 24: North America Ocean Tug Service Market Value Share (%), By Segment 3, 2022 & 2029
Figure 25: North America Ocean Tug Service Market Forecast (USD Billion), by Sub-Segment 1, 2018-2029
Figure 26: North America Ocean Tug Service Market Forecast (USD Billion), by Sub-Segment 2, 2018-2029
Figure 27: North America Ocean Tug Service Market Forecast (USD Billion), by Sub-Segment 3, 2018-2029
Figure 28: North America Ocean Tug Service Market Forecast (USD Billion), by Others, 2018-2029
Figure 29: North America Ocean Tug Service Market Forecast (USD Billion), by U.S., 2018-2029
Figure 30: North America Ocean Tug Service Market Forecast (USD Billion), by Canada, 2018-2029
Figure 31: Latin America Ocean Tug Service Market Value Share (%), By Segment 1, 2022 & 2029
Figure 32: Latin America Ocean Tug Service Market Forecast (USD Billion), by Sub-Segment 1, 2018-2029
Figure 33: Latin America Ocean Tug Service Market Forecast (USD Billion), by Sub-Segment 2, 2018-2029
Figure 34: Latin America Ocean Tug Service Market Value Share (%), By Segment 2, 2022 & 2029
Figure 35: Latin America Ocean Tug Service Market Forecast (USD Billion), by Sub-Segment 1, 2018-2029
Figure 36: Latin America Ocean Tug Service Market Forecast (USD Billion), by Sub-Segment 2, 2018-2029
Figure 37: Latin America Ocean Tug Service Market Forecast (USD Billion), by Sub-Segment 3, 2018-2029
Figure 38: Latin America Ocean Tug Service Market Forecast (USD Billion), by Others, 2018-2029
Figure 39: Latin America Ocean Tug Service Market Value Share (%), By Segment 3, 2022 & 2029
Figure 40: Latin America Ocean Tug Service Market Forecast (USD Billion), by Sub-Segment 1, 2018-2029
Figure 41: Latin America Ocean Tug Service Market Forecast (USD Billion), by Sub-Segment 2, 2018-2029
Figure 42: Latin America Ocean Tug Service Market Forecast (USD Billion), by Sub-Segment 3, 2018-2029
Figure 43: Latin America Ocean Tug Service Market Forecast (USD Billion), by Others, 2018-2029
Figure 44: Latin America Ocean Tug Service Market Forecast (USD Billion), by Brazil, 2018-2029
Figure 45: Latin America Ocean Tug Service Market Forecast (USD Billion), by Mexico, 2018-2029
Figure 46: Latin America Ocean Tug Service Market Forecast (USD Billion), by Rest of Latin America, 2018-2029
Figure 47: Europe Ocean Tug Service Market Value Share (%), By Segment 1, 2022 & 2029
Figure 48: Europe Ocean Tug Service Market Forecast (USD Billion), by Sub-Segment 1, 2018-2029
Figure 49: Europe Ocean Tug Service Market Forecast (USD Billion), by Sub-Segment 2, 2018-2029
Figure 50: Europe Ocean Tug Service Market Value Share (%), By Segment 2, 2022 & 2029
Figure 51: Europe Ocean Tug Service Market Forecast (USD Billion), by Sub-Segment 1, 2018-2029
Figure 52: Europe Ocean Tug Service Market Forecast (USD Billion), by Sub-Segment 2, 2018-2029
Figure 53: Europe Ocean Tug Service Market Forecast (USD Billion), by Sub-Segment 3, 2018-2029
Figure 54: Europe Ocean Tug Service Market Forecast (USD Billion), by Others, 2018-2029
Figure 55: Europe Ocean Tug Service Market Value Share (%), By Segment 3, 2022 & 2029
Figure 56: Europe Ocean Tug Service Market Forecast (USD Billion), by Sub-Segment 1, 2018-2029
Figure 57: Europe Ocean Tug Service Market Forecast (USD Billion), by Sub-Segment 2, 2018-2029
Figure 58: Europe Ocean Tug Service Market Forecast (USD Billion), by Sub-Segment 3, 2018-2029
Figure 59: Europe Ocean Tug Service Market Forecast (USD Billion), by Others, 2018-2029
Figure 60: Europe Ocean Tug Service Market Forecast (USD Billion), by U.K., 2018-2029
Figure 61: Europe Ocean Tug Service Market Forecast (USD Billion), by Germany, 2018-2029
Figure 62: Europe Ocean Tug Service Market Forecast (USD Billion), by France, 2018-2029
Figure 63: Europe Ocean Tug Service Market Forecast (USD Billion), by Italy, 2018-2029
Figure 64: Europe Ocean Tug Service Market Forecast (USD Billion), by Spain, 2018-2029
Figure 65: Europe Ocean Tug Service Market Forecast (USD Billion), by Russia, 2018-2029
Figure 66: Europe Ocean Tug Service Market Forecast (USD Billion), by Rest of Europe, 2018-2029
Figure 67: Asia Pacific Ocean Tug Service Market Value Share (%), By Segment 1, 2022 & 2029
Figure 68: Asia Pacific Ocean Tug Service Market Forecast (USD Billion), by Sub-Segment 1, 2018-2029
Figure 69: Asia Pacific Ocean Tug Service Market Forecast (USD Billion), by Sub-Segment 2, 2018-2029
Figure 70: Asia Pacific Ocean Tug Service Market Value Share (%), By Segment 2, 2022 & 2029
Figure 71: Asia Pacific Ocean Tug Service Market Forecast (USD Billion), by Sub-Segment 1, 2018-2029
Figure 72: Asia Pacific Ocean Tug Service Market Forecast (USD Billion), by Sub-Segment 2, 2018-2029
Figure 73: Asia Pacific Ocean Tug Service Market Forecast (USD Billion), by Sub-Segment 3, 2018-2029
Figure 74: Asia Pacific Ocean Tug Service Market Forecast (USD Billion), by Others, 2018-2029
Figure 75: Asia Pacific Ocean Tug Service Market Value Share (%), By Segment 3, 2022 & 2029
Figure 76: Asia Pacific Ocean Tug Service Market Forecast (USD Billion), by Sub-Segment 1, 2018-2029
Figure 77: Asia Pacific Ocean Tug Service Market Forecast (USD Billion), by Sub-Segment 2, 2018-2029
Figure 78: Asia Pacific Ocean Tug Service Market Forecast (USD Billion), by Sub-Segment 3, 2018-2029
Figure 79: Asia Pacific Ocean Tug Service Market Forecast (USD Billion), by Others, 2018-2029
Figure 80: Asia Pacific Ocean Tug Service Market Forecast (USD Billion), by China, 2018-2029
Figure 81: Asia Pacific Ocean Tug Service Market Forecast (USD Billion), by India, 2018-2029
Figure 82: Asia Pacific Ocean Tug Service Market Forecast (USD Billion), by Japan, 2018-2029
Figure 83: Asia Pacific Ocean Tug Service Market Forecast (USD Billion), by Australia, 2018-2029
Figure 84: Asia Pacific Ocean Tug Service Market Forecast (USD Billion), by Southeast Asia, 2018-2029
Figure 85: Asia Pacific Ocean Tug Service Market Forecast (USD Billion), by Rest of Asia Pacific, 2018-2029
Figure 86: Middle East & Africa Ocean Tug Service Market Value Share (%), By Segment 1, 2022 & 2029
Figure 87: Middle East & Africa Ocean Tug Service Market Forecast (USD Billion), by Sub-Segment 1, 2018-2029
Figure 88: Middle East & Africa Ocean Tug Service Market Forecast (USD Billion), by Sub-Segment 2, 2018-2029
Figure 89: Middle East & Africa Ocean Tug Service Market Value Share (%), By Segment 2, 2022 & 2029
Figure 90: Middle East & Africa Ocean Tug Service Market Forecast (USD Billion), by Sub-Segment 1, 2018-2029
Figure 91: Middle East & Africa Ocean Tug Service Market Forecast (USD Billion), by Sub-Segment 2, 2018-2029
Figure 92: Middle East & Africa Ocean Tug Service Market Forecast (USD Billion), by Sub-Segment 3, 2018-2029
Figure 93: Middle East & Africa Ocean Tug Service Market Forecast (USD Billion), by Others, 2018-2029
Figure 94: Middle East & Africa Ocean Tug Service Market Value Share (%), By Segment 3, 2022 & 2029
Figure 95: Middle East & Africa Ocean Tug Service Market Forecast (USD Billion), by Sub-Segment 1, 2018-2029
Figure 96: Middle East & Africa Ocean Tug Service Market Forecast (USD Billion), by Sub-Segment 2, 2018-2029
Figure 97: Middle East & Africa Ocean Tug Service Market Forecast (USD Billion), by Sub-Segment 3, 2018-2029
Figure 98: Middle East & Africa Ocean Tug Service Market Forecast (USD Billion), by Others, 2018-2029
Figure 99: Middle East & Africa Ocean Tug Service Market Forecast (USD Billion), by GCC, 2018-2029
Figure 100: Middle East & Africa Ocean Tug Service Market Forecast (USD Billion), by South Africa, 2018-2029
Figure 101: Middle East & Africa Ocean Tug Service Market Forecast (USD Billion), by Rest of Middle East & Africa, 2018-2029
List of Tables
Table 1: Global Ocean Tug Service Market Revenue (USD Billion) Forecast, by Segment 1, 2018-2029
Table 2: Global Ocean Tug Service Market Revenue (USD Billion) Forecast, by Segment 2, 2018-2029
Table 3: Global Ocean Tug Service Market Revenue (USD Billion) Forecast, by Segment 3, 2018-2029
Table 4: Global Ocean Tug Service Market Revenue (USD Billion) Forecast, by Region, 2018-2029
Table 5: North America Ocean Tug Service Market Revenue (USD Billion) Forecast, by Segment 1, 2018-2029
Table 6: North America Ocean Tug Service Market Revenue (USD Billion) Forecast, by Segment 2, 2018-2029
Table 7: North America Ocean Tug Service Market Revenue (USD Billion) Forecast, by Segment 3, 2018-2029
Table 8: North America Ocean Tug Service Market Revenue (USD Billion) Forecast, by Country, 2018-2029
Table 9: Europe Ocean Tug Service Market Revenue (USD Billion) Forecast, by Segment 1, 2018-2029
Table 10: Europe Ocean Tug Service Market Revenue (USD Billion) Forecast, by Segment 2, 2018-2029
Table 11: Europe Ocean Tug Service Market Revenue (USD Billion) Forecast, by Segment 3, 2018-2029
Table 12: Europe Ocean Tug Service Market Revenue (USD Billion) Forecast, by Country, 2018-2029
Table 13: Latin America Ocean Tug Service Market Revenue (USD Billion) Forecast, by Segment 1, 2018-2029
Table 14: Latin America Ocean Tug Service Market Revenue (USD Billion) Forecast, by Segment 2, 2018-2029
Table 15: Latin America Ocean Tug Service Market Revenue (USD Billion) Forecast, by Segment 3, 2018-2029
Table 16: Latin America Ocean Tug Service Market Revenue (USD Billion) Forecast, by Country, 2018-2029
Table 17: Asia Pacific Ocean Tug Service Market Revenue (USD Billion) Forecast, by Segment 1, 2018-2029
Table 18: Asia Pacific Ocean Tug Service Market Revenue (USD Billion) Forecast, by Segment 2, 2018-2029
Table 19: Asia Pacific Ocean Tug Service Market Revenue (USD Billion) Forecast, by Segment 3, 2018-2029
Table 20: Asia Pacific Ocean Tug Service Market Revenue (USD Billion) Forecast, by Country, 2018-2029
Table 21: Middle East & Africa Ocean Tug Service Market Revenue (USD Billion) Forecast, by Segment 1, 2018-2029
Table 22: Middle East & Africa Ocean Tug Service Market Revenue (USD Billion) Forecast, by Segment 2, 2018-2029
Table 23: Middle East & Africa Ocean Tug Service Market Revenue (USD Billion) Forecast, by Segment 3, 2018-2029
Table 24: Middle East & Africa Ocean Tug Service Market Revenue (USD Billion) Forecast, by Country, 2018-2029
Research Process
Data Library Research are conducted by industry experts who offer insight on
industry structure, market segmentations technology assessment and competitive landscape (CL), and penetration, as well as on emerging trends. Their analysis is based on primary interviews (~ 80%) and secondary research (~ 20%) as well as years of professional expertise in their respective industries. Adding to this, by analysing historical trends and current market positions, our analysts predict where the market will be headed for the next five years. Furthermore, the varying trends of segment & categories geographically presented are also studied and the estimated based on the primary & secondary research.
In this particular report from the supply side Data Library Research has conducted primary surveys (interviews) with the key level executives (VP, CEO’s, Marketing Director, Business Development Manager
and SOFT) of the companies that active & prominent as well as the midsized organization
FIGURE 1: DLR RESEARH PROCESS
![research-methodology1]()
Primary Research
Extensive primary research was conducted to gain a deeper insight of the market and industry performance. The analysis is based on both primary and secondary research as well as years of professional expertise in the respective industries.
In addition to analysing current and historical trends, our analysts predict where the market is headed over the next five years.
It varies by segment for these categories geographically presented in the list of market tables. Speaking about this particular report we have conducted primary surveys (interviews) with the key level executives (VP, CEO’s, Marketing Director, Business Development Manager and many more) of the major players active in the market.
Secondary Research
Secondary research was mainly used to collect and identify information useful for the extensive, technical, market-oriented, and Friend’s study of the Global Extra Neutral Alcohol. It was also used to obtain key information about major players, market classification and segmentation according to the industry trends, geographical markets, and developments related to the market and technology perspectives. For this study, analysts have gathered information from various credible sources, such as annual reports, sec filings, journals, white papers, SOFT presentations, and company web sites.
Market Size Estimation
Both, top-down and bottom-up approaches were used to estimate and validate the size of the Global market and to estimate the size of various other dependent submarkets in the overall Extra Neutral Alcohol. The key players in the market were identified through secondary research and their market contributions in the respective geographies were determined through primary and secondary research.
Forecast Model
![research-methodology2]()