Airport On-Ground Service Market Overview and Analysis
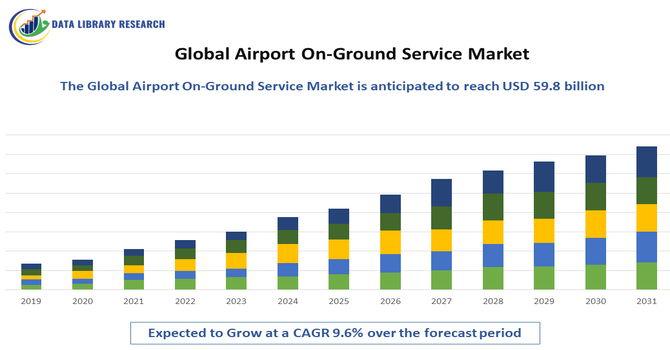
- The Global Airport On-Ground Services Market size was valued at USD 48.98 billion in 2025, and the market is projected to grow USD 59.8 billion in the year 2032, growing with a CAGR of 9.6% from 2025-2032.
Get Complete Analysis Of The Report - Download Updated Free Sample PDF
The Global Airport On-Ground Services Market is experiencing robust growth, driven primarily by the upsurge in global air travel, expansion of airport infrastructure, and rising investments in aviation services modernization. Growing passenger traffic, especially in emerging economies, is strengthening demand for efficient baggage handling, aircraft cleaning, ground support equipment, and passenger assistance services. Additionally, the rapid growth of low-cost carriers, increasing air cargo volume, and the rise of business and leisure tourism are driving airports to adopt advanced automation, robotics, and digital tracking for faster turnaround time and enhanced operational efficiency.
Airport On-Ground Service Market Latest Trends
The Global Airport On-Ground Services Market is witnessing major transformation driven by automation, sustainability, and digital innovation. Airports and ground-handling operators are increasingly adopting AI-enabled systems, self-service kiosks, biometrics, and automated baggage handling to enhance operational efficiency and reduce aircraft turnaround time. There is a strong shift toward electrification of ground support equipment (GSE) to meet environmental goals and minimize fuel costs, with electric baggage tractors, ground power units, and passenger buses becoming more common. Additionally, airports are investing in digital fleet management, telematics, and real-time monitoring platforms to optimize crew coordination, equipment utilization, and service delivery, especially as passenger and cargo volumes continue to rise.
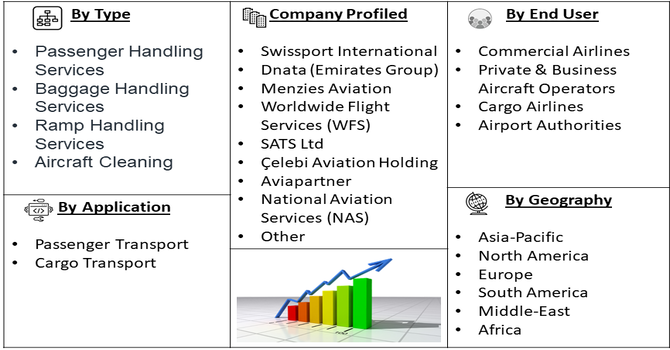
Segmentation: Global Airport On-Ground Services Market is segmented By Service Type (Passenger Handling Services, Baggage Handling Services, Ramp Handling Services, Aircraft Cleaning & Maintenance Services, Catering Services), End User (Commercial Airlines, Private & Business Aircraft Operators, Cargo Airlines, Airport Authorities), Application (Passenger Transport, Cargo Transport), and Geography (North America, Europe, Asia-Pacific, Middle East and Africa, and South America). The report provides the value (in USD million) for the above segments.
For Detailed Market Segmentation - Get a Free Sample PDF
Market Drivers
- Rising Global Air Passenger and Cargo Traffic
The rapid rebound and long-term growth of air travel and air cargo volumes are major growth drivers for airport on-ground services. Increasing international tourism, expansion of low-cost carriers, business travel recovery, and growth in e-commerce logistics are fueling demand for efficient baggage handling, catering, passenger assistance, and aircraft ramp services.
In July 2025, The Airports Authority of India (AAI) announced plans to onboard a new ground handling company at Chennai Airport within three months, following the exit of Çelebi Airport Services Pvt. Ltd. The airport, already served by AI Airport Services Limited and Bird Airport Services, enhanced market competitiveness, positively impacting the Global Airport On-Ground Services Market by driving operational efficiency and service diversification. As airports operate closer to capacity, the need for advanced ground-handling systems and skilled personnel is accelerating, supporting continuous market expansion.
- Expansion and Modernization of Airport Infrastructure
Large-scale investments in airport upgrades, new airport construction, and modernization initiatives worldwide are boosting demand for advanced ground-handling operations. Government aviation development programs, privatization of airports, and the shift toward smart airport ecosystems are driving adoption of automated ground support equipment, biometrics-based passenger services, and digitally integrated logistics systems. These modernization efforts enhance operational efficiency, safety, and turnaround time, significantly propelling growth in the airport on-ground services market.
Market Restraints
- High Operational and Labor Costs
One of the primary challenges is the high operational and labor costs associated with ground handling, as the sector is heavily manpower-driven and requires continuous workforce training, certification, and safety compliance. Additionally, fluctuating aviation fuel prices and economic uncertainties can impact airline profitability, reducing outsourcing budgets and delaying investment in ground-service modernization. Limited airport capacity, congested terminals, and infrastructure constraints in rapidly growing aviation regions further create operational bottlenecks. The industry also faces stringent safety and regulatory compliance requirements, which increase costs and slow implementation of new processes and technology. Furthermore, short-term contract structures between airlines and ground-service providers put pricing pressure on vendors, limiting margins and investment capability.
Socio Economic Impact on Airport On-Ground Service Market
The Global Airport On-Ground Services Market has had a significant socioeconomic impact by enhancing operational efficiency, employment generation, and overall air travel experience worldwide. Ground handling, baggage management, refueling, catering, and maintenance services support seamless airport operations, contributing directly to the aviation sector’s productivity and safety standards. Economically, the market stimulates job creation, local business development, and infrastructure investment in and around airports, driving regional growth and tourism. Socially, improved on-ground services ensure passenger comfort, reduce delays, and strengthen global connectivity, enabling smoother international travel and trade. As air traffic continues to expand, the sector plays a crucial role in promoting economic resilience, technological modernization, and sustainable growth within global transportation and logistics networks.
Segmental Analysis
- Passenger Handling Services segment is expected to witness highest growth over the forecast period
Passenger handling services dominate the market as global air travel surges and airports focus on enhancing customer experience. Increasing international tourism, rising low-cost carrier traffic, and peak passenger flow management are driving demand for efficient check-in, boarding, gate assistance, and transfer services. Investments in self-service check-in kiosks, biometric boarding, and automated passenger management are accelerating growth in this segment, helping reduce queue times and improve operational efficiency.
- Commercial Airlines segment is expected to witness highest growth over the forecast period
The commercial airlines segment leads market demand as airlines increasingly outsource ground operations to optimize costs, improve service quality, and comply with safety standards. With rising fleet expansion, route additions, and higher passenger volumes, airlines rely on specialized ground-handling partners for ramp services, maintenance, baggage handling, fueling, and catering. Growing partnerships between airlines and third-party service providers further strengthen this segment’s dominance.
- Passenger Transport segment is expected to witness highest growth over the forecast period
Passenger transport remains the primary application as airports across the world handle growing passenger throughput due to tourism growth, expanding domestic aviation networks, and post-pandemic air travel recovery. Demand for check-in, baggage services, lounge management, passenger assistance, and safety screening is increasing, supported by airport modernization and digitization initiatives to deliver seamless and hassle-free passenger journeys.
- North America region is expected to witness highest growth over the forecast period
The North America region is expected to witness the highest growth over the forecast period, driven by strong recovery in air travel, large-scale airport modernization programs, and increasing adoption of automation and digital ground-handling technologies. Major U.S. and Canadian airports are investing in self-service systems, biometrics, smart baggage handling, and electrified ground support equipment to enhance efficiency and sustainability.
Additionally, high aircraft traffic volume, expansion of airline fleets, and strong presence of leading ground-service companies support the region’s market acceleration. Strategic government initiatives to improve airport infrastructure and rising focus on enhancing passenger experience will further propel North America's leadership in the airport on-ground services market. For instance, October 2025, Bombardier announced the opening of a new 64,500-square-foot service center at Fort Wayne International Airport, Indiana, as part of its U.S. expansion strategy. The facility, complementing existing U.S. maintenance sites, offered full aircraft servicing and AOG support. This development strengthened the U.S. Global Airport On-Ground Services Market by enhancing maintenance capacity, operational efficiency, and customer support accessibility nationwide.
Thus, all such factors are expected to drive the growth of above market in this region.
| Report Matrics |
Details |
| Market Size Value |
USD 59.8 billion |
| Growth Rate |
CAGR of 9.6% |
| Forecast |
2026-2033 |
| Historical data |
2021-2024 |
| Base Year |
2025 |
| Report Coverage |
Forecasted revenue, company rating, competitive environment, growth drivers, and trends |
| Segment Coverage |
Type, Application, End-User, Geography |
| Regional Scope |
North America, Europe, Asia Pacific, Middle East |
| Customized scope |
Free customization of reports (With 3 months Analysis Support ) |
| To Learn More About This Report |
Request a Free Sample Copy |
Airport On-Ground Service Market Competitive Landscape:
The market is competitive and dominated by large multinational ground-handling and catering conglomerates, regional specialists, and niche cargo/telematics providers — competition centers on scale, global coverage, service quality, digital capabilities (baggage automation, telematics), and sustainability (electrified GSE). Additionally, market participants are increasingly investing in technology integration, strategic partnerships, and infrastructure modernization to gain a competitive edge. The rise of smart airports, driven by automation, data analytics, and AI-based operational tools, is reshaping service models. Furthermore, the industry’s growing focus on sustainability and regulatory compliance is accelerating the transition toward eco-efficient operations, including renewable energy use and reduced carbon footprints across ground handling and airport support services.
The major players for this market are:
- Swissport International
- Dnata (Emirates Group)
- Menzies Aviation
- Worldwide Flight Services (WFS)
- SATS Ltd
- Çelebi Aviation Holding
- Aviapartner
- National Aviation Services (NAS)
- Airport Services International Group (ASIG)
- LSG Sky Chefs
- Hactl (Hong Kong Air Cargo Terminals Ltd)
- AeroGround Services
- Groundforce
- Gategroup
- DO & CO
- SAHCO (Services Aéroportuaires Halet Consulting & Operations)
- Avianca Services
- Cathay Pacific Ground Services
- Jettainer
- Swissport Cargo Services
Recent Development
- In September 2025, The Directorate General of Civil Aviation (DGCA) granted safety clearance to Air India SATS Airport Services Pvt Ltd (AISATS), making it the first ground handling company in India to receive such approval. Introduced in July, the DGCA’s new framework aimed to strengthen Safety Management Systems (SMS) and enhance operational safety standards across ground handling operations nationwide.
- In May 2025, Red Sea Global (RSG) and daa International awarded a five-year contract to Saudi Ground Services (SGS) to deliver comprehensive ground handling services at Red Sea International Airport. The partnership set new standards for operational excellence and sustainability, positively influencing the Global Airport On-Ground Services Market by promoting innovation, efficiency, and environmentally responsible operations.
Frequently Asked Questions (FAQ) :
Q1. What are the main growth driving factors for this market?
The primary driver is the significant and rapid increase in global air passenger and cargo traffic, demanding faster and more efficient airport operations. The continuous need to reduce aircraft turnaround times is crucial for airlines' profitability, pushing the adoption of advanced ground support equipment and technologies. Additionally, the expansion and modernization of airport infrastructure, especially in developing regions, fuels the demand for comprehensive ground services.
Q2. What are the main restraining factors for this market?
Major restraining factors include the high initial capital investment required for modern ground handling equipment and the implementation of automated systems. The market also faces challenges from labor shortages of highly skilled personnel and the complexity of adhering to stringent, constantly evolving global safety, security, and environmental regulations, which increase compliance costs and operational complexity.
Q3. Which segment is expected to witness high growth?
The Baggage Handling and Remote Patient Monitoring (RPM) segments are projected to see the highest growth. Baggage handling is driven by the need for increased security, a reduction in lost luggage, and the adoption of high-tech systems like RFID and automated sorting. The Independent Service Providers segment is also witnessing high growth as airlines increasingly outsource these specialized services for cost efficiency.
Q4. Who are the top major players for this market?
The market is dominated by large, international service providers. Key players include Swissport International AG, known for its vast global network and comprehensive services, Dnata (part of The Emirates Group), and Menzies Aviation Limited. These companies compete by adopting advanced automation, investing in electric ground support equipment (GSE), and strategically acquiring smaller firms to expand their geographical reach and service offerings.
Q5. Which country is the largest player?
The North American region, specifically the United States, is the largest market player by revenue share, driven by high passenger volumes, advanced airport technology adoption, and significant investments in airport infrastructure modernization. However, the Asia Pacific region is generally forecast to witness the fastest growth, propelled by huge infrastructure development projects and a rapidly expanding aviation market in countries like China and India.
List of Figures
Figure 1: Global Airport On-Ground Service Market Revenue Breakdown (USD Billion, %) by Region, 2022 & 2029
Figure 2: Global Airport On-Ground Service Market Value Share (%), By Segment 1, 2022 & 2029
Figure 3: Global Airport On-Ground Service Market Forecast (USD Billion), by Sub-Segment 1, 2018-2029
Figure 4: Global Airport On-Ground Service Market Forecast (USD Billion), by Sub-Segment 2, 2018-2029
Figure 5: Global Airport On-Ground Service Market Value Share (%), By Segment 2, 2022 & 2029
Figure 6: Global Airport On-Ground Service Market Forecast (USD Billion), by Sub-Segment 1, 2018-2029
Figure 7: Global Airport On-Ground Service Market Forecast (USD Billion), by Sub-Segment 2, 2018-2029
Figure 8: Global Airport On-Ground Service Market Forecast (USD Billion), by Sub-Segment 3, 2018-2029
Figure 9: Global Airport On-Ground Service Market Forecast (USD Billion), by Others, 2018-2029
Figure 10: Global Airport On-Ground Service Market Value Share (%), By Segment 3, 2022 & 2029
Figure 11: Global Airport On-Ground Service Market Forecast (USD Billion), by Sub-Segment 1, 2018-2029
Figure 12: Global Airport On-Ground Service Market Forecast (USD Billion), by Sub-Segment 2, 2018-2029
Figure 13: Global Airport On-Ground Service Market Forecast (USD Billion), by Sub-Segment 3, 2018-2029
Figure 14: Global Airport On-Ground Service Market Forecast (USD Billion), by Others, 2018-2029
Figure 15: Global Airport On-Ground Service Market Value (USD Billion), by Region, 2022 & 2029
Figure 16: North America Airport On-Ground Service Market Value Share (%), By Segment 1, 2022 & 2029
Figure 17: North America Airport On-Ground Service Market Forecast (USD Billion), by Sub-Segment 1, 2018-2029
Figure 18: North America Airport On-Ground Service Market Forecast (USD Billion), by Sub-Segment 2, 2018-2029
Figure 19: North America Airport On-Ground Service Market Value Share (%), By Segment 2, 2022 & 2029
Figure 20: North America Airport On-Ground Service Market Forecast (USD Billion), by Sub-Segment 1, 2018-2029
Figure 21: North America Airport On-Ground Service Market Forecast (USD Billion), by Sub-Segment 2, 2018-2029
Figure 22: North America Airport On-Ground Service Market Forecast (USD Billion), by Sub-Segment 3, 2018-2029
Figure 23: North America Airport On-Ground Service Market Forecast (USD Billion), by Others, 2018-2029
Figure 24: North America Airport On-Ground Service Market Value Share (%), By Segment 3, 2022 & 2029
Figure 25: North America Airport On-Ground Service Market Forecast (USD Billion), by Sub-Segment 1, 2018-2029
Figure 26: North America Airport On-Ground Service Market Forecast (USD Billion), by Sub-Segment 2, 2018-2029
Figure 27: North America Airport On-Ground Service Market Forecast (USD Billion), by Sub-Segment 3, 2018-2029
Figure 28: North America Airport On-Ground Service Market Forecast (USD Billion), by Others, 2018-2029
Figure 29: North America Airport On-Ground Service Market Forecast (USD Billion), by U.S., 2018-2029
Figure 30: North America Airport On-Ground Service Market Forecast (USD Billion), by Canada, 2018-2029
Figure 31: Latin America Airport On-Ground Service Market Value Share (%), By Segment 1, 2022 & 2029
Figure 32: Latin America Airport On-Ground Service Market Forecast (USD Billion), by Sub-Segment 1, 2018-2029
Figure 33: Latin America Airport On-Ground Service Market Forecast (USD Billion), by Sub-Segment 2, 2018-2029
Figure 34: Latin America Airport On-Ground Service Market Value Share (%), By Segment 2, 2022 & 2029
Figure 35: Latin America Airport On-Ground Service Market Forecast (USD Billion), by Sub-Segment 1, 2018-2029
Figure 36: Latin America Airport On-Ground Service Market Forecast (USD Billion), by Sub-Segment 2, 2018-2029
Figure 37: Latin America Airport On-Ground Service Market Forecast (USD Billion), by Sub-Segment 3, 2018-2029
Figure 38: Latin America Airport On-Ground Service Market Forecast (USD Billion), by Others, 2018-2029
Figure 39: Latin America Airport On-Ground Service Market Value Share (%), By Segment 3, 2022 & 2029
Figure 40: Latin America Airport On-Ground Service Market Forecast (USD Billion), by Sub-Segment 1, 2018-2029
Figure 41: Latin America Airport On-Ground Service Market Forecast (USD Billion), by Sub-Segment 2, 2018-2029
Figure 42: Latin America Airport On-Ground Service Market Forecast (USD Billion), by Sub-Segment 3, 2018-2029
Figure 43: Latin America Airport On-Ground Service Market Forecast (USD Billion), by Others, 2018-2029
Figure 44: Latin America Airport On-Ground Service Market Forecast (USD Billion), by Brazil, 2018-2029
Figure 45: Latin America Airport On-Ground Service Market Forecast (USD Billion), by Mexico, 2018-2029
Figure 46: Latin America Airport On-Ground Service Market Forecast (USD Billion), by Rest of Latin America, 2018-2029
Figure 47: Europe Airport On-Ground Service Market Value Share (%), By Segment 1, 2022 & 2029
Figure 48: Europe Airport On-Ground Service Market Forecast (USD Billion), by Sub-Segment 1, 2018-2029
Figure 49: Europe Airport On-Ground Service Market Forecast (USD Billion), by Sub-Segment 2, 2018-2029
Figure 50: Europe Airport On-Ground Service Market Value Share (%), By Segment 2, 2022 & 2029
Figure 51: Europe Airport On-Ground Service Market Forecast (USD Billion), by Sub-Segment 1, 2018-2029
Figure 52: Europe Airport On-Ground Service Market Forecast (USD Billion), by Sub-Segment 2, 2018-2029
Figure 53: Europe Airport On-Ground Service Market Forecast (USD Billion), by Sub-Segment 3, 2018-2029
Figure 54: Europe Airport On-Ground Service Market Forecast (USD Billion), by Others, 2018-2029
Figure 55: Europe Airport On-Ground Service Market Value Share (%), By Segment 3, 2022 & 2029
Figure 56: Europe Airport On-Ground Service Market Forecast (USD Billion), by Sub-Segment 1, 2018-2029
Figure 57: Europe Airport On-Ground Service Market Forecast (USD Billion), by Sub-Segment 2, 2018-2029
Figure 58: Europe Airport On-Ground Service Market Forecast (USD Billion), by Sub-Segment 3, 2018-2029
Figure 59: Europe Airport On-Ground Service Market Forecast (USD Billion), by Others, 2018-2029
Figure 60: Europe Airport On-Ground Service Market Forecast (USD Billion), by U.K., 2018-2029
Figure 61: Europe Airport On-Ground Service Market Forecast (USD Billion), by Germany, 2018-2029
Figure 62: Europe Airport On-Ground Service Market Forecast (USD Billion), by France, 2018-2029
Figure 63: Europe Airport On-Ground Service Market Forecast (USD Billion), by Italy, 2018-2029
Figure 64: Europe Airport On-Ground Service Market Forecast (USD Billion), by Spain, 2018-2029
Figure 65: Europe Airport On-Ground Service Market Forecast (USD Billion), by Russia, 2018-2029
Figure 66: Europe Airport On-Ground Service Market Forecast (USD Billion), by Rest of Europe, 2018-2029
Figure 67: Asia Pacific Airport On-Ground Service Market Value Share (%), By Segment 1, 2022 & 2029
Figure 68: Asia Pacific Airport On-Ground Service Market Forecast (USD Billion), by Sub-Segment 1, 2018-2029
Figure 69: Asia Pacific Airport On-Ground Service Market Forecast (USD Billion), by Sub-Segment 2, 2018-2029
Figure 70: Asia Pacific Airport On-Ground Service Market Value Share (%), By Segment 2, 2022 & 2029
Figure 71: Asia Pacific Airport On-Ground Service Market Forecast (USD Billion), by Sub-Segment 1, 2018-2029
Figure 72: Asia Pacific Airport On-Ground Service Market Forecast (USD Billion), by Sub-Segment 2, 2018-2029
Figure 73: Asia Pacific Airport On-Ground Service Market Forecast (USD Billion), by Sub-Segment 3, 2018-2029
Figure 74: Asia Pacific Airport On-Ground Service Market Forecast (USD Billion), by Others, 2018-2029
Figure 75: Asia Pacific Airport On-Ground Service Market Value Share (%), By Segment 3, 2022 & 2029
Figure 76: Asia Pacific Airport On-Ground Service Market Forecast (USD Billion), by Sub-Segment 1, 2018-2029
Figure 77: Asia Pacific Airport On-Ground Service Market Forecast (USD Billion), by Sub-Segment 2, 2018-2029
Figure 78: Asia Pacific Airport On-Ground Service Market Forecast (USD Billion), by Sub-Segment 3, 2018-2029
Figure 79: Asia Pacific Airport On-Ground Service Market Forecast (USD Billion), by Others, 2018-2029
Figure 80: Asia Pacific Airport On-Ground Service Market Forecast (USD Billion), by China, 2018-2029
Figure 81: Asia Pacific Airport On-Ground Service Market Forecast (USD Billion), by India, 2018-2029
Figure 82: Asia Pacific Airport On-Ground Service Market Forecast (USD Billion), by Japan, 2018-2029
Figure 83: Asia Pacific Airport On-Ground Service Market Forecast (USD Billion), by Australia, 2018-2029
Figure 84: Asia Pacific Airport On-Ground Service Market Forecast (USD Billion), by Southeast Asia, 2018-2029
Figure 85: Asia Pacific Airport On-Ground Service Market Forecast (USD Billion), by Rest of Asia Pacific, 2018-2029
Figure 86: Middle East & Africa Airport On-Ground Service Market Value Share (%), By Segment 1, 2022 & 2029
Figure 87: Middle East & Africa Airport On-Ground Service Market Forecast (USD Billion), by Sub-Segment 1, 2018-2029
Figure 88: Middle East & Africa Airport On-Ground Service Market Forecast (USD Billion), by Sub-Segment 2, 2018-2029
Figure 89: Middle East & Africa Airport On-Ground Service Market Value Share (%), By Segment 2, 2022 & 2029
Figure 90: Middle East & Africa Airport On-Ground Service Market Forecast (USD Billion), by Sub-Segment 1, 2018-2029
Figure 91: Middle East & Africa Airport On-Ground Service Market Forecast (USD Billion), by Sub-Segment 2, 2018-2029
Figure 92: Middle East & Africa Airport On-Ground Service Market Forecast (USD Billion), by Sub-Segment 3, 2018-2029
Figure 93: Middle East & Africa Airport On-Ground Service Market Forecast (USD Billion), by Others, 2018-2029
Figure 94: Middle East & Africa Airport On-Ground Service Market Value Share (%), By Segment 3, 2022 & 2029
Figure 95: Middle East & Africa Airport On-Ground Service Market Forecast (USD Billion), by Sub-Segment 1, 2018-2029
Figure 96: Middle East & Africa Airport On-Ground Service Market Forecast (USD Billion), by Sub-Segment 2, 2018-2029
Figure 97: Middle East & Africa Airport On-Ground Service Market Forecast (USD Billion), by Sub-Segment 3, 2018-2029
Figure 98: Middle East & Africa Airport On-Ground Service Market Forecast (USD Billion), by Others, 2018-2029
Figure 99: Middle East & Africa Airport On-Ground Service Market Forecast (USD Billion), by GCC, 2018-2029
Figure 100: Middle East & Africa Airport On-Ground Service Market Forecast (USD Billion), by South Africa, 2018-2029
Figure 101: Middle East & Africa Airport On-Ground Service Market Forecast (USD Billion), by Rest of Middle East & Africa, 2018-2029
List of Tables
Table 1: Global Airport On-Ground Service Market Revenue (USD Billion) Forecast, by Segment 1, 2018-2029
Table 2: Global Airport On-Ground Service Market Revenue (USD Billion) Forecast, by Segment 2, 2018-2029
Table 3: Global Airport On-Ground Service Market Revenue (USD Billion) Forecast, by Segment 3, 2018-2029
Table 4: Global Airport On-Ground Service Market Revenue (USD Billion) Forecast, by Region, 2018-2029
Table 5: North America Airport On-Ground Service Market Revenue (USD Billion) Forecast, by Segment 1, 2018-2029
Table 6: North America Airport On-Ground Service Market Revenue (USD Billion) Forecast, by Segment 2, 2018-2029
Table 7: North America Airport On-Ground Service Market Revenue (USD Billion) Forecast, by Segment 3, 2018-2029
Table 8: North America Airport On-Ground Service Market Revenue (USD Billion) Forecast, by Country, 2018-2029
Table 9: Europe Airport On-Ground Service Market Revenue (USD Billion) Forecast, by Segment 1, 2018-2029
Table 10: Europe Airport On-Ground Service Market Revenue (USD Billion) Forecast, by Segment 2, 2018-2029
Table 11: Europe Airport On-Ground Service Market Revenue (USD Billion) Forecast, by Segment 3, 2018-2029
Table 12: Europe Airport On-Ground Service Market Revenue (USD Billion) Forecast, by Country, 2018-2029
Table 13: Latin America Airport On-Ground Service Market Revenue (USD Billion) Forecast, by Segment 1, 2018-2029
Table 14: Latin America Airport On-Ground Service Market Revenue (USD Billion) Forecast, by Segment 2, 2018-2029
Table 15: Latin America Airport On-Ground Service Market Revenue (USD Billion) Forecast, by Segment 3, 2018-2029
Table 16: Latin America Airport On-Ground Service Market Revenue (USD Billion) Forecast, by Country, 2018-2029
Table 17: Asia Pacific Airport On-Ground Service Market Revenue (USD Billion) Forecast, by Segment 1, 2018-2029
Table 18: Asia Pacific Airport On-Ground Service Market Revenue (USD Billion) Forecast, by Segment 2, 2018-2029
Table 19: Asia Pacific Airport On-Ground Service Market Revenue (USD Billion) Forecast, by Segment 3, 2018-2029
Table 20: Asia Pacific Airport On-Ground Service Market Revenue (USD Billion) Forecast, by Country, 2018-2029
Table 21: Middle East & Africa Airport On-Ground Service Market Revenue (USD Billion) Forecast, by Segment 1, 2018-2029
Table 22: Middle East & Africa Airport On-Ground Service Market Revenue (USD Billion) Forecast, by Segment 2, 2018-2029
Table 23: Middle East & Africa Airport On-Ground Service Market Revenue (USD Billion) Forecast, by Segment 3, 2018-2029
Table 24: Middle East & Africa Airport On-Ground Service Market Revenue (USD Billion) Forecast, by Country, 2018-2029
Research Process
Data Library Research are conducted by industry experts who offer insight on
industry structure, market segmentations technology assessment and competitive landscape (CL), and penetration, as well as on emerging trends. Their analysis is based on primary interviews (~ 80%) and secondary research (~ 20%) as well as years of professional expertise in their respective industries. Adding to this, by analysing historical trends and current market positions, our analysts predict where the market will be headed for the next five years. Furthermore, the varying trends of segment & categories geographically presented are also studied and the estimated based on the primary & secondary research.
In this particular report from the supply side Data Library Research has conducted primary surveys (interviews) with the key level executives (VP, CEO’s, Marketing Director, Business Development Manager
and SOFT) of the companies that active & prominent as well as the midsized organization
FIGURE 1: DLR RESEARH PROCESS
![research-methodology1]()
Primary Research
Extensive primary research was conducted to gain a deeper insight of the market and industry performance. The analysis is based on both primary and secondary research as well as years of professional expertise in the respective industries.
In addition to analysing current and historical trends, our analysts predict where the market is headed over the next five years.
It varies by segment for these categories geographically presented in the list of market tables. Speaking about this particular report we have conducted primary surveys (interviews) with the key level executives (VP, CEO’s, Marketing Director, Business Development Manager and many more) of the major players active in the market.
Secondary Research
Secondary research was mainly used to collect and identify information useful for the extensive, technical, market-oriented, and Friend’s study of the Global Extra Neutral Alcohol. It was also used to obtain key information about major players, market classification and segmentation according to the industry trends, geographical markets, and developments related to the market and technology perspectives. For this study, analysts have gathered information from various credible sources, such as annual reports, sec filings, journals, white papers, SOFT presentations, and company web sites.
Market Size Estimation
Both, top-down and bottom-up approaches were used to estimate and validate the size of the Global market and to estimate the size of various other dependent submarkets in the overall Extra Neutral Alcohol. The key players in the market were identified through secondary research and their market contributions in the respective geographies were determined through primary and secondary research.
Forecast Model
![research-methodology2]()