AMOLED Display for Smartphones Market Overview and Analysis:
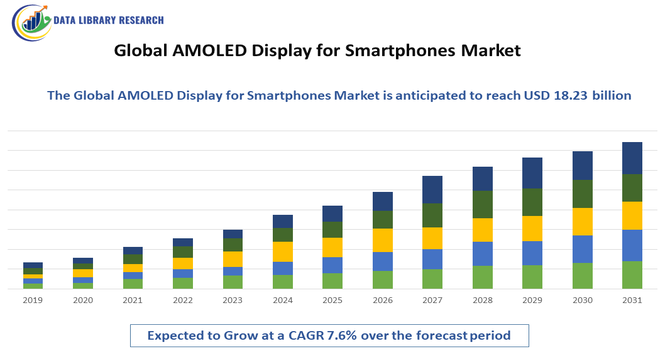
- The Global AMOLED Display for Smartphones Market is currently valued at USD 12.76 billion in 2025 and is expected to reach USD 18.23 billion in 2032, growing with a CAGR of 7.6% from 2025 to 2032.
Get Complete Analysis Of The Report - Download Updated Free Sample PDF
The Global AMOLED Display for Smartphones Market is primarily driven by increasing consumer demand for high-quality visual experiences, fueled by the proliferation of smartphones with advanced features such as high-resolution cameras, gaming capabilities, and multimedia streaming. AMOLED displays offer superior color reproduction, deeper contrast, energy efficiency, and thinner form factors compared to traditional LCDs, making them highly desirable for premium and mid-range smartphones. Rising adoption of foldable and flexible smartphones, along with continuous technological advancements in display resolution, brightness, and power consumption, further propels market growth.
AMOLED Display for Smartphones Market Latest Trends
The Global AMOLED Display for Smartphones Market is witnessing several notable trends shaping its growth and evolution. Manufacturers are increasingly focusing on flexible and foldable AMOLED panels, enabling innovative smartphone designs such as foldable and rollable devices. High refresh rate displays (90Hz, 120Hz, and above) are becoming standard in mid- and high-end smartphones, enhancing gaming and multimedia experiences. There is also a growing emphasis on energy-efficient panels with improved brightness and adaptive display technologies to extend battery life.
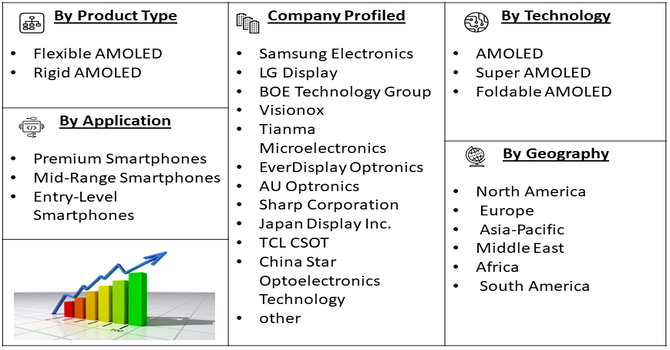
Segmentation: Global AMOLED Display for Smartphones Market is segmented By Display Type (Flexible AMOLED, Rigid AMOLED), Screen Size (Below 5 inches, 5–6 inches), By Resolution (HD, Full HD, Quad HD), Application (Premium Smartphones, Mid-Range Smartphones, Entry-Level Smartphones), Technology (AMOLED, Super AMOLED, Foldable AMOLED), and Geography (North America, Europe, Asia-Pacific, Middle East and Africa, and South America). The report provides the value (in USD million) for the above segments.
For Detailed Market Segmentation - Get a Free Sample PDF
Market Drivers:
- Rising Demand for High-Quality Visual Experiences in Smartphones
The growing consumer expectation for superior display performance is a major driver of the AMOLED display market. Users increasingly prefer smartphones with vivid colors, deep contrasts, and high brightness levels for activities such as gaming, video streaming, and photography. AMOLED displays provide significant advantages over traditional LCDs, including true blacks, higher contrast ratios, faster response times, and better energy efficiency. As smartphone manufacturers compete to deliver immersive multimedia experiences and premium device aesthetics, the adoption of AMOLED technology has surged across both high-end and increasingly mid-range smartphones, fueling market growth globally.
- Growth of Flexible and Foldable Smartphone Design
The evolution of flexible and foldable smartphones has accelerated the demand for AMOLED displays, as this technology allows for bendable and ultra-thin panels without compromising visual performance. Unlike rigid LCDs, AMOLED panels can be manufactured on flexible substrates, enabling innovative designs such as foldable screens, rollable displays, and edge-to-edge curved screens. This trend is driven by consumer interest in multifunctional and premium devices that combine portability with large screen experiences. The rise in R&D investments by smartphone OEMs and advancements in foldable AMOLED panel durability further support market expansion.
Market Restraints:
- High Manufacturing Costs and Price Sensitivity
The primary restraints for the Global AMOLED Display for Smartphones Market is the high cost of production compared to traditional LCD panels. AMOLED displays require sophisticated materials, advanced fabrication processes, and precise quality control, which drive up manufacturing expenses. This cost is often passed on to consumers, making smartphones with AMOLED screens more expensive, particularly in price-sensitive regions. As a result, adoption in entry-level and budget smartphone segments is limited. High production costs can also restrict small and mid-sized manufacturers from entering the market, slowing overall market penetration despite growing demand for premium displays.
Socioeconomic Impact on AMOLED Display for the Smartphones Market
The global AMOLED display market for smartphones has a strong socioeconomic impact by improving how people communicate, work, and access digital services. Better screen quality supports online learning, mobile payments, gaming, and video streaming, creating new income opportunities for content creators and app developers. Growing demand for AMOLED smartphones boosts manufacturing jobs, supply chains, and technology investments, especially in developing economies. As smartphones become more advanced, businesses benefit from better mobile marketing and digital customer engagement. At the same time, competition among brands helps lower costs over time, making high-quality devices more accessible. Thus, the AMOLED smartphone market supports digital inclusion, employment growth, and economic development worldwide.
Segmental Analysis:
- Flexible AMOLED segment is expected to witness the highest growth over the forecast period
Flexible AMOLED displays are gaining significant traction due to their ability to support curved, foldable, and edge-to-edge smartphone designs. These displays offer superior color reproduction, deeper contrast, and reduced thickness compared to rigid panels. The flexibility enables manufacturers to create innovative devices such as foldable phones and edge-curved screens, which appeal to premium and tech-savvy consumers. Rising demand for aesthetic, multifunctional, and futuristic smartphones is driving adoption of flexible AMOLED technology globally.
- 5–6 Inches segment is expected to witness the highest growth over the forecast period
The 5–6 inches screen size segment dominates the market as it aligns with the ergonomic preferences of most smartphone users. This range offers a balanced combination of portability and immersive viewing experience for gaming, video streaming, and browsing. AMOLED displays in this size range are widely used in mid-range and premium smartphones, making them a key revenue-generating segment. Consumer preference for handheld devices without compromising screen clarity and functionality sustains strong demand.
- Full HD segment is expected to witness the highest growth over the forecast period
Full HD (1080p) AMOLED panels are popular across both mid-range and premium smartphones due to their sharp image quality, high pixel density, and energy efficiency. Full HD resolution meets the majority of user expectations for gaming, video streaming, and photography while keeping production costs lower than Quad HD or 4K panels. This segment strikes a balance between performance and affordability, making it a critical contributor to market growth.
- Premium Smartphones segment is expected to witness the highest growth over the forecast period
Premium smartphones are the primary application for AMOLED displays, as consumers expect high-quality visuals, fast refresh rates, and advanced features. OEMs use AMOLED panels to differentiate their high-end devices, offering better color accuracy, HDR support, and thinner form factors. Rising consumer willingness to pay for enhanced display quality and immersive experiences drives strong adoption in this segment.
- Foldable AMOLED segment is expected to witness the highest growth over the forecast period
Foldable AMOLED technology is emerging as a key growth driver, enabling innovative devices such as foldable phones and dual-screen smartphones. These displays combine flexibility, high resolution, and durability to support new form factors while maintaining premium visual quality. Rising R&D investments and consumer interest in multifunctional, space-saving smartphones are fueling demand for foldable AMOLED panels.
- Asia-Pacific region is expected to witness the highest growth over the forecast period
The Asia-Pacific region is expected to witness the highest growth over the forecast period in the global AMOLED display market for smartphones. This growth is driven by a large consumer base, rising smartphone adoption, and increasing demand for premium and mid-range devices with advanced display features. For instance, in 2024, the launch of IIT Madras’s AMOLED Research Centre strengthens Asia-Pacific’s AMOLED display market by advancing local innovation and reducing reliance on imports. Backed by government and industry leaders, the initiative supports India’s display manufacturing ecosystem, enhances regional technological capabilities, and accelerates smartphone AMOLED adoption, reinforcing Asia-Pacific’s role as a key growth and production hub.
Rapid urbanization, expanding 5G networks, and growing use of smartphones for entertainment, gaming, and digital payments further support market expansion. Strong presence of key display manufacturers and smartphone brands in countries such as China, South Korea, and India enhances production capacity and technological innovation. Additionally, improving disposable incomes and affordable AMOLED-enabled smartphones are accelerating adoption, positioning Asia-Pacific as a major growth engine for the global AMOLED smartphone display market.
| Report Matrics |
Details |
| Market Size Value |
USD 18.23 billion |
| Growth Rate |
CAGR of 7.6 % |
| Forecast |
2026-2033 |
| Historical data |
2021-2024 |
| Base Year |
2025 |
| Report Coverage |
Forecasted revenue, company rating, competitive environment, growth drivers, and trends |
| Segment Coverage |
Type, Application, End-User, Geography |
| Regional Scope |
North America, Europe, Asia Pacific, Middle East |
| Customized scope |
Free customization of reports (With 3 months' analysis support) |
| To Learn More About This Report |
Request a Free Sample Copy |
AMOLED Display for Smartphones Market Competitive Landscape:
The Global AMOLED Display for Smartphones Market is highly competitive, driven by rapid technological advancements, increasing consumer demand for high-quality visual experiences, and the rise of innovative smartphone designs such as foldable and curved displays. Key players focus on research and development, strategic collaborations, and expanding manufacturing capacities to gain a competitive edge. Companies are also emphasizing energy-efficient panels, higher resolution, and enhanced durability to differentiate their products. The market sees intense rivalry among established brands and emerging manufacturers, with continuous innovation and product diversification shaping the competitive dynamics across global regions.
Key Players:
- Samsung Electronics
- LG Display
- BOE Technology Group
- Visionox
- Tianma Microelectronics
- EverDisplay Optronics
- AU Optronics
- Sharp Corporation
- Japan Display Inc.
- TCL CSOT
- China Star Optoelectronics Technology
- Apple Inc.
- Huawei Technologies
- Xiaomi Corporation
- Oppo
- Vivo
- Lenovo
- Sony Corporation
- Panasonic
- Asus.
Recent Development
- In June 2025, Samsung’s launch of the Galaxy M36 5G strengthens the global AMOLED display market by expanding access to feature-rich smartphones in high-growth segments. Targeting young consumers, the device boosts demand for advanced AMOLED screens paired with AI features and long software support. This encourages wider AMOLED adoption, drives volume growth, and reinforces Samsung’s leadership in global smartphone display innovation.
- In May 2024, Tianma’s showcase of advanced foldable AMOLED displays at Display Week 2024 highlights rapid innovation in smartphone display technology. Its inward and outward foldable LTPO OLED solutions improve durability, color performance, and design flexibility. These advancements strengthen global AMOLED adoption, encourage foldable smartphone development, and intensify competition among display manufacturers, accelerating innovation and market growth worldwide.
Frequently Asked Questions (FAQ) :
Q1. What are the main growth-driving factors for this market?
The primary driver is the consumer shift toward premium, high-contrast visual experiences. AMOLED panels offer deeper blacks and more vibrant colors than traditional LCDs. Additionally, the rise of 5G smartphones, which require thinner and more energy-efficient displays to offset higher battery drain, is pushing manufacturers to adopt AMOLED technology across both flagship and mid-range devices.
Q2. What are the main restraining factors for this market?
The biggest challenge remains the higher production cost compared to LCD and the technical difficulty of manufacturing at high yields. Issues like "burn-in"—where static images leave permanent ghosts on the screen—and the sensitivity of organic materials to moisture and oxygen also pose longevity concerns, requiring expensive encapsulation processes that drive up the final price of the device.
Q3. Which segment is expected to witness high growth?
The Flexible AMOLED segment is expected to witness the highest growth. This technology is the backbone of the foldable and rollable smartphone revolution. Because flexible AMOLEDs are built on plastic substrates rather than glass, they allow for radical new form factors, thinner bezels, and increased durability, making them the most sought-after feature for next-generation mobile hardware.
Q4. Who are the top major players for this market?
The market is dominated by a few high-tech display manufacturers with massive fabrication plants. Key players include Samsung Display, BOE Technology, LG Display, and Visionox. Samsung remains the pioneer and market leader, providing panels not only for its own devices but also for major competitors like Apple, while BOE is rapidly expanding its market share.
Q5. Which country is the largest player?
South Korea is the largest player in the AMOLED market. Home to industry giants Samsung and LG, the country holds a massive lead in both patent ownership and manufacturing capacity. While China is catching up quickly through government-backed investments, South Korea's long-standing expertise in organic light-emitting diode technology keeps it at the global forefront of display innovation.
List of Figures
Figure 1: Global AMOLED Display for Smartphones Market Revenue Breakdown (USD Billion, %) by Region, 2022 & 2029
Figure 2: Global AMOLED Display for Smartphones Market Value Share (%), By Segment 1, 2022 & 2029
Figure 3: Global AMOLED Display for Smartphones Market Forecast (USD Billion), by Sub-Segment 1, 2018-2029
Figure 4: Global AMOLED Display for Smartphones Market Forecast (USD Billion), by Sub-Segment 2, 2018-2029
Figure 5: Global AMOLED Display for Smartphones Market Value Share (%), By Segment 2, 2022 & 2029
Figure 6: Global AMOLED Display for Smartphones Market Forecast (USD Billion), by Sub-Segment 1, 2018-2029
Figure 7: Global AMOLED Display for Smartphones Market Forecast (USD Billion), by Sub-Segment 2, 2018-2029
Figure 8: Global AMOLED Display for Smartphones Market Forecast (USD Billion), by Sub-Segment 3, 2018-2029
Figure 9: Global AMOLED Display for Smartphones Market Forecast (USD Billion), by Others, 2018-2029
Figure 10: Global AMOLED Display for Smartphones Market Value Share (%), By Segment 3, 2022 & 2029
Figure 11: Global AMOLED Display for Smartphones Market Forecast (USD Billion), by Sub-Segment 1, 2018-2029
Figure 12: Global AMOLED Display for Smartphones Market Forecast (USD Billion), by Sub-Segment 2, 2018-2029
Figure 13: Global AMOLED Display for Smartphones Market Forecast (USD Billion), by Sub-Segment 3, 2018-2029
Figure 14: Global AMOLED Display for Smartphones Market Forecast (USD Billion), by Others, 2018-2029
Figure 15: Global AMOLED Display for Smartphones Market Value (USD Billion), by Region, 2022 & 2029
Figure 16: North America AMOLED Display for Smartphones Market Value Share (%), By Segment 1, 2022 & 2029
Figure 17: North America AMOLED Display for Smartphones Market Forecast (USD Billion), by Sub-Segment 1, 2018-2029
Figure 18: North America AMOLED Display for Smartphones Market Forecast (USD Billion), by Sub-Segment 2, 2018-2029
Figure 19: North America AMOLED Display for Smartphones Market Value Share (%), By Segment 2, 2022 & 2029
Figure 20: North America AMOLED Display for Smartphones Market Forecast (USD Billion), by Sub-Segment 1, 2018-2029
Figure 21: North America AMOLED Display for Smartphones Market Forecast (USD Billion), by Sub-Segment 2, 2018-2029
Figure 22: North America AMOLED Display for Smartphones Market Forecast (USD Billion), by Sub-Segment 3, 2018-2029
Figure 23: North America AMOLED Display for Smartphones Market Forecast (USD Billion), by Others, 2018-2029
Figure 24: North America AMOLED Display for Smartphones Market Value Share (%), By Segment 3, 2022 & 2029
Figure 25: North America AMOLED Display for Smartphones Market Forecast (USD Billion), by Sub-Segment 1, 2018-2029
Figure 26: North America AMOLED Display for Smartphones Market Forecast (USD Billion), by Sub-Segment 2, 2018-2029
Figure 27: North America AMOLED Display for Smartphones Market Forecast (USD Billion), by Sub-Segment 3, 2018-2029
Figure 28: North America AMOLED Display for Smartphones Market Forecast (USD Billion), by Others, 2018-2029
Figure 29: North America AMOLED Display for Smartphones Market Forecast (USD Billion), by U.S., 2018-2029
Figure 30: North America AMOLED Display for Smartphones Market Forecast (USD Billion), by Canada, 2018-2029
Figure 31: Latin America AMOLED Display for Smartphones Market Value Share (%), By Segment 1, 2022 & 2029
Figure 32: Latin America AMOLED Display for Smartphones Market Forecast (USD Billion), by Sub-Segment 1, 2018-2029
Figure 33: Latin America AMOLED Display for Smartphones Market Forecast (USD Billion), by Sub-Segment 2, 2018-2029
Figure 34: Latin America AMOLED Display for Smartphones Market Value Share (%), By Segment 2, 2022 & 2029
Figure 35: Latin America AMOLED Display for Smartphones Market Forecast (USD Billion), by Sub-Segment 1, 2018-2029
Figure 36: Latin America AMOLED Display for Smartphones Market Forecast (USD Billion), by Sub-Segment 2, 2018-2029
Figure 37: Latin America AMOLED Display for Smartphones Market Forecast (USD Billion), by Sub-Segment 3, 2018-2029
Figure 38: Latin America AMOLED Display for Smartphones Market Forecast (USD Billion), by Others, 2018-2029
Figure 39: Latin America AMOLED Display for Smartphones Market Value Share (%), By Segment 3, 2022 & 2029
Figure 40: Latin America AMOLED Display for Smartphones Market Forecast (USD Billion), by Sub-Segment 1, 2018-2029
Figure 41: Latin America AMOLED Display for Smartphones Market Forecast (USD Billion), by Sub-Segment 2, 2018-2029
Figure 42: Latin America AMOLED Display for Smartphones Market Forecast (USD Billion), by Sub-Segment 3, 2018-2029
Figure 43: Latin America AMOLED Display for Smartphones Market Forecast (USD Billion), by Others, 2018-2029
Figure 44: Latin America AMOLED Display for Smartphones Market Forecast (USD Billion), by Brazil, 2018-2029
Figure 45: Latin America AMOLED Display for Smartphones Market Forecast (USD Billion), by Mexico, 2018-2029
Figure 46: Latin America AMOLED Display for Smartphones Market Forecast (USD Billion), by Rest of Latin America, 2018-2029
Figure 47: Europe AMOLED Display for Smartphones Market Value Share (%), By Segment 1, 2022 & 2029
Figure 48: Europe AMOLED Display for Smartphones Market Forecast (USD Billion), by Sub-Segment 1, 2018-2029
Figure 49: Europe AMOLED Display for Smartphones Market Forecast (USD Billion), by Sub-Segment 2, 2018-2029
Figure 50: Europe AMOLED Display for Smartphones Market Value Share (%), By Segment 2, 2022 & 2029
Figure 51: Europe AMOLED Display for Smartphones Market Forecast (USD Billion), by Sub-Segment 1, 2018-2029
Figure 52: Europe AMOLED Display for Smartphones Market Forecast (USD Billion), by Sub-Segment 2, 2018-2029
Figure 53: Europe AMOLED Display for Smartphones Market Forecast (USD Billion), by Sub-Segment 3, 2018-2029
Figure 54: Europe AMOLED Display for Smartphones Market Forecast (USD Billion), by Others, 2018-2029
Figure 55: Europe AMOLED Display for Smartphones Market Value Share (%), By Segment 3, 2022 & 2029
Figure 56: Europe AMOLED Display for Smartphones Market Forecast (USD Billion), by Sub-Segment 1, 2018-2029
Figure 57: Europe AMOLED Display for Smartphones Market Forecast (USD Billion), by Sub-Segment 2, 2018-2029
Figure 58: Europe AMOLED Display for Smartphones Market Forecast (USD Billion), by Sub-Segment 3, 2018-2029
Figure 59: Europe AMOLED Display for Smartphones Market Forecast (USD Billion), by Others, 2018-2029
Figure 60: Europe AMOLED Display for Smartphones Market Forecast (USD Billion), by U.K., 2018-2029
Figure 61: Europe AMOLED Display for Smartphones Market Forecast (USD Billion), by Germany, 2018-2029
Figure 62: Europe AMOLED Display for Smartphones Market Forecast (USD Billion), by France, 2018-2029
Figure 63: Europe AMOLED Display for Smartphones Market Forecast (USD Billion), by Italy, 2018-2029
Figure 64: Europe AMOLED Display for Smartphones Market Forecast (USD Billion), by Spain, 2018-2029
Figure 65: Europe AMOLED Display for Smartphones Market Forecast (USD Billion), by Russia, 2018-2029
Figure 66: Europe AMOLED Display for Smartphones Market Forecast (USD Billion), by Rest of Europe, 2018-2029
Figure 67: Asia Pacific AMOLED Display for Smartphones Market Value Share (%), By Segment 1, 2022 & 2029
Figure 68: Asia Pacific AMOLED Display for Smartphones Market Forecast (USD Billion), by Sub-Segment 1, 2018-2029
Figure 69: Asia Pacific AMOLED Display for Smartphones Market Forecast (USD Billion), by Sub-Segment 2, 2018-2029
Figure 70: Asia Pacific AMOLED Display for Smartphones Market Value Share (%), By Segment 2, 2022 & 2029
Figure 71: Asia Pacific AMOLED Display for Smartphones Market Forecast (USD Billion), by Sub-Segment 1, 2018-2029
Figure 72: Asia Pacific AMOLED Display for Smartphones Market Forecast (USD Billion), by Sub-Segment 2, 2018-2029
Figure 73: Asia Pacific AMOLED Display for Smartphones Market Forecast (USD Billion), by Sub-Segment 3, 2018-2029
Figure 74: Asia Pacific AMOLED Display for Smartphones Market Forecast (USD Billion), by Others, 2018-2029
Figure 75: Asia Pacific AMOLED Display for Smartphones Market Value Share (%), By Segment 3, 2022 & 2029
Figure 76: Asia Pacific AMOLED Display for Smartphones Market Forecast (USD Billion), by Sub-Segment 1, 2018-2029
Figure 77: Asia Pacific AMOLED Display for Smartphones Market Forecast (USD Billion), by Sub-Segment 2, 2018-2029
Figure 78: Asia Pacific AMOLED Display for Smartphones Market Forecast (USD Billion), by Sub-Segment 3, 2018-2029
Figure 79: Asia Pacific AMOLED Display for Smartphones Market Forecast (USD Billion), by Others, 2018-2029
Figure 80: Asia Pacific AMOLED Display for Smartphones Market Forecast (USD Billion), by China, 2018-2029
Figure 81: Asia Pacific AMOLED Display for Smartphones Market Forecast (USD Billion), by India, 2018-2029
Figure 82: Asia Pacific AMOLED Display for Smartphones Market Forecast (USD Billion), by Japan, 2018-2029
Figure 83: Asia Pacific AMOLED Display for Smartphones Market Forecast (USD Billion), by Australia, 2018-2029
Figure 84: Asia Pacific AMOLED Display for Smartphones Market Forecast (USD Billion), by Southeast Asia, 2018-2029
Figure 85: Asia Pacific AMOLED Display for Smartphones Market Forecast (USD Billion), by Rest of Asia Pacific, 2018-2029
Figure 86: Middle East & Africa AMOLED Display for Smartphones Market Value Share (%), By Segment 1, 2022 & 2029
Figure 87: Middle East & Africa AMOLED Display for Smartphones Market Forecast (USD Billion), by Sub-Segment 1, 2018-2029
Figure 88: Middle East & Africa AMOLED Display for Smartphones Market Forecast (USD Billion), by Sub-Segment 2, 2018-2029
Figure 89: Middle East & Africa AMOLED Display for Smartphones Market Value Share (%), By Segment 2, 2022 & 2029
Figure 90: Middle East & Africa AMOLED Display for Smartphones Market Forecast (USD Billion), by Sub-Segment 1, 2018-2029
Figure 91: Middle East & Africa AMOLED Display for Smartphones Market Forecast (USD Billion), by Sub-Segment 2, 2018-2029
Figure 92: Middle East & Africa AMOLED Display for Smartphones Market Forecast (USD Billion), by Sub-Segment 3, 2018-2029
Figure 93: Middle East & Africa AMOLED Display for Smartphones Market Forecast (USD Billion), by Others, 2018-2029
Figure 94: Middle East & Africa AMOLED Display for Smartphones Market Value Share (%), By Segment 3, 2022 & 2029
Figure 95: Middle East & Africa AMOLED Display for Smartphones Market Forecast (USD Billion), by Sub-Segment 1, 2018-2029
Figure 96: Middle East & Africa AMOLED Display for Smartphones Market Forecast (USD Billion), by Sub-Segment 2, 2018-2029
Figure 97: Middle East & Africa AMOLED Display for Smartphones Market Forecast (USD Billion), by Sub-Segment 3, 2018-2029
Figure 98: Middle East & Africa AMOLED Display for Smartphones Market Forecast (USD Billion), by Others, 2018-2029
Figure 99: Middle East & Africa AMOLED Display for Smartphones Market Forecast (USD Billion), by GCC, 2018-2029
Figure 100: Middle East & Africa AMOLED Display for Smartphones Market Forecast (USD Billion), by South Africa, 2018-2029
Figure 101: Middle East & Africa AMOLED Display for Smartphones Market Forecast (USD Billion), by Rest of Middle East & Africa, 2018-2029
List of Tables
Table 1: Global AMOLED Display for Smartphones Market Revenue (USD Billion) Forecast, by Segment 1, 2018-2029
Table 2: Global AMOLED Display for Smartphones Market Revenue (USD Billion) Forecast, by Segment 2, 2018-2029
Table 3: Global AMOLED Display for Smartphones Market Revenue (USD Billion) Forecast, by Segment 3, 2018-2029
Table 4: Global AMOLED Display for Smartphones Market Revenue (USD Billion) Forecast, by Region, 2018-2029
Table 5: North America AMOLED Display for Smartphones Market Revenue (USD Billion) Forecast, by Segment 1, 2018-2029
Table 6: North America AMOLED Display for Smartphones Market Revenue (USD Billion) Forecast, by Segment 2, 2018-2029
Table 7: North America AMOLED Display for Smartphones Market Revenue (USD Billion) Forecast, by Segment 3, 2018-2029
Table 8: North America AMOLED Display for Smartphones Market Revenue (USD Billion) Forecast, by Country, 2018-2029
Table 9: Europe AMOLED Display for Smartphones Market Revenue (USD Billion) Forecast, by Segment 1, 2018-2029
Table 10: Europe AMOLED Display for Smartphones Market Revenue (USD Billion) Forecast, by Segment 2, 2018-2029
Table 11: Europe AMOLED Display for Smartphones Market Revenue (USD Billion) Forecast, by Segment 3, 2018-2029
Table 12: Europe AMOLED Display for Smartphones Market Revenue (USD Billion) Forecast, by Country, 2018-2029
Table 13: Latin America AMOLED Display for Smartphones Market Revenue (USD Billion) Forecast, by Segment 1, 2018-2029
Table 14: Latin America AMOLED Display for Smartphones Market Revenue (USD Billion) Forecast, by Segment 2, 2018-2029
Table 15: Latin America AMOLED Display for Smartphones Market Revenue (USD Billion) Forecast, by Segment 3, 2018-2029
Table 16: Latin America AMOLED Display for Smartphones Market Revenue (USD Billion) Forecast, by Country, 2018-2029
Table 17: Asia Pacific AMOLED Display for Smartphones Market Revenue (USD Billion) Forecast, by Segment 1, 2018-2029
Table 18: Asia Pacific AMOLED Display for Smartphones Market Revenue (USD Billion) Forecast, by Segment 2, 2018-2029
Table 19: Asia Pacific AMOLED Display for Smartphones Market Revenue (USD Billion) Forecast, by Segment 3, 2018-2029
Table 20: Asia Pacific AMOLED Display for Smartphones Market Revenue (USD Billion) Forecast, by Country, 2018-2029
Table 21: Middle East & Africa AMOLED Display for Smartphones Market Revenue (USD Billion) Forecast, by Segment 1, 2018-2029
Table 22: Middle East & Africa AMOLED Display for Smartphones Market Revenue (USD Billion) Forecast, by Segment 2, 2018-2029
Table 23: Middle East & Africa AMOLED Display for Smartphones Market Revenue (USD Billion) Forecast, by Segment 3, 2018-2029
Table 24: Middle East & Africa AMOLED Display for Smartphones Market Revenue (USD Billion) Forecast, by Country, 2018-2029
Research Process
Data Library Research are conducted by industry experts who offer insight on
industry structure, market segmentations technology assessment and competitive landscape (CL), and penetration, as well as on emerging trends. Their analysis is based on primary interviews (~ 80%) and secondary research (~ 20%) as well as years of professional expertise in their respective industries. Adding to this, by analysing historical trends and current market positions, our analysts predict where the market will be headed for the next five years. Furthermore, the varying trends of segment & categories geographically presented are also studied and the estimated based on the primary & secondary research.
In this particular report from the supply side Data Library Research has conducted primary surveys (interviews) with the key level executives (VP, CEO’s, Marketing Director, Business Development Manager
and SOFT) of the companies that active & prominent as well as the midsized organization
FIGURE 1: DLR RESEARH PROCESS
![research-methodology1]()
Primary Research
Extensive primary research was conducted to gain a deeper insight of the market and industry performance. The analysis is based on both primary and secondary research as well as years of professional expertise in the respective industries.
In addition to analysing current and historical trends, our analysts predict where the market is headed over the next five years.
It varies by segment for these categories geographically presented in the list of market tables. Speaking about this particular report we have conducted primary surveys (interviews) with the key level executives (VP, CEO’s, Marketing Director, Business Development Manager and many more) of the major players active in the market.
Secondary Research
Secondary research was mainly used to collect and identify information useful for the extensive, technical, market-oriented, and Friend’s study of the Global Extra Neutral Alcohol. It was also used to obtain key information about major players, market classification and segmentation according to the industry trends, geographical markets, and developments related to the market and technology perspectives. For this study, analysts have gathered information from various credible sources, such as annual reports, sec filings, journals, white papers, SOFT presentations, and company web sites.
Market Size Estimation
Both, top-down and bottom-up approaches were used to estimate and validate the size of the Global market and to estimate the size of various other dependent submarkets in the overall Extra Neutral Alcohol. The key players in the market were identified through secondary research and their market contributions in the respective geographies were determined through primary and secondary research.
Forecast Model
![research-methodology2]()