Automated Bricklaying Robot Market Overview and Analysis:
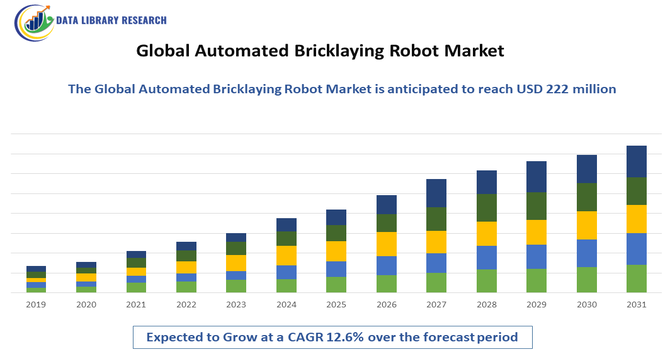
- The Global Automated Bricklaying Robot Market is valued near USD 97 million in 2025 and is projected to reach about USD 222 million by 2032. This growth represents a robust Compound Annual Growth Rate (CAGR) of 12.6% during the forecast period, 2025-2032.
Get Complete Analysis Of The Report - Download Updated Free Sample PDF
The Global Automated Bricklaying Robot Market is experiencing strong growth driven by the accelerating adoption of automation in the construction industry, rising labor shortages, and the increasing need for faster, more precise, and cost-efficient bricklaying processes. Demand is further fueled by rapid urbanization, large-scale infrastructure development, and the push for improved productivity in residential and commercial construction projects.
Automated Bricklaying Robot Market Latest Trends:
The Global Automated Bricklaying Robot Market is witnessing several emerging trends as construction companies increasingly adopt advanced automation to address productivity gaps and labor constraints. One of the most significant trends is the integration of AI-driven computer vision and real-time 3D mapping, enabling robots to analyze work environments, adjust brick placement with high precision, and adapt to varying site conditions. There is also a growing shift toward modular and mobile robotic platforms that can be easily transported across job sites, enhancing operational flexibility.
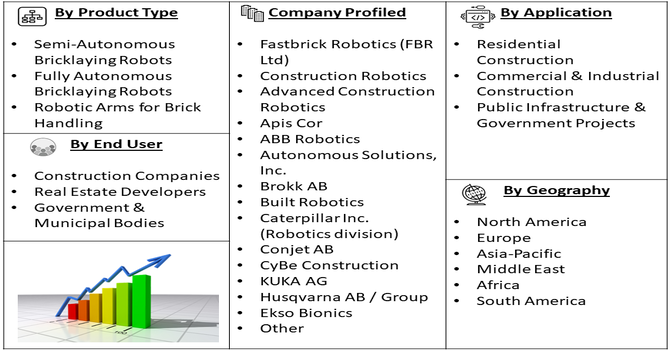
Segmentation: Global Automated Bricklaying Robot Market is segmented By Robot Type (Semi-Autonomous Bricklaying Robots, Fully Autonomous Bricklaying Robots, Robotic Arms for Brick Handling), Automation Level (3D Printing-Based Construction Robots, Vision-Guided Bricklaying Robots, Collaborative (Cobot) Bricklaying Systems), Application (Residential Construction, Commercial & Industrial Construction, Public Infrastructure & Government Projects), End User (Construction Companies, Real Estate Developers, Government & Municipal Bodies), and Geography (North America, Europe, Asia-Pacific, Middle East and Africa, and South America). The report provides the value (in USD million) for the above segments.
For Detailed Market Segmentation - Get a Free Sample PDF
Market Drivers:
- Growing Labor Shortages and Rising Cost of Skilled Workforce
A major driver for the Global Automated Bricklaying Robot Market is the persistent labor shortage faced by the construction industry worldwide. Skilled bricklayers are increasingly difficult to find due to an aging workforce, declining interest among younger workers, and physically demanding working conditions. As wages rise to attract and retain skilled labor, construction companies face higher operational costs and productivity challenges. Automated bricklaying robots offer a solution by performing repetitive and labor-intensive tasks with high precision, reducing dependency on human labor while maintaining consistent output.
- Need for Faster, Cost-Efficient, and High-Precision Construction
The growing demand for efficient construction processes is another key factor driving the adoption of automated bricklaying robots. Rapid urbanization and large-scale infrastructure expansion have increased the pressure on contractors to complete projects faster without compromising structural quality.
Automated bricklaying robots can lay bricks at speeds significantly higher than human workers while maintaining exceptional accuracy, reducing errors, and minimizing material wastage. Their ability to operate for extended hours, even under harsh environmental conditions, further accelerates project timelines. Additionally, advanced robots equipped with AI, machine vision, and real-time site monitoring ensure improved alignment, uniformity, and durability of brick structures.
Market Restraints
- High Initial Investment Cost
The primary challenges is the high initial investment cost, as automated bricklaying systems require advanced robotics, sensors, AI-driven software, and integration with existing construction workflows. This makes them expensive for small and mid-sized contractors, especially in developing regions where construction budgets are limited. Additionally, the complexity of operation and maintenance poses another barrier, as these robots require trained technicians, regular calibration, and high-quality site preparation to function efficiently.
Socio Economic Impact on the Automated Bricklaying Robot Market
The socioeconomic impact of the Global Automated Bricklaying Robot Market is marked by a dual dynamic in which rising adoption of robotic construction technologies enhances productivity, reduces project timelines, and addresses chronic labor shortages—particularly in regions with aging workforces—while simultaneously reshaping labor demand by shifting traditional masonry roles toward higher-skilled technical, programming, and maintenance positions; this transition can stimulate economic growth through increased construction efficiency, lower long-term building costs, and greater infrastructure capacity, yet it may also widen skill gaps and require substantial investment in workforce retraining, regulatory adaptation, and capital expenditures, meaning that countries and firms capable of embracing automation stand to gain competitiveness and improved safety outcomes, whereas low-income regions or small contractors may face barriers to adoption that could deepen existing inequalities across global construction markets.
Segmental Analysis:
- Fully Autonomous Bricklaying Robots segment is expected to witness the highest growth over the forecast period
Fully autonomous bricklaying robots represent a highly advanced segment, driven by the need for maximum productivity, precision, and reduced labor dependency on construction sites. These robots can independently plan brick placement, adjust to site conditions, and operate continuously with minimal human supervision. Their ability to integrate AI algorithms, real-time mapping, and automated material handling makes them ideal for large-scale infrastructure and high-volume construction projects. As construction companies focus on meeting tight deadlines and improving structural accuracy, fully autonomous systems are gaining strong momentum.
- Vision-Guided Bricklaying Robots segment is expected to witness the highest growth over the forecast period
Vision-guided bricklaying robots are becoming increasingly significant due to their ability to analyze and interpret site conditions through advanced imaging, LiDAR, and 3D vision technologies. These systems adjust to irregularities in surfaces, align bricks with high precision, and optimize material placement, reducing errors and rework. Their adaptability to dynamic construction environments makes them a preferred choice for complex projects where accuracy and safety are critical. This segment is expanding rapidly as AI and computer vision capabilities continue to advance.
- Commercial & Industrial Construction segment is expected to witness the highest growth over the forecast period
Commercial and industrial construction is a leading application segment, driven by the growing demand for large-scale, fast-paced, and cost-efficient building solutions. Automated bricklaying robots help contractors achieve uniformity, reduce labor requirements, and significantly shorten project timelines—critical factors for commercial buildings, warehouses, factories, and multi-story structures. The increasing focus on sustainable, high-efficiency construction further boosts the adoption of automation in this segment.
- Construction Companies segment is expected to witness the highest growth over the forecast period
Construction companies form the primary end-user group as they directly benefit from improved productivity, reduced labor dependency, and enhanced safety offered by automated bricklaying robots. Facing increasing pressure to deliver projects faster and at lower cost, these companies are integrating robotics into their workflows to improve operational efficiency. Larger firms, in particular, are adopting advanced robotic systems as part of their digital transformation strategies, driving strong growth in this segment.
- North America segment is expected to witness the highest growth over the forecast period
North America stands out as a major regional market for automated bricklaying robots, driven by high labor costs, strong technological adoption, and intensive investment in construction automation. The region’s focus on infrastructure modernization, shortage of skilled bricklayers, and government support for robotics innovation further enhance market growth.
Additionally, the presence of leading robotics companies and construction-tech startups strengthens the overall ecosystem, making North America one of the fastest-growing regions in the global market. For instance, in May 2024, BMW Group’s expansion of 3D-printed, customised robot grippers had advanced robotic precision and efficiency, indirectly boosting confidence in automation across North America. This progress had encouraged construction firms to adopt advanced robotic tools, accelerating innovation, improving handling capabilities, and supporting broader acceptance and growth within the North America Automated Bricklaying Robot Market.
Similarly, in January 2024, ABB Robotics’ collaboration with Simpliforge Creations to advance 3D printing technologies had demonstrated the growing potential of automated construction, reinforcing global confidence in robotics. Its success in enabling faster, safer, and sustainable building had indirectly supported technological spillover, encouraging innovation and stronger adoption in the North America Automated Bricklaying Robot Market.
Thus, such factors are driving the market growth over the forecast period.
| Report Matrics |
Details |
| Market Size Value |
USD 222 million |
| Growth Rate |
CAGR of 12.6% |
| Forecast |
2026-2033 |
| Historical data |
2021-2024 |
| Base Year |
2025 |
| Report Coverage |
Forecasted revenue, company rating, competitive environment, growth drivers, and trends |
| Segment Coverage |
Type, Application, End-User, Geography |
| Regional Scope |
North America, Europe, Asia Pacific, Middle East |
| Customized scope |
Free customization of reports (With 3 months' analysis support) |
| To Learn More About This Report |
Request a Free Sample Copy |
Automated Bricklaying Robot Market Competitive Landscape:
The competitive landscape of the Global Automated Bricklaying Robot Market is characterized by a growing mix of established robotics manufacturers and innovative construction-automation startups competing to deliver faster, more precise, and cost-efficient bricklaying solutions. Companies are focusing on advancing robotic autonomy, enhancing computer vision capabilities, integrating AI-driven planning software, and improving system reliability on dynamic construction sites. Strategic partnerships with construction firms, investments in pilot projects, and the expansion of robotic solutions into commercial, residential, and infrastructure applications are key competitive strategies. As organizations emphasize reducing labor dependency and accelerating project timelines, vendors are increasingly differentiating through technology integration, automation efficiency, pricing models, and end-to-end support services, creating an intensely competitive and rapidly evolving market environment.
Key Players:
- Fastbrick Robotics (FBR Ltd)
- Construction Robotics
- Advanced Construction Robotics
- Apis Cor
- ABB Robotics
- Autonomous Solutions, Inc.
- Brokk AB
- Built Robotics
- Caterpillar Inc. (Robotics division)
- Conjet AB
- CyBe Construction
- KUKA AG
- Husqvarna AB / Group
- Ekso Bionics
- Fujita Corporation
- CYBERDYNE Inc.
- Giant Hydraulic Tech
- Boston Dynamics
- SQ4D
- Construction Automation Limited
Recent Development
- In July 2024, PulteGroup’s successful pilot of FBR’s Hadrian X robot had validated large-scale, rapid robotic construction, boosting industry confidence in autonomous masonry. Its ability to complete a home in a day during a labor shortage had accelerated interest, investment, and adoption, strengthening momentum and competitiveness in the Global Automated Bricklaying Robot Market.
- In February 2024, The Dutch startup’s securing of USD 25M funding had accelerated the spread of autonomous bricklaying robots across Europe, boosting innovation, intensifying competition, and expanding market adoption. This investment had strengthened technological capabilities, encouraged wider commercialization, and pushed the Global Automated Bricklaying Robot Market toward faster growth and greater automation readiness.
Frequently Asked Questions (FAQ) :
Q1. What are the main growth-driving factors for this market?
The severe global shortage of skilled construction labor is the primary growth driver for this market. Robots offer a solution by providing consistent quality, increasing site productivity, and maintaining output twenty-four hours a day. Furthermore, rising labor costs and the increasing need for faster project completion times are pushing construction firms toward automation to remain competitive and profitable.
Q2. What are the main restraining factors for this market?
The market is primarily constrained by the high initial capital investment required to purchase these complex, specialized robotic systems. Smaller construction companies often struggle to justify the massive upfront cost. Additionally, these robots require specialized technical expertise for operation, programming, and maintenance, and their current lack of flexibility across diverse building sites can also limit their rapid adoption.
Q3. Which segment is expected to witness high growth?
The Fully Autonomous Robots segment is anticipated to experience the highest growth rate. These advanced systems can perform end-to-end bricklaying tasks without human intervention, leading to greater efficiency and precision compared to semi-autonomous models. The integration of AI and Building Information Modeling (BIM) with these robots further enhances their capability for large, complex construction projects.
Q4. Who are the top major players for this market?
The automated bricklaying robot market is led by innovative technology companies focused on construction automation. Key players include FBR Ltd. (Fastbrick Robotics), known for its large-scale Hadrian X robot, and Construction Robotics, which developed the Semi-Automated Mason (SAM) system. Other important competitors include Construction Automation Limited and Craftsmac Lab.
Q5. Which country is the largest player?
The United States holds the largest market share, driven by its high labor costs and a strong push toward construction innovation and productivity within commercial and residential sectors. While North America dominates in terms of overall market value, the Asia-Pacific region, particularly China and India, is rapidly gaining ground due to massive urbanization and government infrastructure investment.
List of Figures
Figure 1: Global Automated Bricklaying Robot Market Revenue Breakdown (USD Billion, %) by Region, 2022 & 2029
Figure 2: Global Automated Bricklaying Robot Market Value Share (%), By Segment 1, 2022 & 2029
Figure 3: Global Automated Bricklaying Robot Market Forecast (USD Billion), by Sub-Segment 1, 2018-2029
Figure 4: Global Automated Bricklaying Robot Market Forecast (USD Billion), by Sub-Segment 2, 2018-2029
Figure 5: Global Automated Bricklaying Robot Market Value Share (%), By Segment 2, 2022 & 2029
Figure 6: Global Automated Bricklaying Robot Market Forecast (USD Billion), by Sub-Segment 1, 2018-2029
Figure 7: Global Automated Bricklaying Robot Market Forecast (USD Billion), by Sub-Segment 2, 2018-2029
Figure 8: Global Automated Bricklaying Robot Market Forecast (USD Billion), by Sub-Segment 3, 2018-2029
Figure 9: Global Automated Bricklaying Robot Market Forecast (USD Billion), by Others, 2018-2029
Figure 10: Global Automated Bricklaying Robot Market Value Share (%), By Segment 3, 2022 & 2029
Figure 11: Global Automated Bricklaying Robot Market Forecast (USD Billion), by Sub-Segment 1, 2018-2029
Figure 12: Global Automated Bricklaying Robot Market Forecast (USD Billion), by Sub-Segment 2, 2018-2029
Figure 13: Global Automated Bricklaying Robot Market Forecast (USD Billion), by Sub-Segment 3, 2018-2029
Figure 14: Global Automated Bricklaying Robot Market Forecast (USD Billion), by Others, 2018-2029
Figure 15: Global Automated Bricklaying Robot Market Value (USD Billion), by Region, 2022 & 2029
Figure 16: North America Automated Bricklaying Robot Market Value Share (%), By Segment 1, 2022 & 2029
Figure 17: North America Automated Bricklaying Robot Market Forecast (USD Billion), by Sub-Segment 1, 2018-2029
Figure 18: North America Automated Bricklaying Robot Market Forecast (USD Billion), by Sub-Segment 2, 2018-2029
Figure 19: North America Automated Bricklaying Robot Market Value Share (%), By Segment 2, 2022 & 2029
Figure 20: North America Automated Bricklaying Robot Market Forecast (USD Billion), by Sub-Segment 1, 2018-2029
Figure 21: North America Automated Bricklaying Robot Market Forecast (USD Billion), by Sub-Segment 2, 2018-2029
Figure 22: North America Automated Bricklaying Robot Market Forecast (USD Billion), by Sub-Segment 3, 2018-2029
Figure 23: North America Automated Bricklaying Robot Market Forecast (USD Billion), by Others, 2018-2029
Figure 24: North America Automated Bricklaying Robot Market Value Share (%), By Segment 3, 2022 & 2029
Figure 25: North America Automated Bricklaying Robot Market Forecast (USD Billion), by Sub-Segment 1, 2018-2029
Figure 26: North America Automated Bricklaying Robot Market Forecast (USD Billion), by Sub-Segment 2, 2018-2029
Figure 27: North America Automated Bricklaying Robot Market Forecast (USD Billion), by Sub-Segment 3, 2018-2029
Figure 28: North America Automated Bricklaying Robot Market Forecast (USD Billion), by Others, 2018-2029
Figure 29: North America Automated Bricklaying Robot Market Forecast (USD Billion), by U.S., 2018-2029
Figure 30: North America Automated Bricklaying Robot Market Forecast (USD Billion), by Canada, 2018-2029
Figure 31: Latin America Automated Bricklaying Robot Market Value Share (%), By Segment 1, 2022 & 2029
Figure 32: Latin America Automated Bricklaying Robot Market Forecast (USD Billion), by Sub-Segment 1, 2018-2029
Figure 33: Latin America Automated Bricklaying Robot Market Forecast (USD Billion), by Sub-Segment 2, 2018-2029
Figure 34: Latin America Automated Bricklaying Robot Market Value Share (%), By Segment 2, 2022 & 2029
Figure 35: Latin America Automated Bricklaying Robot Market Forecast (USD Billion), by Sub-Segment 1, 2018-2029
Figure 36: Latin America Automated Bricklaying Robot Market Forecast (USD Billion), by Sub-Segment 2, 2018-2029
Figure 37: Latin America Automated Bricklaying Robot Market Forecast (USD Billion), by Sub-Segment 3, 2018-2029
Figure 38: Latin America Automated Bricklaying Robot Market Forecast (USD Billion), by Others, 2018-2029
Figure 39: Latin America Automated Bricklaying Robot Market Value Share (%), By Segment 3, 2022 & 2029
Figure 40: Latin America Automated Bricklaying Robot Market Forecast (USD Billion), by Sub-Segment 1, 2018-2029
Figure 41: Latin America Automated Bricklaying Robot Market Forecast (USD Billion), by Sub-Segment 2, 2018-2029
Figure 42: Latin America Automated Bricklaying Robot Market Forecast (USD Billion), by Sub-Segment 3, 2018-2029
Figure 43: Latin America Automated Bricklaying Robot Market Forecast (USD Billion), by Others, 2018-2029
Figure 44: Latin America Automated Bricklaying Robot Market Forecast (USD Billion), by Brazil, 2018-2029
Figure 45: Latin America Automated Bricklaying Robot Market Forecast (USD Billion), by Mexico, 2018-2029
Figure 46: Latin America Automated Bricklaying Robot Market Forecast (USD Billion), by Rest of Latin America, 2018-2029
Figure 47: Europe Automated Bricklaying Robot Market Value Share (%), By Segment 1, 2022 & 2029
Figure 48: Europe Automated Bricklaying Robot Market Forecast (USD Billion), by Sub-Segment 1, 2018-2029
Figure 49: Europe Automated Bricklaying Robot Market Forecast (USD Billion), by Sub-Segment 2, 2018-2029
Figure 50: Europe Automated Bricklaying Robot Market Value Share (%), By Segment 2, 2022 & 2029
Figure 51: Europe Automated Bricklaying Robot Market Forecast (USD Billion), by Sub-Segment 1, 2018-2029
Figure 52: Europe Automated Bricklaying Robot Market Forecast (USD Billion), by Sub-Segment 2, 2018-2029
Figure 53: Europe Automated Bricklaying Robot Market Forecast (USD Billion), by Sub-Segment 3, 2018-2029
Figure 54: Europe Automated Bricklaying Robot Market Forecast (USD Billion), by Others, 2018-2029
Figure 55: Europe Automated Bricklaying Robot Market Value Share (%), By Segment 3, 2022 & 2029
Figure 56: Europe Automated Bricklaying Robot Market Forecast (USD Billion), by Sub-Segment 1, 2018-2029
Figure 57: Europe Automated Bricklaying Robot Market Forecast (USD Billion), by Sub-Segment 2, 2018-2029
Figure 58: Europe Automated Bricklaying Robot Market Forecast (USD Billion), by Sub-Segment 3, 2018-2029
Figure 59: Europe Automated Bricklaying Robot Market Forecast (USD Billion), by Others, 2018-2029
Figure 60: Europe Automated Bricklaying Robot Market Forecast (USD Billion), by U.K., 2018-2029
Figure 61: Europe Automated Bricklaying Robot Market Forecast (USD Billion), by Germany, 2018-2029
Figure 62: Europe Automated Bricklaying Robot Market Forecast (USD Billion), by France, 2018-2029
Figure 63: Europe Automated Bricklaying Robot Market Forecast (USD Billion), by Italy, 2018-2029
Figure 64: Europe Automated Bricklaying Robot Market Forecast (USD Billion), by Spain, 2018-2029
Figure 65: Europe Automated Bricklaying Robot Market Forecast (USD Billion), by Russia, 2018-2029
Figure 66: Europe Automated Bricklaying Robot Market Forecast (USD Billion), by Rest of Europe, 2018-2029
Figure 67: Asia Pacific Automated Bricklaying Robot Market Value Share (%), By Segment 1, 2022 & 2029
Figure 68: Asia Pacific Automated Bricklaying Robot Market Forecast (USD Billion), by Sub-Segment 1, 2018-2029
Figure 69: Asia Pacific Automated Bricklaying Robot Market Forecast (USD Billion), by Sub-Segment 2, 2018-2029
Figure 70: Asia Pacific Automated Bricklaying Robot Market Value Share (%), By Segment 2, 2022 & 2029
Figure 71: Asia Pacific Automated Bricklaying Robot Market Forecast (USD Billion), by Sub-Segment 1, 2018-2029
Figure 72: Asia Pacific Automated Bricklaying Robot Market Forecast (USD Billion), by Sub-Segment 2, 2018-2029
Figure 73: Asia Pacific Automated Bricklaying Robot Market Forecast (USD Billion), by Sub-Segment 3, 2018-2029
Figure 74: Asia Pacific Automated Bricklaying Robot Market Forecast (USD Billion), by Others, 2018-2029
Figure 75: Asia Pacific Automated Bricklaying Robot Market Value Share (%), By Segment 3, 2022 & 2029
Figure 76: Asia Pacific Automated Bricklaying Robot Market Forecast (USD Billion), by Sub-Segment 1, 2018-2029
Figure 77: Asia Pacific Automated Bricklaying Robot Market Forecast (USD Billion), by Sub-Segment 2, 2018-2029
Figure 78: Asia Pacific Automated Bricklaying Robot Market Forecast (USD Billion), by Sub-Segment 3, 2018-2029
Figure 79: Asia Pacific Automated Bricklaying Robot Market Forecast (USD Billion), by Others, 2018-2029
Figure 80: Asia Pacific Automated Bricklaying Robot Market Forecast (USD Billion), by China, 2018-2029
Figure 81: Asia Pacific Automated Bricklaying Robot Market Forecast (USD Billion), by India, 2018-2029
Figure 82: Asia Pacific Automated Bricklaying Robot Market Forecast (USD Billion), by Japan, 2018-2029
Figure 83: Asia Pacific Automated Bricklaying Robot Market Forecast (USD Billion), by Australia, 2018-2029
Figure 84: Asia Pacific Automated Bricklaying Robot Market Forecast (USD Billion), by Southeast Asia, 2018-2029
Figure 85: Asia Pacific Automated Bricklaying Robot Market Forecast (USD Billion), by Rest of Asia Pacific, 2018-2029
Figure 86: Middle East & Africa Automated Bricklaying Robot Market Value Share (%), By Segment 1, 2022 & 2029
Figure 87: Middle East & Africa Automated Bricklaying Robot Market Forecast (USD Billion), by Sub-Segment 1, 2018-2029
Figure 88: Middle East & Africa Automated Bricklaying Robot Market Forecast (USD Billion), by Sub-Segment 2, 2018-2029
Figure 89: Middle East & Africa Automated Bricklaying Robot Market Value Share (%), By Segment 2, 2022 & 2029
Figure 90: Middle East & Africa Automated Bricklaying Robot Market Forecast (USD Billion), by Sub-Segment 1, 2018-2029
Figure 91: Middle East & Africa Automated Bricklaying Robot Market Forecast (USD Billion), by Sub-Segment 2, 2018-2029
Figure 92: Middle East & Africa Automated Bricklaying Robot Market Forecast (USD Billion), by Sub-Segment 3, 2018-2029
Figure 93: Middle East & Africa Automated Bricklaying Robot Market Forecast (USD Billion), by Others, 2018-2029
Figure 94: Middle East & Africa Automated Bricklaying Robot Market Value Share (%), By Segment 3, 2022 & 2029
Figure 95: Middle East & Africa Automated Bricklaying Robot Market Forecast (USD Billion), by Sub-Segment 1, 2018-2029
Figure 96: Middle East & Africa Automated Bricklaying Robot Market Forecast (USD Billion), by Sub-Segment 2, 2018-2029
Figure 97: Middle East & Africa Automated Bricklaying Robot Market Forecast (USD Billion), by Sub-Segment 3, 2018-2029
Figure 98: Middle East & Africa Automated Bricklaying Robot Market Forecast (USD Billion), by Others, 2018-2029
Figure 99: Middle East & Africa Automated Bricklaying Robot Market Forecast (USD Billion), by GCC, 2018-2029
Figure 100: Middle East & Africa Automated Bricklaying Robot Market Forecast (USD Billion), by South Africa, 2018-2029
Figure 101: Middle East & Africa Automated Bricklaying Robot Market Forecast (USD Billion), by Rest of Middle East & Africa, 2018-2029
List of Tables
Table 1: Global Automated Bricklaying Robot Market Revenue (USD Billion) Forecast, by Segment 1, 2018-2029
Table 2: Global Automated Bricklaying Robot Market Revenue (USD Billion) Forecast, by Segment 2, 2018-2029
Table 3: Global Automated Bricklaying Robot Market Revenue (USD Billion) Forecast, by Segment 3, 2018-2029
Table 4: Global Automated Bricklaying Robot Market Revenue (USD Billion) Forecast, by Region, 2018-2029
Table 5: North America Automated Bricklaying Robot Market Revenue (USD Billion) Forecast, by Segment 1, 2018-2029
Table 6: North America Automated Bricklaying Robot Market Revenue (USD Billion) Forecast, by Segment 2, 2018-2029
Table 7: North America Automated Bricklaying Robot Market Revenue (USD Billion) Forecast, by Segment 3, 2018-2029
Table 8: North America Automated Bricklaying Robot Market Revenue (USD Billion) Forecast, by Country, 2018-2029
Table 9: Europe Automated Bricklaying Robot Market Revenue (USD Billion) Forecast, by Segment 1, 2018-2029
Table 10: Europe Automated Bricklaying Robot Market Revenue (USD Billion) Forecast, by Segment 2, 2018-2029
Table 11: Europe Automated Bricklaying Robot Market Revenue (USD Billion) Forecast, by Segment 3, 2018-2029
Table 12: Europe Automated Bricklaying Robot Market Revenue (USD Billion) Forecast, by Country, 2018-2029
Table 13: Latin America Automated Bricklaying Robot Market Revenue (USD Billion) Forecast, by Segment 1, 2018-2029
Table 14: Latin America Automated Bricklaying Robot Market Revenue (USD Billion) Forecast, by Segment 2, 2018-2029
Table 15: Latin America Automated Bricklaying Robot Market Revenue (USD Billion) Forecast, by Segment 3, 2018-2029
Table 16: Latin America Automated Bricklaying Robot Market Revenue (USD Billion) Forecast, by Country, 2018-2029
Table 17: Asia Pacific Automated Bricklaying Robot Market Revenue (USD Billion) Forecast, by Segment 1, 2018-2029
Table 18: Asia Pacific Automated Bricklaying Robot Market Revenue (USD Billion) Forecast, by Segment 2, 2018-2029
Table 19: Asia Pacific Automated Bricklaying Robot Market Revenue (USD Billion) Forecast, by Segment 3, 2018-2029
Table 20: Asia Pacific Automated Bricklaying Robot Market Revenue (USD Billion) Forecast, by Country, 2018-2029
Table 21: Middle East & Africa Automated Bricklaying Robot Market Revenue (USD Billion) Forecast, by Segment 1, 2018-2029
Table 22: Middle East & Africa Automated Bricklaying Robot Market Revenue (USD Billion) Forecast, by Segment 2, 2018-2029
Table 23: Middle East & Africa Automated Bricklaying Robot Market Revenue (USD Billion) Forecast, by Segment 3, 2018-2029
Table 24: Middle East & Africa Automated Bricklaying Robot Market Revenue (USD Billion) Forecast, by Country, 2018-2029
Research Process
Data Library Research are conducted by industry experts who offer insight on
industry structure, market segmentations technology assessment and competitive landscape (CL), and penetration, as well as on emerging trends. Their analysis is based on primary interviews (~ 80%) and secondary research (~ 20%) as well as years of professional expertise in their respective industries. Adding to this, by analysing historical trends and current market positions, our analysts predict where the market will be headed for the next five years. Furthermore, the varying trends of segment & categories geographically presented are also studied and the estimated based on the primary & secondary research.
In this particular report from the supply side Data Library Research has conducted primary surveys (interviews) with the key level executives (VP, CEO’s, Marketing Director, Business Development Manager
and SOFT) of the companies that active & prominent as well as the midsized organization
FIGURE 1: DLR RESEARH PROCESS
![research-methodology1]()
Primary Research
Extensive primary research was conducted to gain a deeper insight of the market and industry performance. The analysis is based on both primary and secondary research as well as years of professional expertise in the respective industries.
In addition to analysing current and historical trends, our analysts predict where the market is headed over the next five years.
It varies by segment for these categories geographically presented in the list of market tables. Speaking about this particular report we have conducted primary surveys (interviews) with the key level executives (VP, CEO’s, Marketing Director, Business Development Manager and many more) of the major players active in the market.
Secondary Research
Secondary research was mainly used to collect and identify information useful for the extensive, technical, market-oriented, and Friend’s study of the Global Extra Neutral Alcohol. It was also used to obtain key information about major players, market classification and segmentation according to the industry trends, geographical markets, and developments related to the market and technology perspectives. For this study, analysts have gathered information from various credible sources, such as annual reports, sec filings, journals, white papers, SOFT presentations, and company web sites.
Market Size Estimation
Both, top-down and bottom-up approaches were used to estimate and validate the size of the Global market and to estimate the size of various other dependent submarkets in the overall Extra Neutral Alcohol. The key players in the market were identified through secondary research and their market contributions in the respective geographies were determined through primary and secondary research.
Forecast Model
![research-methodology2]()