Get Complete Analysis Of The Report - Download Updated Free Sample PDF
The Global Automated Laboratory Systems Market is witnessing robust growth, driven primarily by the increasing demand for efficiency, accuracy, and high-throughput capabilities in clinical, research, and pharmaceutical laboratories. Rising prevalence of chronic diseases, expanding diagnostic testing volumes, and the growing need for rapid and precise results are encouraging laboratories to adopt automation technologies. Technological advancements, including robotic sample handling, integrated workflow solutions, and AI-driven data analysis, are enhancing productivity while reducing human error and operational costs.
The global automated laboratory systems market is being shaped by the integration of AI- and machine learning-powered smart labs, where automation extends beyond robotics to include predictive analytics, workflow optimization, and data-driven decision-making, enhancing efficiency and reducing errors. Modular and scalable automation platforms are gaining popularity, allowing laboratories to gradually implement robotic arms, automated liquid handlers, and storage modules according to evolving needs and budgets. Cloud-connected lab ecosystems are also on the rise, with laboratories using cloud-based Laboratory Information Management Systems (LIMS) and analytics platforms for remote monitoring, centralized data management, collaboration across sites, and improved traceability and compliance.
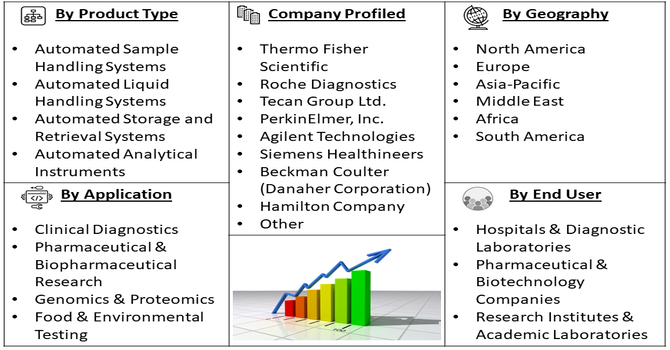
Segmentation: Global automated laboratory systems market is segmented By Product Type (Automated Sample Handling Systems, Automated Liquid Handling Systems, Automated Storage and Retrieval Systems, Automated Analytical Instruments), Application (Clinical Diagnostics, Pharmaceutical & Biopharmaceutical Research, Genomics & Proteomics, Food & Environmental Testing), End User (Hospitals & Diagnostic Laboratories, Pharmaceutical & Biotechnology Companies, Research Institutes & Academic Laboratories), Technology (Robotics & Automation Platforms, Laboratory Information Management Systems, Artificial Intelligence & Machine Learning Integration), and Geography (North America, Europe, Asia-Pacific, Middle East and Africa, and South America). The report provides the value (in USD million) for the above segments.
For Detailed Market Segmentation - Get a Free Sample PDF
Market Drivers:
The increasing volume of diagnostic tests, research assays, and quality control analyses is driving laboratories to adopt automated systems that enhance throughput and operational efficiency. Automated laboratory systems, including robotic sample handlers, liquid handling platforms, and integrated analytical instruments, allow labs to process large numbers of samples with minimal manual intervention. For instance, in August 2025, Seegene Inc unveiled two pre-commercial technologies at ADLM 2025—CURECA, the world’s first fully unattended PCR automation system, and STAgora, a real-time diagnostic data analytics platform. These innovations had addressed inefficiencies in molecular testing by reducing reliance on skilled personnel and manual processes, driving the global automated laboratory systems market and meeting rising demand for high-throughput, efficient diagnostic testing.
This reduces human error, accelerates turnaround times, and ensures consistent results, which is particularly critical in clinical diagnostics, genomics research, and pharmaceutical R&D. The need to deliver rapid, reliable, and reproducible results amid rising patient loads and expanding research programs is a primary factor propelling the adoption of automation in laboratories worldwide.
Advancements in robotics, artificial intelligence (AI), machine learning (ML), and laboratory information management systems (LIMS) are significantly enhancing the capabilities of automated laboratory systems.
Modern platforms offer features such as predictive analytics, smart workflow optimization, and real-time data monitoring, enabling laboratories to make informed decisions faster and reduce operational costs. Integration of AI and ML allows for pattern recognition, anomaly detection, and process optimization, further increasing productivity and precision. These technological improvements make automated laboratory systems more versatile, reliable, and attractive for adoption across clinical, pharmaceutical, and research settings, thereby driving market growth.
Market Restraints:
Automated laboratory systems often require substantial upfront capital — procuring robotics, automated liquid handling platforms, automated storage/retrieval units, integrated software (e.g. Laboratory Information Management Systems), and facility modifications can be very expensive. For many small and mid sized laboratories, research institutes or diagnostic labs — especially those in developing regions — these costs exceed their budgets, making full automation economically unfeasible.
Moreover, beyond initial purchase, ongoing maintenance, software licensing/updates, calibration, consumables, and technical support add recurring expenses that further raise the total cost of ownership.
The Global Automated Laboratory Systems Market has had significant socioeconomic impacts by transforming the efficiency and accessibility of laboratory operations worldwide. Automation in laboratories reduced manual errors, increased throughput, and enabled faster, more accurate diagnostics, benefiting healthcare, pharmaceutical, and research sectors. This growth created new employment opportunities in engineering, software, and laboratory management while requiring workforce upskilling in automation technologies. Improved lab efficiency lowered operational costs, making diagnostic and research services more affordable and accessible, particularly in emerging economies.
Segmental Analysis:
Automated liquid handling systems are a critical component of modern laboratories, enabling precise, reproducible, and high-throughput sample preparation for assays, diagnostics, and research applications. These systems reduce human error, save time, and allow simultaneous processing of multiple samples, making them essential in genomics, drug discovery, and clinical diagnostics. The segment is witnessing strong growth due to increasing demand for efficiency and accuracy in laboratory workflows.
Clinical diagnostics represents a major application area for automated laboratory systems, driven by the rising prevalence of chronic diseases, infectious diseases, and personalized medicine initiatives. Automation in diagnostic labs enhances throughput, reduces turnaround times for test results, and ensures standardized and reliable outputs, supporting patient care and large-scale screening programs.
Hospitals and diagnostic laboratories are the primary end users of automated laboratory systems due to their high sample volumes and need for rapid, accurate testing. These facilities adopt automated systems to streamline workflows, improve operational efficiency, and support advanced testing services, including molecular diagnostics and immunoassays, which are essential for timely patient management.
The integration of AI and machine learning into automated laboratory systems allows for advanced data analytics, predictive modeling, and workflow optimization. AI-enabled platforms can detect anomalies, optimize reagent usage, and provide insights from complex datasets, enhancing decision-making, accuracy, and operational efficiency. This technology is increasingly adopted in high-throughput labs, research centers, and clinical diagnostics.
In July 2025, Ginkgo Bioworks announced that the Environmental Molecular Sciences Laboratory at PNNL had selected Ginkgo Automation to provide an advanced automated anaerobic phenotyping platform at its Richland, Washington campus. This implementation had enhanced EMSL’s biological research capabilities, supporting energy and bioeconomy initiatives, while driving the global automated laboratory systems market and increasing demand for AI and machine learning integration in laboratory automation.
North America holds the largest share in the automated laboratory systems market due to the region’s advanced healthcare infrastructure, high adoption of automation technologies, presence of major manufacturers, and favorable reimbursement policies. Strong research activity, growing investment in genomics and biopharmaceutical R&D, and rising demand for accurate and rapid diagnostics further support market growth in this region.
The region’s robust investment in life sciences, genomics, and personalized medicine had accelerated demand for automated solutions. For instance, in March 2025, Thermo Fisher Scientific launched the Thermo Scientific Vulcan Automated Lab to advance process development and control in semiconductor manufacturing. The integrated system had improved productivity, increased yield, and reduced operating costs amid growing demand for atomic-scale TEM metrology. This launch had strengthened North America’s automated laboratory systems market by supporting high-efficiency, scalable laboratory operations in the semiconductor industry.
Additionally, the presence of major industry players, supportive regulatory frameworks, and increasing emphasis on faster, more accurate diagnostics had reinforced market growth, positioning North America as a global leader in laboratory automation innovation.
| Report Matrics | Details |
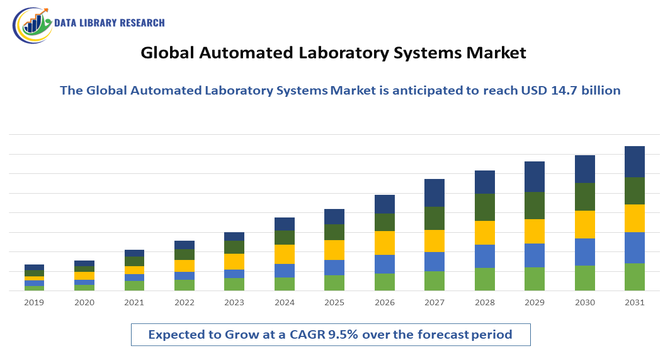
| Market Size Value | USD 14.7 million |
| Growth Rate | CAGR of 9.5% |
| Forecast | 2026-2033 |
| Historical data | 2021-2024 |
| Base Year | 2025 |
| Report Coverage | Forecasted revenue, company rating, competitive environment, growth drivers, and trends |
| Segment Coverage | Type, Application, End-User, Geography |
| Regional Scope | North America, Europe, Asia Pacific, Middle East |
| Customized scope | Free customization of reports (With 3 months' analysis support) |
| To Learn More About This Report | Request a Free Sample Copy |
The global market for automated laboratory systems is highly competitive and driven by continuous innovation, broad product portfolios, and comprehensive service & support offerings. Leading companies compete on multiple fronts: development of high-throughput robotics and automation platforms, integration of software solutions such as Laboratory Information Management Systems (LIMS), scaling and modularity of systems for different lab sizes (from small research labs to large diagnostic centers), global distribution networks, and after-sales service including maintenance, calibration, and consumables supply.
Key Players:
Recent Development
Q1. What are the main growth-driving factors for this market?
The primary growth driver is the intense need for higher efficiency and precision in clinical and research labs. Automation significantly reduces human error, speeds up sample processing (high-throughput screening), and lowers overall labor costs. The push toward drug discovery and personalized medicine also requires these fast, reliable systems.
Q2. What are the main restraining factors for this market?
The chief challenge is the high initial capital investment required to purchase and install these advanced robotic systems. Furthermore, integrating new, complex automated platforms with existing older laboratory information management systems (LIMS) can be difficult and time-consuming, leading to compatibility issues.
Q3. Which segment is expected to witness high growth?
The Drug Discovery application segment is forecast to see high growth. Pharmaceutical and biotechnology companies are rapidly adopting automation to accelerate the screening of potential drug candidates and lead optimization. This reduces the time and cost associated with bringing new therapies to market.
Q4. Who are the top major players for this market?
Key companies leading this market include large technology and diagnostics providers such as Thermo Fisher Scientific, Danaher Corporation, Agilent Technologies, and Siemens Healthineers. These major players offer comprehensive automated workstations, liquid handling systems, and specialized software solutions.
Q5. Which country is the largest player?
North America, particularly the United States, holds the largest market share. This dominance is due to the strong presence of major pharmaceutical and biotechnology companies, substantial government funding for research, and a highly advanced healthcare infrastructure that readily adopts new automated technologies.
Data Library Research are conducted by industry experts who offer insight on industry structure, market segmentations technology assessment and competitive landscape (CL), and penetration, as well as on emerging trends. Their analysis is based on primary interviews (~ 80%) and secondary research (~ 20%) as well as years of professional expertise in their respective industries. Adding to this, by analysing historical trends and current market positions, our analysts predict where the market will be headed for the next five years. Furthermore, the varying trends of segment & categories geographically presented are also studied and the estimated based on the primary & secondary research.
In this particular report from the supply side Data Library Research has conducted primary surveys (interviews) with the key level executives (VP, CEO’s, Marketing Director, Business Development Manager and SOFT) of the companies that active & prominent as well as the midsized organization
FIGURE 1: DLR RESEARH PROCESS
Extensive primary research was conducted to gain a deeper insight of the market and industry performance. The analysis is based on both primary and secondary research as well as years of professional expertise in the respective industries.
In addition to analysing current and historical trends, our analysts predict where the market is headed over the next five years.
It varies by segment for these categories geographically presented in the list of market tables. Speaking about this particular report we have conducted primary surveys (interviews) with the key level executives (VP, CEO’s, Marketing Director, Business Development Manager and many more) of the major players active in the market.
Secondary ResearchSecondary research was mainly used to collect and identify information useful for the extensive, technical, market-oriented, and Friend’s study of the Global Extra Neutral Alcohol. It was also used to obtain key information about major players, market classification and segmentation according to the industry trends, geographical markets, and developments related to the market and technology perspectives. For this study, analysts have gathered information from various credible sources, such as annual reports, sec filings, journals, white papers, SOFT presentations, and company web sites.
Market Size EstimationBoth, top-down and bottom-up approaches were used to estimate and validate the size of the Global market and to estimate the size of various other dependent submarkets in the overall Extra Neutral Alcohol. The key players in the market were identified through secondary research and their market contributions in the respective geographies were determined through primary and secondary research.
Forecast Model