Bicycle Apparel Market Overview and Analysis:

The Bicycle apparel Market is valued at around USD 5.5 billion in 2025 and expected to grow at a CAGR of 4.8%, reaching approximately. USD 8 billion by 2032.

Bicycle apparel refers to clothing and gear designed specifically for cycling, optimized for comfort, performance, safety, and durability; it includes jerseys, bib shorts, shorts, jackets, windbreakers, base layers, gloves, socks, caps, and specialized footwear that fit well on a bike, wick moisture, manage temperature, reduce chafing, and minimize wind resistance, along with protective/functional items such as padded shorts, knee/elbow pads (in some disciplines), eyewear, reflective or high-visibility gear, and weather-appropriate outerwear (helmet is essential but not apparel); it employs technical fabrics with features like moisture-wicking, breathability, stretch, UV protection, anti-odor treatments, and flatlock seams, with disciplines spanning road, mountain, gravel, cyclocross, BMX, urban commuting, and triathlon, all aimed at enhancing comfort, aerodynamics, temperature regulation, and safety.

Bicycle Apparel Market Latest Trends:

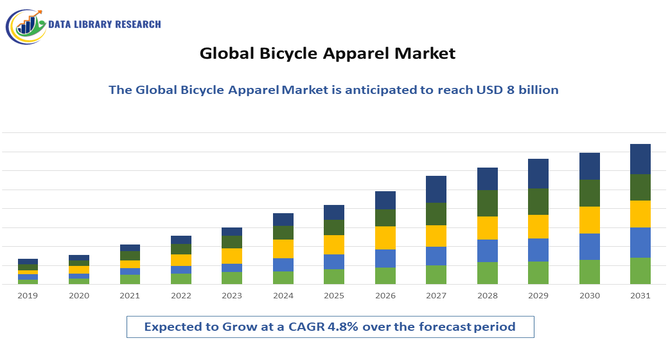
The bicycle apparel market is growing as more people take up cycling for fitness, commuting, and recreation. Riders are looking for clothes made with advanced fabrics that keep them cool, dry, and comfortable, while also preferring eco-friendly and sustainable materials. Brands are focusing on online sales, customization, and stylish designs that can be worn both on and off the bike. The market is also benefiting from more women and young riders joining the sport. However, companies face challenges like high fabric costs, supply chain issues, and the need to offer better sizing for different body types.

Segmentation:

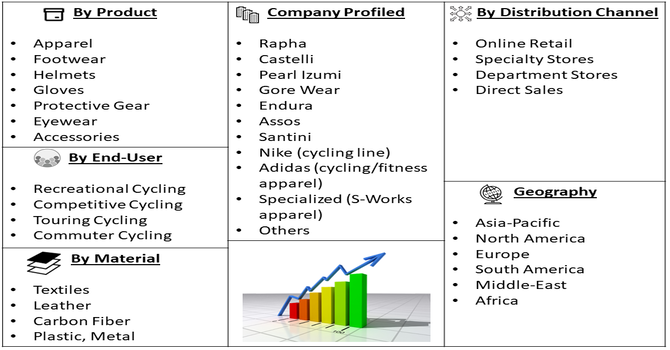
The bicycle apparel market segmented by Product Category (Apparel: Jerseys, Bibs/Shorts, Jackets, Base Layers, Gloves, Socks; Accessories: Caps, Eyewear, Helmets; Footwear; And Protection/Outerwear), Technical Features (Comfort-Fit, Aerodynamic Design, Weatherproofing, Moisture Management, UV Protection, and Durability), Rider Type (Enthusiasts, Casual Riders, and Professional/Competitive Athletes), Distribution Channel (E-Commerce Direct-To-Consumer, Specialty Bike Shops, Sporting Goods Retailers, and Mass-Market Retailers); and Geography (North America, Europe, Asia-Pacific, Middle East and Africa, and South America). The report provides the value (in USD million) for the above segments.

Market Drivers:

  • Rising Participation in Cycling Across Demographics

Rising participation in cycling across demographics is a key driver of the bicycle apparel market, supported by growing interest in fitness, urban commuting, and sustainable mobility. A study published in the Journal of Transport & Health reported that while 57% of surveyed participants in Greater Melbourne owned a bike, 78% fell into the “Interested but Concerned” category, indicating strong latent demand that could be unlocked with safer cycling infrastructure. This shows that interest in cycling extends well beyond current active riders, including significant interest among women and residents in outer urban areas. As participation grows across casual, recreational, and professional cyclists, the demand for bicycle apparel is set to expand, thereby driving the growth of the studied market.

  • Innovations in Materials and Design

Innovations in materials and design are fueling the growth of the bicycle apparel market by making cycling gear more functional, comfortable, and appealing to a wider audience. New fabrics that are lightweight, breathable, stretchable, moisture-wicking, and weatherproof are enhancing rider performance while ensuring comfort in different conditions. Features like ergonomic padding, gripper hems, and moisture channels add further value, encouraging cyclists to invest in premium gear. For instance, in September 2025, eVent® Fabrics’ launched PFAS-free stormburstLT laminate, a super-light, highly breathable, and waterproof technology, now introduced to cycling through a partnership with Italy’s Alé Cycling. This marks a significant step in bringing cutting-edge, eco-friendly fabric innovation to riders. Such advancements not only increase consumer willingness to spend more per rider but also expand the market into new categories, from professional-grade apparel to sustainable lifestyle cycling wear.

Market Restraints:

  • High Cost of Advanced Performance Fabrics and Technologies

The high cost of advanced performance fabrics and technologies makes premium cycling gear less accessible to price-sensitive consumers. While innovations like breathable laminates, moisture-wicking materials, and ergonomic designs enhance performance and comfort, they also increase production costs, leading to higher retail prices. This can limit adoption among casual or entry-level riders who may prioritize affordability over technical features, thereby slowing overall market penetration in emerging and cost-conscious segments.

Social Economic Impact On Bicycle Apparel Market

The socio-economic impact on the bicycle apparel market has been significant, shaped by both pre- and post-COVID trends. Before the pandemic, cycling was already gaining traction as a lifestyle choice, driven by rising health consciousness, urban mobility needs, and the push toward eco-friendly transportation. Post-COVID, this trend accelerated as lockdowns and public transport concerns spurred higher adoption of cycling for commuting, fitness, and recreation.

The surge in participation boosted demand for comfortable, performance-oriented, and stylish apparel, while also widening the consumer base across genders, age groups, and income levels. At the same time, economic disruptions created cost sensitivities in some segments, influencing purchasing decisions and reinforcing demand for affordable as well as premium options. Thus, overall, the shift has positioned cycling apparel as both a functional necessity and a lifestyle product, linking it closely to broader socio-economic priorities around health, sustainability, and urban living.

Segmental Analysis

  • The jerseys segment is expected to witness the highest growth over the forecast period

Jerseys segment is expected to witness the highest growth over the forecast period as they are a staple for both casual and professional cyclists. Designed with lightweight, breathable, and moisture-wicking fabrics, jerseys enhance comfort and performance during long rides. The growing popularity of cycling for fitness, commuting, and leisure is driving higher demand for stylish yet functional jerseys. Additionally, innovations like aerodynamic fits, UV protection, and customizable designs are attracting a wider consumer base. With cycling culture becoming more mainstream and riders willing to invest in apparel that balances comfort and performance, jerseys are set to lead the market’s growth. Weatherproofing segment is expected to witness highest growth over the forecast period

The weatherproofing segment is expected to witness the highest growth over the forecast period, driven by increasing demand for cycling apparel that provides protection in varied climates. Cyclists are seeking gear that ensures comfort and safety in rain, wind, and fluctuating temperatures, making waterproof and windproof fabrics a priority. The introduction of advanced, lightweight, and breathable laminates—such as PFAS-free innovations—has further boosted interest in this category. As cycling expands from recreational activity to daily commuting, weatherproof apparel is becoming essential, pushing consumers to spend more on high-performance gear. This growing emphasis on all-weather protection will make weatherproofing a key growth driver. The 

  • Professional/Competitive Athletes segment is expected to witness the highest growth over the forecast period

Professional/Competitive Athletes segment is expected to witness the highest growth over the forecast period as the demand for specialized, performance-driven gear continues to rise. Competitive cyclists require apparel designed with aerodynamic fits, ergonomic padding, and advanced moisture-control technologies to maximize performance and comfort. Sponsorships, brand endorsements, and cycling events are further fueling the demand for high-quality gear in this segment. Additionally, innovations in lightweight and weatherproof fabrics are being rapidly adopted by professionals, setting trends that influence the broader market. As cycling gains recognition as a global sport, apparel tailored to professional athletes is expected to experience strong, sustained growth.

  • Sporting Goods Retailers segment is expected to witness the highest growth over the forecast period

Sporting Goods Retailers segment is expected to witness the highest growth over the forecast period due to their ability to offer consumers a wide range of products combined with in-store expertise. These retailers provide a one-stop destination where customers can try on apparel, assess fit, and receive personalized recommendations, which is especially important in performance-driven categories like cycling wear. Moreover, retailers are increasingly integrating digital platforms and omnichannel strategies, blending convenience with hands-on experience. With rising participation in cycling and the need for both premium and affordable apparel options, sporting goods retailers are positioned to capture significant growth in sales.

  • North America region is expected to witness the highest growth over the forecast period

North America region is expected to witness the highest growth over the forecast period, supported by rising health awareness, growing interest in recreational cycling, and strong infrastructure development in urban areas. For instance, in September 2025, PotisEdge signed a landmark agreement with Lion Power at RE+ 2025 in Las Vegas, strengthening collaboration on cutting-edge energy solutions for the material handling sector. Such technological advancements across industries reflect the region’s focus on innovation and sustainability, which is also positively shaping consumer expectations and demand in the cycling apparel market.

Moreover, the U.S. and Canada are witnessing an increase in cycling adoption for both commuting and fitness, creating higher demand for advanced apparel. The region’s consumers also show a strong willingness to invest in premium, innovative, and sustainable products, which boosts market expansion. Additionally, the presence of leading global brands and active cycling communities supports growth. With a growing culture of outdoor sports and lifestyle cycling, North America is set to lead.

Bicycle Apparel Market Competitive Landscape:

The bicycle apparel market is characterized by a highly competitive landscape, with both global and regional players vying for a share of the growing demand. Major international brands like Rapha, Castelli, Assos, and Giro have established themselves as industry leaders, leveraging their expertise in innovative fabric technologies, aerodynamic designs, and exceptional quality to cater to the needs of performance-oriented cyclists. These established players often command premium prices and enjoy strong brand loyalty among their customer base. However, the market has also seen the emergence of more affordable, mid-range apparel brands that offer competitive pricing and seek to capture a wider consumer segment. Regional players, particularly in emerging markets, are increasingly gaining traction by catering to local preferences and offering value-for-money options. Ongoing product innovation, strategic partnerships, and effective marketing campaigns are critical for players to maintain their competitive edge and stay ahead of the curve in this dynamic and rapidly evolving market.

Here are 10 major players in the bicycle apparel market:

  • Rapha
  • Castelli
  • Pearl Izumi
  • Gore Wear
  • Endura
  • Assos
  • Santini
  • Nike (cycling line)
  • Adidas (cycling/fitness apparel)
  • Specialized (S-Works apparel)

Recent Developments:

  • In September 2025, the cycling apparel brand Swrve, announced that it plans to relaunch and return to the market, by giving time to redesign product lines, rebuild supply chains, and reestablish go-to-market plans.
  • In September 2024, Lolë acquired Louis Garneau Sports, adding Garneau, Sugoi, and Sombrio to its portfolio. The deal accelerates Lolë’s expansion into cycling and performance gear, expanding beyond premium athletic wear. This acquisition had diversified its product lines, enhanced innovation, and strengthened the company’s global footprint. The integration has lead to delivering a more comprehensive offering to retailers and consumers, positioning Lolë to capture growing demand for sport-focused clothing and equipment amid a competitive market for premium outdoor and athletic brands.


Frequently Asked Questions (FAQ) :

Q1. What are the main growth-driving factors for this market?

The growing popularity of cycling as a mode of transportation and recreational activity, coupled with increased health and fitness awareness, are the primary drivers of the bicycle apparel market. Technological advancements in fabrics and design also contribute to market growth.

Q2. What are the main restraining factors for this market?

The high costs of specialized bicycle apparel, along with the availability of counterfeit products, can hinder the market's growth. Lack of awareness about the benefits of using proper cycling attire in some regions may also limit market expansion.

Q3. Which segment is expected to witness high growth?

The performance-oriented segment, including cycling jerseys, shorts, and accessories designed for enhanced comfort and aerodynamics, is expected to witness the highest growth in the bicycle apparel market.

Q4. Who are the top major players for this market?

Some of the leading players in the bicycle apparel market include Rapha, Castelli, Assos, Giro, and Pearl Izumi, known for their innovative and high-quality cycling-specific apparel and accessories.

Q5. Which country is the largest player?

The United States is the largest market for bicycle apparel, driven by the country's cycling culture, presence of major brands, and growing popularity of cycling as a fitness and recreational activity.

Bicycle Apparel MARKET STUDY GLOBAL MARKET ANALYSIS, INSIGHTS AND FORECAST, 2022-2029

    1. Introduction

    • 1.1. Research Scope
    • 1.2. Market Segmentation
    • 1.3. Research Methodology
    • 1.4. Definitions and Assumptions

    2. Executive Summary

      3. Market Dynamics

      • 3.1. Market Drivers
      • 3.2. Market Restraints
      • 3.3. Market Opportunities

      4. Key Insights

      • 4.1. Key Emerging Trends – For Major Countries
      • 4.2. Latest Technological Advancement
      • 4.3. Regulatory Landscape
      • 4.4. Industry SWOT Analysis
      • 4.5. Porters Five Forces Analysis

      5. Global Bicycle Apparel Market Analysis (USD Billion), Insights and Forecast, 2018-2029

      • 5.1. Key Findings / Summary
      • 5.2. Market Analysis, Insights and Forecast – By Segment 1
        • 5.2.1. Sub-Segment 1
        • 5.2.2. Sub-Segment 2
      • 5.3. Market Analysis, Insights and Forecast – By Segment 2
        • 5.3.1. Sub-Segment 1
        • 5.3.2. Sub-Segment 2
        • 5.3.3. Sub-Segment 3
        • 5.3.4. Others
      • 5.4. Market Analysis, Insights and Forecast – By Segment 3
        • 5.4.1. Sub-Segment 1
        • 5.4.2. Sub-Segment 2
        • 5.4.3. Sub-Segment 3
        • 5.4.4. Others
      • 5.5. Market Analysis, Insights and Forecast – By Region
        • 5.5.1. North America
        • 5.5.2. Latin America
        • 5.5.3. Europe
        • 5.5.4. Asia Pacific
        • 5.5.5. Middle East and Africa

      6. North America Bicycle Apparel Market Analysis (USD Billion), Insights and Forecast, 2018-2029

      • 6.1. Key Findings / Summary
      • 6.2. Market Analysis, Insights and Forecast – By Segment 1
        • 6.2.1. Sub-Segment 1
        • 6.2.2. Sub-Segment 2
      • 6.3. Market Analysis, Insights and Forecast – By Segment 2
        • 6.3.1. Sub-Segment 1
        • 6.3.2. Sub-Segment 2
        • 6.3.3. Sub-Segment 3
        • 6.3.4. Others
      • 6.4. Market Analysis, Insights and Forecast – By Segment 3
        • 6.4.1. Sub-Segment 1
        • 6.4.2. Sub-Segment 2
        • 6.4.3. Sub-Segment 3
        • 6.4.4. Others
      • 6.5. Market Analysis, Insights and Forecast – By Country
        • 6.5.1. U.S.
        • 6.5.2. Canada

      7. Latin America Bicycle Apparel Market Analysis (USD Billion), Insights and Forecast, 2018-2029

      • 7.1. Key Findings / Summary
      • 7.2. Market Analysis, Insights and Forecast – By Segment 1
        • 7.2.1. Sub-Segment 1
        • 7.2.2. Sub-Segment 2
      • 7.3. Market Analysis, Insights and Forecast – By Segment 2
        • 7.3.1. Sub-Segment 1
        • 7.3.2. Sub-Segment 2
        • 7.3.3. Sub-Segment 3
        • 7.3.4. Others
      • 7.4. Market Analysis, Insights and Forecast – By Segment 3
        • 7.4.1. Sub-Segment 1
        • 7.4.2. Sub-Segment 2
        • 7.4.3. Sub-Segment 3
        • 7.4.4. Others
      • 7.5. Insights and Forecast – By Country
        • 7.5.1. Brazil
        • 7.5.2. Mexico
        • 7.5.3. Rest of Latin America

      8. Europe Bicycle Apparel Market Analysis (USD Billion), Insights and Forecast, 2018-2029

      • 8.1. Key Findings / Summary
      • 8.2. Market Analysis, Insights and Forecast – By Segment 1
        • 8.2.1. Sub-Segment 1
        • 8.2.2. Sub-Segment 2
      • 8.3. Market Analysis, Insights and Forecast – By Segment 2
        • 8.3.1. Sub-Segment 1
        • 8.3.2. Sub-Segment 2
        • 8.3.3. Sub-Segment 3
        • 8.3.4. Others
      • 8.4. Market Analysis, Insights and Forecast – By Segment 3
        • 8.4.1. Sub-Segment 1
        • 8.4.2. Sub-Segment 2
        • 8.4.3. Sub-Segment 3
        • 8.4.4. Others
      • 8.5. Market Analysis, Insights and Forecast – By Country
        • 8.5.1. UK
        • 8.5.2. Germany
        • 8.5.3. France
        • 8.5.4. Italy
        • 8.5.5. Spain
        • 8.5.6. Russia
        • 8.5.7. Rest of Europe

      9. Asia Pacific Bicycle Apparel Market Analysis (USD Billion), Insights and Forecast, 2018-2029

      • 9.1. Key Findings / Summary
      • 9.2. Market Analysis, Insights and Forecast – By Segment 1
        • 9.2.1. Sub-Segment 1
        • 9.2.2. Sub-Segment 2
      • 9.3. Market Analysis, Insights and Forecast – By Segment 2
        • 9.3.1. Sub-Segment 1
        • 9.3.2. Sub-Segment 2
        • 9.3.3. Sub-Segment 3
        • 9.3.4. Others
      • 9.4. Market Analysis, Insights and Forecast – By Segment 3
        • 9.4.1. Sub-Segment 1
        • 9.4.2. Sub-Segment 2
        • 9.4.3. Sub-Segment 3
        • 9.4.4. Others
      • 9.5. Market Analysis, Insights and Forecast – By Country
        • 9.5.1. China
        • 9.5.2. India
        • 9.5.3. Japan
        • 9.5.4. Australia
        • 9.5.5. South East Asia
        • 9.5.6. Rest of Asia Pacific

      10. Middle East & Africa Bicycle Apparel Market Analysis (USD Billion), Insights and Forecast, 2018-2029

      • 10.1. Key Findings / Summary
      • 10.2. Market Analysis, Insights and Forecast – By Segment 1
        • 10.2.1. Sub-Segment 1
        • 10.2.2. Sub-Segment 2
      • 10.3. Market Analysis, Insights and Forecast – By Segment 2
        • 10.3.1. Sub-Segment 1
        • 10.3.2. Sub-Segment 2
        • 10.3.3. Sub-Segment 3
        • 10.3.4. Others
      • 10.4. Market Analysis, Insights and Forecast – By Segment 3
        • 10.4.1. Sub-Segment 1
        • 10.4.2. Sub-Segment 2
        • 10.4.3. Sub-Segment 3
        • 10.4.4. Others
      • 10.5. Market Analysis, Insights and Forecast – By Country
        • 10.5.1. GCC
        • 10.5.2. South Africa
        • 10.5.3. Rest of Middle East & Africa

      11. Competitive Analysis

      • 11.1. Company Market Share Analysis, 2018
      • 11.2. Key Industry Developments
      • 11.3. Company Profile
        • 11.3.1. Company 1
          • 11.3.1.1. Business Overview
          • 11.3.1.2. Segment 1 & Service Offering
          • 11.3.1.3. Overall Revenue
          • 11.3.1.4. Geographic Presence
          • 11.3.1.5. Recent Development
        *Similar details will be provided for the following companies
        • 11.3.2. Company 2
        • 11.3.3. Company 3
        • 11.3.4. Company 4
        • 11.3.5. Company 5
        • 11.3.6. Company 6
        • 11.3.7. Company 7
        • 11.3.8. Company 8
        • 11.3.9. Company 9
        • 11.3.10. Company 10
        • 11.3.11. Company 11
        • 11.3.12. Company 12
      List of Figures

      Figure 1: Global Bicycle Apparel Market Revenue Breakdown (USD Billion, %) by Region, 2022 & 2029
      Figure 2: Global Bicycle Apparel Market Value Share (%), By Segment 1, 2022 & 2029
      Figure 3: Global Bicycle Apparel Market Forecast (USD Billion), by Sub-Segment 1, 2018-2029
      Figure 4: Global Bicycle Apparel Market Forecast (USD Billion), by Sub-Segment 2, 2018-2029
      Figure 5: Global Bicycle Apparel Market Value Share (%), By Segment 2, 2022 & 2029
      Figure 6: Global Bicycle Apparel Market Forecast (USD Billion), by Sub-Segment 1, 2018-2029
      Figure 7: Global Bicycle Apparel Market Forecast (USD Billion), by Sub-Segment 2, 2018-2029
      Figure 8: Global Bicycle Apparel Market Forecast (USD Billion), by Sub-Segment 3, 2018-2029
      Figure 9: Global Bicycle Apparel Market Forecast (USD Billion), by Others, 2018-2029
      Figure 10: Global Bicycle Apparel Market Value Share (%), By Segment 3, 2022 & 2029
      Figure 11: Global Bicycle Apparel Market Forecast (USD Billion), by Sub-Segment 1, 2018-2029
      Figure 12: Global Bicycle Apparel Market Forecast (USD Billion), by Sub-Segment 2, 2018-2029
      Figure 13: Global Bicycle Apparel Market Forecast (USD Billion), by Sub-Segment 3, 2018-2029
      Figure 14: Global Bicycle Apparel Market Forecast (USD Billion), by Others, 2018-2029
      Figure 15: Global Bicycle Apparel Market Value (USD Billion), by Region, 2022 & 2029
      Figure 16: North America Bicycle Apparel Market Value Share (%), By Segment 1, 2022 & 2029
      Figure 17: North America Bicycle Apparel Market Forecast (USD Billion), by Sub-Segment 1, 2018-2029
      Figure 18: North America Bicycle Apparel Market Forecast (USD Billion), by Sub-Segment 2, 2018-2029
      Figure 19: North America Bicycle Apparel Market Value Share (%), By Segment 2, 2022 & 2029
      Figure 20: North America Bicycle Apparel Market Forecast (USD Billion), by Sub-Segment 1, 2018-2029
      Figure 21: North America Bicycle Apparel Market Forecast (USD Billion), by Sub-Segment 2, 2018-2029
      Figure 22: North America Bicycle Apparel Market Forecast (USD Billion), by Sub-Segment 3, 2018-2029
      Figure 23: North America Bicycle Apparel Market Forecast (USD Billion), by Others, 2018-2029
      Figure 24: North America Bicycle Apparel Market Value Share (%), By Segment 3, 2022 & 2029
      Figure 25: North America Bicycle Apparel Market Forecast (USD Billion), by Sub-Segment 1, 2018-2029
      Figure 26: North America Bicycle Apparel Market Forecast (USD Billion), by Sub-Segment 2, 2018-2029
      Figure 27: North America Bicycle Apparel Market Forecast (USD Billion), by Sub-Segment 3, 2018-2029
      Figure 28: North America Bicycle Apparel Market Forecast (USD Billion), by Others, 2018-2029
      Figure 29: North America Bicycle Apparel Market Forecast (USD Billion), by U.S., 2018-2029
      Figure 30: North America Bicycle Apparel Market Forecast (USD Billion), by Canada, 2018-2029
      Figure 31: Latin America Bicycle Apparel Market Value Share (%), By Segment 1, 2022 & 2029
      Figure 32: Latin America Bicycle Apparel Market Forecast (USD Billion), by Sub-Segment 1, 2018-2029
      Figure 33: Latin America Bicycle Apparel Market Forecast (USD Billion), by Sub-Segment 2, 2018-2029
      Figure 34: Latin America Bicycle Apparel Market Value Share (%), By Segment 2, 2022 & 2029
      Figure 35: Latin America Bicycle Apparel Market Forecast (USD Billion), by Sub-Segment 1, 2018-2029
      Figure 36: Latin America Bicycle Apparel Market Forecast (USD Billion), by Sub-Segment 2, 2018-2029
      Figure 37: Latin America Bicycle Apparel Market Forecast (USD Billion), by Sub-Segment 3, 2018-2029
      Figure 38: Latin America Bicycle Apparel Market Forecast (USD Billion), by Others, 2018-2029
      Figure 39: Latin America Bicycle Apparel Market Value Share (%), By Segment 3, 2022 & 2029
      Figure 40: Latin America Bicycle Apparel Market Forecast (USD Billion), by Sub-Segment 1, 2018-2029
      Figure 41: Latin America Bicycle Apparel Market Forecast (USD Billion), by Sub-Segment 2, 2018-2029
      Figure 42: Latin America Bicycle Apparel Market Forecast (USD Billion), by Sub-Segment 3, 2018-2029
      Figure 43: Latin America Bicycle Apparel Market Forecast (USD Billion), by Others, 2018-2029
      Figure 44: Latin America Bicycle Apparel Market Forecast (USD Billion), by Brazil, 2018-2029
      Figure 45: Latin America Bicycle Apparel Market Forecast (USD Billion), by Mexico, 2018-2029
      Figure 46: Latin America Bicycle Apparel Market Forecast (USD Billion), by Rest of Latin America, 2018-2029
      Figure 47: Europe Bicycle Apparel Market Value Share (%), By Segment 1, 2022 & 2029
      Figure 48: Europe Bicycle Apparel Market Forecast (USD Billion), by Sub-Segment 1, 2018-2029
      Figure 49: Europe Bicycle Apparel Market Forecast (USD Billion), by Sub-Segment 2, 2018-2029
      Figure 50: Europe Bicycle Apparel Market Value Share (%), By Segment 2, 2022 & 2029
      Figure 51: Europe Bicycle Apparel Market Forecast (USD Billion), by Sub-Segment 1, 2018-2029
      Figure 52: Europe Bicycle Apparel Market Forecast (USD Billion), by Sub-Segment 2, 2018-2029
      Figure 53: Europe Bicycle Apparel Market Forecast (USD Billion), by Sub-Segment 3, 2018-2029
      Figure 54: Europe Bicycle Apparel Market Forecast (USD Billion), by Others, 2018-2029
      Figure 55: Europe Bicycle Apparel Market Value Share (%), By Segment 3, 2022 & 2029
      Figure 56: Europe Bicycle Apparel Market Forecast (USD Billion), by Sub-Segment 1, 2018-2029
      Figure 57: Europe Bicycle Apparel Market Forecast (USD Billion), by Sub-Segment 2, 2018-2029
      Figure 58: Europe Bicycle Apparel Market Forecast (USD Billion), by Sub-Segment 3, 2018-2029
      Figure 59: Europe Bicycle Apparel Market Forecast (USD Billion), by Others, 2018-2029
      Figure 60: Europe Bicycle Apparel Market Forecast (USD Billion), by U.K., 2018-2029
      Figure 61: Europe Bicycle Apparel Market Forecast (USD Billion), by Germany, 2018-2029
      Figure 62: Europe Bicycle Apparel Market Forecast (USD Billion), by France, 2018-2029
      Figure 63: Europe Bicycle Apparel Market Forecast (USD Billion), by Italy, 2018-2029
      Figure 64: Europe Bicycle Apparel Market Forecast (USD Billion), by Spain, 2018-2029
      Figure 65: Europe Bicycle Apparel Market Forecast (USD Billion), by Russia, 2018-2029
      Figure 66: Europe Bicycle Apparel Market Forecast (USD Billion), by Rest of Europe, 2018-2029
      Figure 67: Asia Pacific Bicycle Apparel Market Value Share (%), By Segment 1, 2022 & 2029
      Figure 68: Asia Pacific Bicycle Apparel Market Forecast (USD Billion), by Sub-Segment 1, 2018-2029
      Figure 69: Asia Pacific Bicycle Apparel Market Forecast (USD Billion), by Sub-Segment 2, 2018-2029
      Figure 70: Asia Pacific Bicycle Apparel Market Value Share (%), By Segment 2, 2022 & 2029
      Figure 71: Asia Pacific Bicycle Apparel Market Forecast (USD Billion), by Sub-Segment 1, 2018-2029
      Figure 72: Asia Pacific Bicycle Apparel Market Forecast (USD Billion), by Sub-Segment 2, 2018-2029
      Figure 73: Asia Pacific Bicycle Apparel Market Forecast (USD Billion), by Sub-Segment 3, 2018-2029
      Figure 74: Asia Pacific Bicycle Apparel Market Forecast (USD Billion), by Others, 2018-2029
      Figure 75: Asia Pacific Bicycle Apparel Market Value Share (%), By Segment 3, 2022 & 2029
      Figure 76: Asia Pacific Bicycle Apparel Market Forecast (USD Billion), by Sub-Segment 1, 2018-2029
      Figure 77: Asia Pacific Bicycle Apparel Market Forecast (USD Billion), by Sub-Segment 2, 2018-2029
      Figure 78: Asia Pacific Bicycle Apparel Market Forecast (USD Billion), by Sub-Segment 3, 2018-2029
      Figure 79: Asia Pacific Bicycle Apparel Market Forecast (USD Billion), by Others, 2018-2029
      Figure 80: Asia Pacific Bicycle Apparel Market Forecast (USD Billion), by China, 2018-2029
      Figure 81: Asia Pacific Bicycle Apparel Market Forecast (USD Billion), by India, 2018-2029
      Figure 82: Asia Pacific Bicycle Apparel Market Forecast (USD Billion), by Japan, 2018-2029
      Figure 83: Asia Pacific Bicycle Apparel Market Forecast (USD Billion), by Australia, 2018-2029
      Figure 84: Asia Pacific Bicycle Apparel Market Forecast (USD Billion), by Southeast Asia, 2018-2029
      Figure 85: Asia Pacific Bicycle Apparel Market Forecast (USD Billion), by Rest of Asia Pacific, 2018-2029
      Figure 86: Middle East & Africa Bicycle Apparel Market Value Share (%), By Segment 1, 2022 & 2029
      Figure 87: Middle East & Africa Bicycle Apparel Market Forecast (USD Billion), by Sub-Segment 1, 2018-2029
      Figure 88: Middle East & Africa Bicycle Apparel Market Forecast (USD Billion), by Sub-Segment 2, 2018-2029
      Figure 89: Middle East & Africa Bicycle Apparel Market Value Share (%), By Segment 2, 2022 & 2029
      Figure 90: Middle East & Africa Bicycle Apparel Market Forecast (USD Billion), by Sub-Segment 1, 2018-2029
      Figure 91: Middle East & Africa Bicycle Apparel Market Forecast (USD Billion), by Sub-Segment 2, 2018-2029
      Figure 92: Middle East & Africa Bicycle Apparel Market Forecast (USD Billion), by Sub-Segment 3, 2018-2029
      Figure 93: Middle East & Africa Bicycle Apparel Market Forecast (USD Billion), by Others, 2018-2029
      Figure 94: Middle East & Africa Bicycle Apparel Market Value Share (%), By Segment 3, 2022 & 2029
      Figure 95: Middle East & Africa Bicycle Apparel Market Forecast (USD Billion), by Sub-Segment 1, 2018-2029
      Figure 96: Middle East & Africa Bicycle Apparel Market Forecast (USD Billion), by Sub-Segment 2, 2018-2029
      Figure 97: Middle East & Africa Bicycle Apparel Market Forecast (USD Billion), by Sub-Segment 3, 2018-2029
      Figure 98: Middle East & Africa Bicycle Apparel Market Forecast (USD Billion), by Others, 2018-2029
      Figure 99: Middle East & Africa Bicycle Apparel Market Forecast (USD Billion), by GCC, 2018-2029
      Figure 100: Middle East & Africa Bicycle Apparel Market Forecast (USD Billion), by South Africa, 2018-2029
      Figure 101: Middle East & Africa Bicycle Apparel Market Forecast (USD Billion), by Rest of Middle East & Africa, 2018-2029 
      List of Tables
      Table 1: Global Bicycle Apparel Market Revenue (USD Billion) Forecast, by Segment 1, 2018-2029
      Table 2: Global Bicycle Apparel Market Revenue (USD Billion) Forecast, by Segment 2, 2018-2029
      Table 3: Global Bicycle Apparel Market Revenue (USD Billion) Forecast, by Segment 3, 2018-2029
      Table 4: Global Bicycle Apparel Market Revenue (USD Billion) Forecast, by Region, 2018-2029
      Table 5: North America Bicycle Apparel Market Revenue (USD Billion) Forecast, by Segment 1, 2018-2029
      Table 6: North America Bicycle Apparel Market Revenue (USD Billion) Forecast, by Segment 2, 2018-2029
      Table 7: North America Bicycle Apparel Market Revenue (USD Billion) Forecast, by Segment 3, 2018-2029
      Table 8: North America Bicycle Apparel Market Revenue (USD Billion) Forecast, by Country, 2018-2029
      Table 9: Europe Bicycle Apparel Market Revenue (USD Billion) Forecast, by Segment 1, 2018-2029
      Table 10: Europe Bicycle Apparel Market Revenue (USD Billion) Forecast, by Segment 2, 2018-2029
      Table 11: Europe Bicycle Apparel Market Revenue (USD Billion) Forecast, by Segment 3, 2018-2029
      Table 12: Europe Bicycle Apparel Market Revenue (USD Billion) Forecast, by Country, 2018-2029
      Table 13: Latin America Bicycle Apparel Market Revenue (USD Billion) Forecast, by Segment 1, 2018-2029
      Table 14: Latin America Bicycle Apparel Market Revenue (USD Billion) Forecast, by Segment 2, 2018-2029
      Table 15: Latin America Bicycle Apparel Market Revenue (USD Billion) Forecast, by Segment 3, 2018-2029
      Table 16: Latin America Bicycle Apparel Market Revenue (USD Billion) Forecast, by Country, 2018-2029
      Table 17: Asia Pacific Bicycle Apparel Market Revenue (USD Billion) Forecast, by Segment 1, 2018-2029
      Table 18: Asia Pacific Bicycle Apparel Market Revenue (USD Billion) Forecast, by Segment 2, 2018-2029
      Table 19: Asia Pacific Bicycle Apparel Market Revenue (USD Billion) Forecast, by Segment 3, 2018-2029
      Table 20: Asia Pacific Bicycle Apparel Market Revenue (USD Billion) Forecast, by Country, 2018-2029
      Table 21: Middle East & Africa Bicycle Apparel Market Revenue (USD Billion) Forecast, by Segment 1, 2018-2029
      Table 22: Middle East & Africa Bicycle Apparel Market Revenue (USD Billion) Forecast, by Segment 2, 2018-2029
      Table 23: Middle East & Africa Bicycle Apparel Market Revenue (USD Billion) Forecast, by Segment 3, 2018-2029
      Table 24: Middle East & Africa Bicycle Apparel Market Revenue (USD Billion) Forecast, by Country, 2018-2029
      Research Process

      Data Library Research are conducted by industry experts who offer insight on industry structure, market segmentations technology assessment and competitive landscape (CL), and penetration, as well as on emerging trends. Their analysis is based on primary interviews (~ 80%) and secondary research (~ 20%) as well as years of professional expertise in their respective industries. Adding to this, by analysing historical trends and current market positions, our analysts predict where the market will be headed for the next five years. Furthermore, the varying trends of segment & categories geographically presented are also studied and the estimated based on the primary & secondary research.

      In this particular report from the supply side Data Library Research has conducted primary surveys (interviews) with the key level executives (VP, CEO’s, Marketing Director, Business Development Manager and SOFT) of the companies that active & prominent as well as the midsized organization

      FIGURE 1: DLR RESEARH PROCESS

      research-methodology1

      Primary Research

      Extensive primary research was conducted to gain a deeper insight of the market and industry performance. The analysis is based on both primary and secondary research as well as years of professional expertise in the respective industries.

      In addition to analysing current and historical trends, our analysts predict where the market is headed over the next five years.

      It varies by segment for these categories geographically presented in the list of market tables. Speaking about this particular report we have conducted primary surveys (interviews) with the key level executives (VP, CEO’s, Marketing Director, Business Development Manager and many more) of the major players active in the market.

      Secondary Research

      Secondary research was mainly used to collect and identify information useful for the extensive, technical, market-oriented, and Friend’s study of the Global Extra Neutral Alcohol. It was also used to obtain key information about major players, market classification and segmentation according to the industry trends, geographical markets, and developments related to the market and technology perspectives. For this study, analysts have gathered information from various credible sources, such as annual reports, sec filings, journals, white papers, SOFT presentations, and company web sites.

      Market Size Estimation

      Both, top-down and bottom-up approaches were used to estimate and validate the size of the Global market and to estimate the size of various other dependent submarkets in the overall Extra Neutral Alcohol. The key players in the market were identified through secondary research and their market contributions in the respective geographies were determined through primary and secondary research.

      Forecast Model

      research-methodology2

      Happy to Assist You

      If you have a question?

      info@datalibraryresearch.com

      IND : +91 955 279 0357

      Browse Related Reports