Amines Market Overview and Analysis:

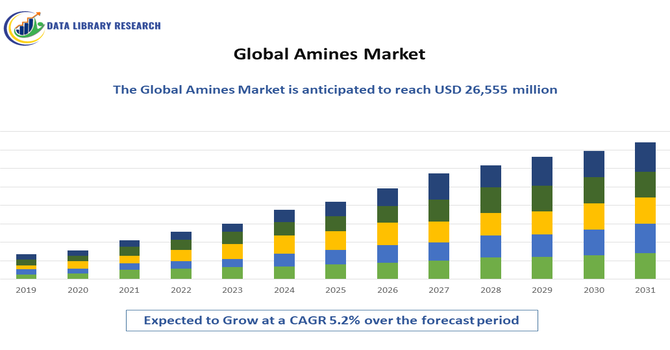
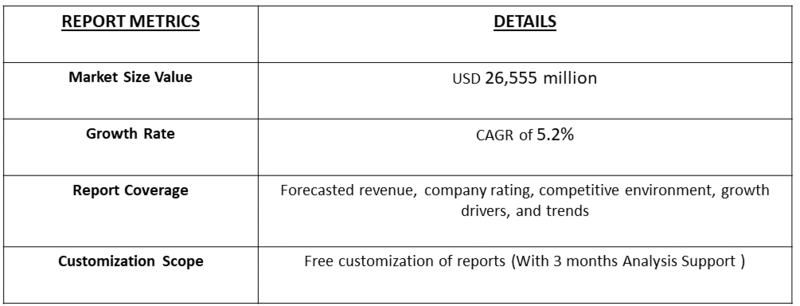
The global amines market, valued at USD 18,927 million in 2025, is projected to grow at a CAGR of 5.2%, reaching approximately and is expected to expand further to around USD 26,555 million by 2032.

Amines are organic compounds derived from ammonia, where one or more hydrogen atoms are replaced by carbon-containing groups. In simple terms, they are molecules that contain nitrogen bonded to hydrogen and/or carbon atoms. Amines are widely used in everyday life and industries due to their versatility. They serve as building blocks for pharmaceuticals, agrochemicals, dyes, and surfactants, and play a critical role in oil and gas treatment, water purification, and chemical manufacturing. Depending on their structure, amines can be classified as primary, secondary, or tertiary. Their chemical properties make them essential for creating products that support health, agriculture, and industrial processes. This steady increase reflects rising demand across key applications such as oil & gas, pharmaceuticals, agrochemicals, and water treatment, driven by industrial growth, technological advancements, and a focus on sustainable and high-performance amine derivatives globally.

Amines Market Latest Trends:

The global amine market is trending toward higher-value specialty and green amine derivatives, driven by demand from polymers, agrochemicals, detergents, and water treatment. Rising stringency of environmental and safety regulations pushes investment in cleaner production processes and lower-emission technologies. Asia-Pacific, led by China and India, fuels growth, while North America and Europe pursue advanced derivatives and recycled content. Consolidation through strategic acquisitions expands capacity and product portfolios, and custom formulations meet specific end-use needs. Volatility in feedstock prices remains a risk, but steady demand in coatings, foams, and agriculture supports a resilient, innovation-driven growth trajectory with emphasis on sustainable, high-performance amines.

Segmentation:

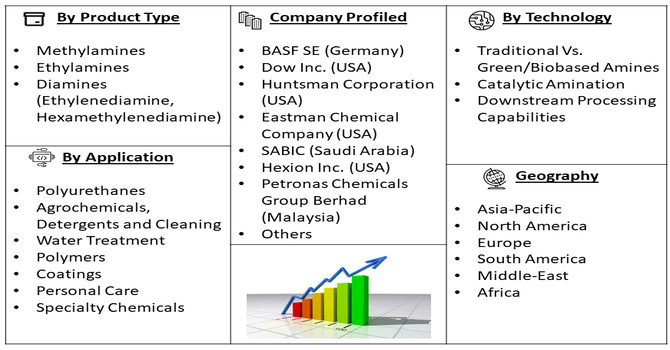
The Global Amine Market can be segmented by Product Type (Methylamines, Ethylamines, and Diamines (Ethylenediamine, Hexamethylenediamine), Application (Polyurethanes, Agrochemicals, Detergents and Cleaning, Water Treatment, Polymers, Coatings, Personal Care, and Specialty Chemicals), Production Technology (Traditional Vs. Green/Biobased Amines, Catalytic Amination, and Downstream Processing Capabilities), and Geography (North America, Europe, Asia-Pacific, Middle East and Africa, and South America). The report provides the value (in USD million) for the above segments.

Market Drivers:

  • Expanding Demand from Agrochemicals and Pharmaceuticals

A major driver of the global amines market is the growing demand from the agrochemical and pharmaceutical sectors. In agriculture, amines are key intermediates in the production of herbicides, insecticides, and fungicides, playing a critical role in improving crop yields and ensuring food security. The push for more efficient, sustainable, and eco-friendly crop protection solutions is fueling higher amine consumption. The pharmaceutical industry also relies heavily on amines for synthesizing active pharmaceutical ingredients (APIs) and drug intermediates, with continuous innovation and the expanding global healthcare sector further supporting demand. For instance, in October 2023, Bayer launched SERENADE SC, a bio-fungicide in Vietnam designed to enhance crop quality and yield while offering a safe and environmentally friendly solution for farmers. Such developments underscore how both agriculture and pharmaceuticals are pivotal in driving the sustained growth and innovation within the global amines market.

  • Growth in Water Treatment and Personal Care Industries

The expanding water treatment and personal care industries represent another significant growth driver for the Global Amine Market. In water treatment, amines are critical as corrosion inhibitors, scale inhibitors, and flocculants, essential for maintaining the integrity of industrial water systems and ensuring the availability of clean water. Growing environmental awareness and stricter regulations regarding water quality worldwide are increasing the adoption of amine-based treatment solutions. Concurrently, the personal care sector utilizes amines extensively in the formulation of surfactants, emulsifiers, and pH adjusters found in shampoos, conditioners, soaps, and cosmetics. The rising global population and increasing consumer spending on personal hygiene and beauty products directly fuel the demand for these amine-derived ingredients, further bolstering market expansion.

Restraints:

  • Volatility in Raw Material Prices and Supply Chain Disruptions

A significant restraint impacting the Global Amine Market is the inherent volatility in raw material prices and the susceptibility to supply chain disruptions. The primary feedstocks for amine production, such as methanol and ammonia, are often derived from crude oil and natural gas. Fluctuations in global energy prices directly influence the cost of these raw materials, leading to unpredictable production expenses for amine manufacturers. This price volatility can affect profit margins and make long-term planning challenging. Furthermore, geopolitical events, logistical challenges, and unexpected plant shutdowns can disrupt the supply chain, leading to shortages and further price instability, thereby hindering consistent market growth and potentially impacting the competitiveness of amine-based products in certain applications.

Social Economic Impact On the Amines Market

The global amines market has had significant socio-economic impacts, influencing both industrial growth and employment. Pre-COVID-19, the market experienced steady expansion driven by rising demand in oil & gas, agrochemicals, pharmaceuticals, and water treatment, supporting job creation across manufacturing, R&D, logistics, and distribution sectors. Rapid industrialization in regions like the Asia-Pacific also contributed to economic development and infrastructure growth. The pandemic, however, caused temporary disruptions in supply chains, production, and global trade, impacting the availability of key raw materials and delaying projects. Post-COVID-19, the market has rebounded strongly, as industries prioritize chemical inputs for essential sectors and governments implement stimulus measures supporting manufacturing and infrastructure development. Increasing adoption of sustainable and high-performance amines has also created new employment opportunities and fostered innovation. Overall, the market’s resilience has contributed to industrial recovery, technological advancement, and economic growth, highlighting its critical socio-economic role across regions.

Segmental Analysis

  • Ethylenediamine Product segment is expected to witness the highest growth over the forecast period

The Ethylenediamine (EDA) product segment is poised for significant expansion due to its versatile and critical roles across numerous industries. EDA is a fundamental building block for a wide array of downstream products, including epoxy curing agents essential for coatings, adhesives, and composites used in construction and automotive sectors. It also finds extensive application in the manufacturing of chelating agents, which are vital for water treatment, detergents, and pulp and paper production. Furthermore, its use in pharmaceuticals as an intermediate and in the production of agrochemicals contributes to its robust demand. The increasing need for high-performance materials and the continuous innovation in applications like fuel additives and lubricants are expected to drive substantial growth for EDA, making it a standout segment.

  • Agrochemicals Application segment is expected to witness the highest growth over the forecast period

The Agrochemicals application segment is projected to experience the highest growth within the amine market, driven by the global imperative to enhance food security and crop yields. Amines are indispensable intermediates in the synthesis of a wide range of pesticides, including herbicides, insecticides, and fungicides. As the world's population continues to grow, the demand for more efficient and effective crop protection solutions intensifies, directly boosting the consumption of amines in this sector. Innovations in developing targeted and environmentally friendlier agrochemicals also rely heavily on amine chemistry. Developing countries, with their expanding agricultural sectors and increasing adoption of modern farming techniques, represent a particularly strong growth market for amine-based agrochemical products.

  • Downstream Processing Capabilities segment is expected to witness the highest growth over the forecast period

The growth in downstream processing capabilities is a critical factor expected to drive the amine market forward. As industries increasingly demand highly specialized and purified amine derivatives for advanced applications, companies are investing heavily in sophisticated processing technologies. This includes enhanced separation techniques, advanced synthesis methods, and stringent quality control measures to produce high-purity amines required for pharmaceuticals, electronics, and specialty polymers. The ability to efficiently convert basic amines into value-added products tailored to specific end-user needs unlocks new market opportunities and drives demand for these more complex amine derivatives. Investments in R&D for novel downstream applications further fuel the need for advanced processing.

  • Asia-Pacific Region Expected to Witness the Highest Growth

The Asia-Pacific region is set to become the fastest-growing market for amines, driven by rapid industrialization, a booming manufacturing sector, and significant infrastructure investments in countries like China, India, and Southeast Asian nations. Rising demand from key industries—including agrochemicals, automotive, construction, and personal care—combined with a growing middle class and increasing disposable incomes, is fueling consumption. Supportive government policies promoting manufacturing and R&D, along with competitive production costs, further strengthen the region’s position as a major growth hub for the global amine market. For instance, in June 2025, Dentsu Inc. and its subsidiary Dentsu Anime Solutions (das) launched a new brand to support the international growth of Japanese anime content. Targeting markets in North America, China, and Southeast Asia, das aims to provide anime-focused global marketing solutions, assisting Japanese companies in overseas expansion while supporting the business growth of local clients. This reflects Asia-Pacific’s dual role as both an industrial and cultural growth engine, thereby contributing to the overall market’s growth.

Amines Market Competitive Landscape:

The global amine market is highly competitive, characterized by the presence of both multinational chemical giants and regional manufacturers. Key players such as BASF, Huntsman Corporation, Dow Chemical, and AkzoNobel focus on expanding production capacities, investing in research and development, and launching specialty amines to cater to industries like oil & gas, pharmaceuticals, and water treatment. Strategic partnerships, mergers, and acquisitions are common as companies aim to strengthen their market presence and geographic reach. Continuous innovation in sustainable and high-performance amine derivatives, along with competitive pricing strategies, enables players to differentiate themselves and capture growth opportunities in this rapidly evolving global market.

Here are 10 major players in the Global Amine Market:  

  • BASF SE (Germany)
  • Dow Inc. (USA)
  • Huntsman Corporation (USA)
  • Eastman Chemical Company (USA)
  • SABIC (Saudi Arabia)
  • Hexion Inc. (USA)
  • Petronas Chemicals Group Berhad (Malaysia)
  • Maruzen Petrochemical Co., Ltd. (Japan)
  • Arkema S.A. (France)
  • Lanxess AG (Germany)

Recent Developments:

  • In August 2025, Kao Corporation inaugurated a new tertiary amine production facility in Pasadena, Texas, with an annual capacity of 20,000 tons. The plant is set to strengthen the company’s ability to reliably supply the growing U.S. market over the mid- to long-term. Local production is expected to enhance supply chain efficiency and reduce transportation-related CO₂ emissions, aligning with sustainability goals. This expansion underscores rising demand for amines in applications such as oil & gas, pharmaceuticals, and water treatment, and is likely to boost the overall growth of the global chemical amine market by improving availability, lowering costs, and supporting environmentally conscious production practices.
  • In February 2025, Indo Amines launched a specialty chemicals plant worth ₹60 crore, according to N.G. Mane, President of the company. The firm is also exploring strategic partnerships to acquire an agrochemical or pharmaceutical API company, signaling its focus on expanding capabilities and strengthening its presence in high-value chemical segments.


Frequently Asked Questions (FAQ) :

Q1. What the main growth driving factors for this market?

The global amine market is primarily driven by rising demand from the agrochemicals sector for pesticide production and from the water treatment industry. Expanding applications in personal care products, pharmaceuticals, and gas treatment further propel growth, supported by industrialization and stringent environmental regulations requiring efficient solvents and adsorbents.

Q2. What are the main restraining factors for this market?

The primary restraints include fluctuating raw material prices, particularly for methanol and ammonia, which impact production costs. Stringent environmental regulations regarding amine production and emissions, along with the potential health hazards associated with certain amines, also pose challenges to market growth and adoption.

Q3. Which segment is expected to witness high growth?

The Ethyleneamines segment is expected to witness high growth. This is due to their extensive use in manufacturing epoxy curing agents, polyamides, chelating agents, and surfactants, driven by strong demand from the construction, automotive, and personal care industries. Their versatility and application breadth are key growth catalysts.

Q4. Who are the top major players for this market?

Top major players in the Global Amine Market include BASF SE, Dow Inc., Huntsman Corporation, Eastman Chemical Company, and SABIC. These companies dominate through extensive product portfolios, global manufacturing presence, and significant R&D investments.

Q5. Which country is the largest player?

The United States often leads in production and consumption due to mature downstream industries, strong chemical manufacturing base, and robust R&D. China follows closely, supported by large-scale industrial activity and expanding specialty chemical sectors.

Amines Market Study Global Market Analysis, Insights and Forecast, 2023-2030

    1. Introduction

    • 1.1. Research Scope
    • 1.2. Market Segmentation
    • 1.3. Research Methodology
    • 1.4. Definitions and Assumptions

    2. Executive Summary

      3. Market Dynamics

      • 3.1. Market Drivers
      • 3.2. Market Restraints
      • 3.3. Market Opportunities

      4. Key Insights

      • 4.1. Key Emerging Trends – For Major Countries
      • 4.2. Latest Technological Advancement
      • 4.3. Regulatory Landscape
      • 4.4. Industry SWOT Analysis
      • 4.5. Porters Five Forces Analysis

      5. Global Amines Market Analysis (USD Billion), Insights and Forecast, 2023-2030

      • 5.1. Key Findings / Summary
      • 5.2. Market Analysis, Insights and Forecast – By Type
        • 5.2.1. Ethanol Amines
        • 5.2.2. Fatty Amines
        • 5.2.3. Alkylamines
        • 5.2.4. Others
      • 5.3. Market Analysis, Insights and Forecast – By Application
        • 5.3.1. Crop Protection
        • 5.3.2. Gas treatment
        • 5.3.3. Personal Care
        • 5.3.4. Water Treatment
        • 5.3.5. Others
      • 5.4. Market Analysis, Insights and Forecast – By Function
        • 5.4.1. Solvent
        • 5.4.2. Chelating Agent
        • 5.4.3. Corrosion Inhibitor
        • 5.4.4. Bleach Activators
        • 5.4.5. Surfactants
      • 5.5. Market Analysis, Insights and Forecast – By Region
        • 5.5.1. North America
        • 5.5.2. Europe
        • 5.5.3. Asia Pacific
        • 5.5.4. Latin America, Middle East, and Africa

      6. North America Amines Market Analysis (USD Billion), Insights and Forecast, 2023-2030

      • 6.1. Key Findings / Summary
      • 6.2. Market Analysis, Insights and Forecast – By Type
        • 6.2.1. Ethanol Amines
        • 6.2.2. Fatty Amines
        • 6.2.3. Alkylamines
        • 6.2.4. Others
      • 6.3. Market Analysis, Insights and Forecast – By Application
        • 6.3.1. Crop Protection
        • 6.3.2. Gas treatment
        • 6.3.3. Personal Care
        • 6.3.4. Water Treatment
        • 6.3.5. Others
      • 6.4. Market Analysis, Insights and Forecast – By Function
        • 6.4.1. Solvent
        • 6.4.2. Chelating Agent
        • 6.4.3. Corrosion Inhibitor
        • 6.4.4. Bleach Activators
        • 6.4.5. Surfactants
      • 6.5. Market Analysis, Insights and Forecast – By Country
        • 6.5.1. U.S.
        • 6.5.2. Canada

      7. Europe Amines Market Analysis (USD Billion), Insights and Forecast, 2023-2030

      • 7.1. Key Findings / Summary
      • 7.2. Market Analysis, Insights and Forecast – By Type
        • 7.2.1. Ethanol Amines
        • 7.2.2. Fatty Amines
        • 7.2.3. Alkylamines
        • 7.2.4. Others
      • 7.3. Market Analysis, Insights and Forecast – By Application
        • 7.3.1. Crop Protection
        • 7.3.2. Gas treatment
        • 7.3.3. Personal Care
        • 7.3.4. Water Treatment
        • 7.3.5. Others
      • 7.4. Market Analysis, Insights and Forecast – By Function
        • 7.4.1. Solvent
        • 7.4.2. Chelating Agent
        • 7.4.3. Corrosion Inhibitor
        • 7.4.4. Bleach Activators
        • 7.4.5. Surfactants
      • 7.5. Market Analysis, Insights and Forecast – By Country
        • 7.5.1. UK
        • 7.5.2. Germany
        • 7.5.3. France
        • 7.5.4. Italy
        • 7.5.5. Spain
        • 7.5.6. Russia
        • 7.5.7. Rest of Europe

      8. Asia Pacific Amines Market Analysis (USD Billion), Insights and Forecast, 2023-2030

      • 8.1. Key Findings / Summary
      • 8.2. Market Analysis, Insights and Forecast – By Type
        • 8.2.1. Ethanol Amines
        • 8.2.2. Fatty Amines
        • 8.2.3. Alkylamines
        • 8.2.4. Others
      • 8.3. Market Analysis, Insights and Forecast – By Application
        • 8.3.1. Crop Protection
        • 8.3.2. Gas treatment
        • 8.3.3. Personal Care
        • 8.3.4. Water Treatment
        • 8.3.5. Others
      • 8.4. Market Analysis, Insights and Forecast – By Function
        • 8.4.1. Solvent
        • 8.4.2. Chelating Agent
        • 8.4.3. Corrosion Inhibitor
        • 8.4.4. Bleach Activators
        • 8.4.5. Surfactants
      • 8.5. Market Analysis, Insights and Forecast – By Country
        • 8.5.1. China
        • 8.5.2. India
        • 8.5.3. Japan
        • 8.5.4. Australia
        • 8.5.5. South East Asia
        • 8.5.6. Rest of Asia Pacific

      9. Latin America, Middle East, and Africa Amines Market Analysis (USD Billion), Insights and Forecast, 2023-2030

      • 9.1. Key Findings / Summary
      • 9.2. Market Analysis, Insights and Forecast – By Type
        • 9.2.1. Ethanol Amines
        • 9.2.2. Fatty Amines
        • 9.2.3. Alkylamines
        • 9.2.4. Others
      • 9.3. Market Analysis, Insights and Forecast – By Application
        • 9.3.1. Crop Protection
        • 9.3.2. Gas treatment
        • 9.3.3. Personal Care
        • 9.3.4. Water Treatment
        • 9.3.5. Others
      • 9.4. Market Analysis, Insights and Forecast – By Function
        • 9.4.1. Solvent
        • 9.4.2. Chelating Agent
        • 9.4.3. Corrosion Inhibitor
        • 9.4.4. Bleach Activators
        • 9.4.5. Surfactants
      • 9.5. Market Analysis, Insights and Forecast – By Country
        • 9.5.1. Brazil
        • 9.5.2. Saudi Arabia
        • 9.5.3. UAE
        • 9.5.4. Rest of LAMEA

      10. Competitive Analysis

      • 10.1. Company Market Share Analysis, 2018
      • 10.2. Key Industry Developments
      • 10.3. Company Profile
      • 10.4. Volant Chem Corp.
        • 10.4.1. Business Overview
        • 10.4.2. Segment 1 & Service Offering
        • 10.4.3. Overall Revenue
        • 10.4.4. Geographic Presence
        • 10.4.5. Recent Development
      *Similar details will be provided for the following companies
      • 10.5. Alkyl Amines & Chemicals Ltd. (AACL)
      • 10.6. Koei Chemical Co., Ltd.
      • 10.7. Balaji Amines
      • 10.8. BASF SE
      • 10.9. Luxi Chemical Co., Ltd.
      • 10.10. Huntsman Corporation
      • 10.11. Indo Amines Limited (IAL)
      • 10.12. Hexion Inc.
      • 10.13. NOF Corporation
      • 10.14. Nouryon Chemicals
      • 10.15. Dow Chemicals
      • 10.16. Solvay
      • 10.17. Daicel Corporation
      • 10.18. Lanxess
      • 10.19. Evonik Industries AG
      • 10.20. Global Amines Company
      • 10.21. Amines & Plasticizers Ltd. (APL)
      • 10.22. Kao Corporation
      • 10.23. Eastman Chemical Company
      • 10.24. Sterling Auxiliaries Pvt Ltd.
      • 10.25. Arkema
      • 10.26. Mitsubishi Gas Chemical Company
      List of Figures

      Figure 1: Global Amines Market Revenue Breakdown (USD Billion, %) by Region, 2023 & 2030
      Figure 2: Global Amines Market Value Share (%), By Segment 1, 2023 & 2030
      Figure 3: Global Amines Market Forecast (USD Billion), by Sub-Segment 1, 2018-2030
      Figure 4: Global Amines Market Forecast (USD Billion), by Sub-Segment 2, 2018-2030
      Figure 5: Global Amines Market Value Share (%), By Segment 2, 2023 & 2030
      Figure 6: Global Amines Market Forecast (USD Billion), by Sub-Segment 1, 2018-2030
      Figure 7: Global Amines Market Forecast (USD Billion), by Sub-Segment 2, 2018-2030
      Figure 8: Global Amines Market Forecast (USD Billion), by Sub-Segment 3, 2018-2030
      Figure 9: Global Amines Market Forecast (USD Billion), by Others, 2018-2030
      Figure 10: Global Amines Market Value Share (%), By Segment 3, 2023 & 2030
      Figure 11: Global Amines Market Forecast (USD Billion), by Sub-Segment 1, 2018-2030
      Figure 12: Global Amines Market Forecast (USD Billion), by Sub-Segment 2, 2018-2030
      Figure 13: Global Amines Market Forecast (USD Billion), by Sub-Segment 3, 2018-2030
      Figure 14: Global Amines Market Forecast (USD Billion), by Others, 2018-2030
      Figure 15: Global Amines Market Value (USD Billion), by Region, 2023 & 2030
      Figure 16: North America Amines Market Value Share (%), By Segment 1, 2023 & 2030
      Figure 17: North America Amines Market Forecast (USD Billion), by Sub-Segment 1, 2018-2030
      Figure 18: North America Amines Market Forecast (USD Billion), by Sub-Segment 2, 2018-2030
      Figure 19: North America Amines Market Value Share (%), By Segment 2, 2023 & 2030
      Figure 20: North America Amines Market Forecast (USD Billion), by Sub-Segment 1, 2018-2030
      Figure 21: North America Amines Market Forecast (USD Billion), by Sub-Segment 2, 2018-2030
      Figure 22: North America Amines Market Forecast (USD Billion), by Sub-Segment 3, 2018-2030
      Figure 23: North America Amines Market Forecast (USD Billion), by Others, 2018-2030
      Figure 24: North America Amines Market Value Share (%), By Segment 3, 2023 & 2030
      Figure 25: North America Amines Market Forecast (USD Billion), by Sub-Segment 1, 2018-2030
      Figure 26: North America Amines Market Forecast (USD Billion), by Sub-Segment 2, 2018-2030
      Figure 27: North America Amines Market Forecast (USD Billion), by Sub-Segment 3, 2018-2030
      Figure 28: North America Amines Market Forecast (USD Billion), by Others, 2018-2030
      Figure 29: North America Amines Market Forecast (USD Billion), by U.S., 2018-2030
      Figure 30: North America Amines Market Forecast (USD Billion), by Canada, 2018-2030
      Figure 31: Latin America Amines Market Value Share (%), By Segment 1, 2023 & 2030
      Figure 32: Latin America Amines Market Forecast (USD Billion), by Sub-Segment 1, 2018-2030
      Figure 33: Latin America Amines Market Forecast (USD Billion), by Sub-Segment 2, 2018-2030
      Figure 34: Latin America Amines Market Value Share (%), By Segment 2, 2023 & 2030
      Figure 35: Latin America Amines Market Forecast (USD Billion), by Sub-Segment 1, 2018-2030
      Figure 36: Latin America Amines Market Forecast (USD Billion), by Sub-Segment 2, 2018-2030
      Figure 37: Latin America Amines Market Forecast (USD Billion), by Sub-Segment 3, 2018-2030
      Figure 38: Latin America Amines Market Forecast (USD Billion), by Others, 2018-2030
      Figure 39: Latin America Amines Market Value Share (%), By Segment 3, 2023 & 2030
      Figure 40: Latin America Amines Market Forecast (USD Billion), by Sub-Segment 1, 2018-2030
      Figure 41: Latin America Amines Market Forecast (USD Billion), by Sub-Segment 2, 2018-2030
      Figure 42: Latin America Amines Market Forecast (USD Billion), by Sub-Segment 3, 2018-2030
      Figure 43: Latin America Amines Market Forecast (USD Billion), by Others, 2018-2030
      Figure 44: Latin America Amines Market Forecast (USD Billion), by Brazil, 2018-2030
      Figure 45: Latin America Amines Market Forecast (USD Billion), by Mexico, 2018-2030
      Figure 46: Latin America Amines Market Forecast (USD Billion), by Rest of Latin America, 2018-2030
      Figure 47: Europe Amines Market Value Share (%), By Segment 1, 2023 & 2030
      Figure 48: Europe Amines Market Forecast (USD Billion), by Sub-Segment 1, 2018-2030
      Figure 49: Europe Amines Market Forecast (USD Billion), by Sub-Segment 2, 2018-2030
      Figure 50: Europe Amines Market Value Share (%), By Segment 2, 2023 & 2030
      Figure 51: Europe Amines Market Forecast (USD Billion), by Sub-Segment 1, 2018-2030
      Figure 52: Europe Amines Market Forecast (USD Billion), by Sub-Segment 2, 2018-2030
      Figure 53: Europe Amines Market Forecast (USD Billion), by Sub-Segment 3, 2018-2030
      Figure 54: Europe Amines Market Forecast (USD Billion), by Others, 2018-2030
      Figure 55: Europe Amines Market Value Share (%), By Segment 3, 2023 & 2030
      Figure 56: Europe Amines Market Forecast (USD Billion), by Sub-Segment 1, 2018-2030
      Figure 57: Europe Amines Market Forecast (USD Billion), by Sub-Segment 2, 2018-2030
      Figure 58: Europe Amines Market Forecast (USD Billion), by Sub-Segment 3, 2018-2030
      Figure 59: Europe Amines Market Forecast (USD Billion), by Others, 2018-2030
      Figure 60: Europe Amines Market Forecast (USD Billion), by U.K., 2018-2030
      Figure 61: Europe Amines Market Forecast (USD Billion), by Germany, 2018-2030
      Figure 62: Europe Amines Market Forecast (USD Billion), by France, 2018-2030
      Figure 63: Europe Amines Market Forecast (USD Billion), by Italy, 2018-2030
      Figure 64: Europe Amines Market Forecast (USD Billion), by Spain, 2018-2030
      Figure 65: Europe Amines Market Forecast (USD Billion), by Russia, 2018-2030
      Figure 66: Europe Amines Market Forecast (USD Billion), by Rest of Europe, 2018-2030
      Figure 67: Asia Pacific Amines Market Value Share (%), By Segment 1, 2023 & 2030
      Figure 68: Asia Pacific Amines Market Forecast (USD Billion), by Sub-Segment 1, 2018-2030
      Figure 69: Asia Pacific Amines Market Forecast (USD Billion), by Sub-Segment 2, 2018-2030
      Figure 70: Asia Pacific Amines Market Value Share (%), By Segment 2, 2023 & 2030
      Figure 71: Asia Pacific Amines Market Forecast (USD Billion), by Sub-Segment 1, 2018-2030
      Figure 72: Asia Pacific Amines Market Forecast (USD Billion), by Sub-Segment 2, 2018-2030
      Figure 73: Asia Pacific Amines Market Forecast (USD Billion), by Sub-Segment 3, 2018-2030
      Figure 74: Asia Pacific Amines Market Forecast (USD Billion), by Others, 2018-2030
      Figure 75: Asia Pacific Amines Market Value Share (%), By Segment 3, 2023 & 2030
      Figure 76: Asia Pacific Amines Market Forecast (USD Billion), by Sub-Segment 1, 2018-2030
      Figure 77: Asia Pacific Amines Market Forecast (USD Billion), by Sub-Segment 2, 2018-2030
      Figure 78: Asia Pacific Amines Market Forecast (USD Billion), by Sub-Segment 3, 2018-2030
      Figure 79: Asia Pacific Amines Market Forecast (USD Billion), by Others, 2018-2030
      Figure 80: Asia Pacific Amines Market Forecast (USD Billion), by China, 2018-2030
      Figure 81: Asia Pacific Amines Market Forecast (USD Billion), by India, 2018-2030
      Figure 82: Asia Pacific Amines Market Forecast (USD Billion), by Japan, 2018-2030
      Figure 83: Asia Pacific Amines Market Forecast (USD Billion), by Australia, 2018-2030
      Figure 84: Asia Pacific Amines Market Forecast (USD Billion), by Southeast Asia, 2018-2030
      Figure 85: Asia Pacific Amines Market Forecast (USD Billion), by Rest of Asia Pacific, 2018-2030
      Figure 86: Middle East & Africa Amines Market Value Share (%), By Segment 1, 2023 & 2030
      Figure 87: Middle East & Africa Amines Market Forecast (USD Billion), by Sub-Segment 1, 2018-2030
      Figure 88: Middle East & Africa Amines Market Forecast (USD Billion), by Sub-Segment 2, 2018-2030
      Figure 89: Middle East & Africa Amines Market Value Share (%), By Segment 2, 2023 & 2030
      Figure 90: Middle East & Africa Amines Market Forecast (USD Billion), by Sub-Segment 1, 2018-2030
      Figure 91: Middle East & Africa Amines Market Forecast (USD Billion), by Sub-Segment 2, 2018-2030
      Figure 92: Middle East & Africa Amines Market Forecast (USD Billion), by Sub-Segment 3, 2018-2030
      Figure 93: Middle East & Africa Amines Market Forecast (USD Billion), by Others, 2018-2030
      Figure 94: Middle East & Africa Amines Market Value Share (%), By Segment 3, 2023 & 2030
      Figure 95: Middle East & Africa Amines Market Forecast (USD Billion), by Sub-Segment 1, 2018-2030
      Figure 96: Middle East & Africa Amines Market Forecast (USD Billion), by Sub-Segment 2, 2018-2030
      Figure 97: Middle East & Africa Amines Market Forecast (USD Billion), by Sub-Segment 3, 2018-2030
      Figure 98: Middle East & Africa Amines Market Forecast (USD Billion), by Others, 2018-2030
      Figure 99: Middle East & Africa Amines Market Forecast (USD Billion), by GCC, 2018-2030
      Figure 100: Middle East & Africa Amines Market Forecast (USD Billion), by South Africa, 2018-2030
      Figure 101: Middle East & Africa Amines Market Forecast (USD Billion), by Rest of Middle East & Africa, 2018-2030 
      List of Tables
      Table 1: Global Amines Market Revenue (USD Billion) Forecast, by Segment 1, 2018-2030
      Table 2: Global Amines Market Revenue (USD Billion) Forecast, by Segment 2, 2018-2030
      Table 3: Global Amines Market Revenue (USD Billion) Forecast, by Segment 3, 2018-2030
      Table 4: Global Amines Market Revenue (USD Billion) Forecast, by Region, 2018-2030
      Table 5: North America Amines Market Revenue (USD Billion) Forecast, by Segment 1, 2018-2030
      Table 6: North America Amines Market Revenue (USD Billion) Forecast, by Segment 2, 2018-2030
      Table 7: North America Amines Market Revenue (USD Billion) Forecast, by Segment 3, 2018-2030
      Table 8: North America Amines Market Revenue (USD Billion) Forecast, by Country, 2018-2030
      Table 9: Europe Amines Market Revenue (USD Billion) Forecast, by Segment 1, 2018-2030
      Table 10: Europe Amines Market Revenue (USD Billion) Forecast, by Segment 2, 2018-2030
      Table 11: Europe Amines Market Revenue (USD Billion) Forecast, by Segment 3, 2018-2030
      Table 12: Europe Amines Market Revenue (USD Billion) Forecast, by Country, 2018-2030
      Table 13: Latin America Amines Market Revenue (USD Billion) Forecast, by Segment 1, 2018-2030
      Table 14: Latin America Amines Market Revenue (USD Billion) Forecast, by Segment 2, 2018-2030
      Table 15: Latin America Amines Market Revenue (USD Billion) Forecast, by Segment 3, 2018-2030
      Table 16: Latin America Amines Market Revenue (USD Billion) Forecast, by Country, 2018-2030
      Table 17: Asia Pacific Amines Market Revenue (USD Billion) Forecast, by Segment 1, 2018-2030
      Table 18: Asia Pacific Amines Market Revenue (USD Billion) Forecast, by Segment 2, 2018-2030
      Table 19: Asia Pacific Amines Market Revenue (USD Billion) Forecast, by Segment 3, 2018-2030
      Table 20: Asia Pacific Amines Market Revenue (USD Billion) Forecast, by Country, 2018-2030
      Table 21: Middle East & Africa Amines Market Revenue (USD Billion) Forecast, by Segment 1, 2018-2030
      Table 22: Middle East & Africa Amines Market Revenue (USD Billion) Forecast, by Segment 2, 2018-2030
      Table 23: Middle East & Africa Amines Market Revenue (USD Billion) Forecast, by Segment 3, 2018-2030
      Table 24: Middle East & Africa Amines Market Revenue (USD Billion) Forecast, by Country, 2018-2030
      Research Process

      Data Library Research are conducted by industry experts who offer insight on industry structure, market segmentations technology assessment and competitive landscape (CL), and penetration, as well as on emerging trends. Their analysis is based on primary interviews (~ 80%) and secondary research (~ 20%) as well as years of professional expertise in their respective industries. Adding to this, by analysing historical trends and current market positions, our analysts predict where the market will be headed for the next five years. Furthermore, the varying trends of segment & categories geographically presented are also studied and the estimated based on the primary & secondary research.

      In this particular report from the supply side Data Library Research has conducted primary surveys (interviews) with the key level executives (VP, CEO’s, Marketing Director, Business Development Manager and SOFT) of the companies that active & prominent as well as the midsized organization

      FIGURE 1: DLR RESEARH PROCESS

      research-methodology1

      Primary Research

      Extensive primary research was conducted to gain a deeper insight of the market and industry performance. The analysis is based on both primary and secondary research as well as years of professional expertise in the respective industries.

      In addition to analysing current and historical trends, our analysts predict where the market is headed over the next five years.

      It varies by segment for these categories geographically presented in the list of market tables. Speaking about this particular report we have conducted primary surveys (interviews) with the key level executives (VP, CEO’s, Marketing Director, Business Development Manager and many more) of the major players active in the market.

      Secondary Research

      Secondary research was mainly used to collect and identify information useful for the extensive, technical, market-oriented, and Friend’s study of the Global Extra Neutral Alcohol. It was also used to obtain key information about major players, market classification and segmentation according to the industry trends, geographical markets, and developments related to the market and technology perspectives. For this study, analysts have gathered information from various credible sources, such as annual reports, sec filings, journals, white papers, SOFT presentations, and company web sites.

      Market Size Estimation

      Both, top-down and bottom-up approaches were used to estimate and validate the size of the Global market and to estimate the size of various other dependent submarkets in the overall Extra Neutral Alcohol. The key players in the market were identified through secondary research and their market contributions in the respective geographies were determined through primary and secondary research.

      Forecast Model

      research-methodology2

      Happy to Assist You

      If you have a question?

      info@datalibraryresearch.com

      IND : +91 955 279 0357

      Browse Related Reports