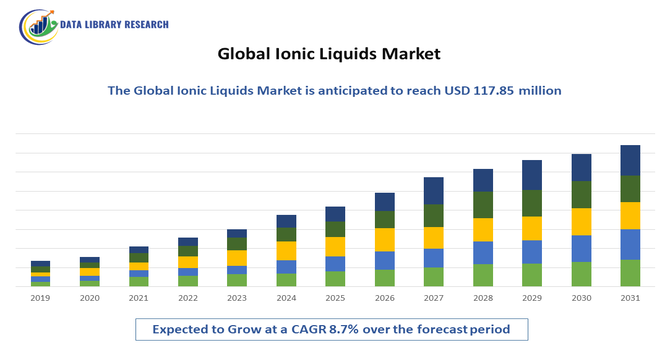
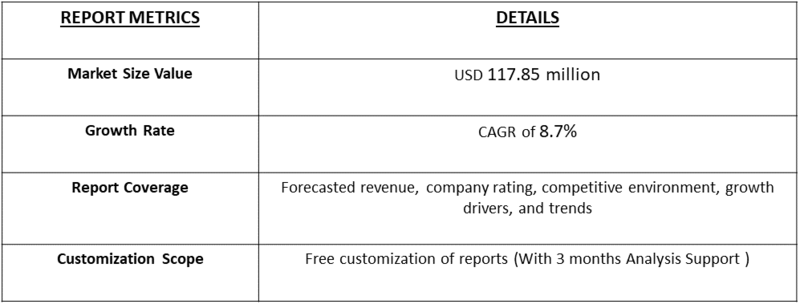
The global ionic liquids market, valued at USD 69.44 million in 2025 and projected to grow at an 8.7% CAGR from 2025-2032, is estimated to reach approximately USD 117.85 million by 2032.
Get Complete Analysis Of The Report - Download Free Sample PDF
Ionic liquids (ILs) are salts that are liquid at or below a temperature of 100°C (212°F). Unlike conventional salts like sodium chloride, which have very high melting points, ionic liquids are composed of bulky, asymmetric organic cations and often organic or inorganic anions. This structural complexity disrupts the regular packing arrangement that leads to high melting points in traditional salts, keeping them in a liquid state at much lower temperatures. The global ionic liquid market is witnessing a significant upswing driven by increasing research and development, a growing demand for sustainable and environmentally friendly solvents, and their unique properties making them suitable for advanced applications.
The emerging trends in the global ionic liquid market are sustainability and specialized applications. The development of task-specific ionic liquids with tailored functionalities is a key focus, enabling their expanded use in biomass processing and renewable energy sectors. Also, the significant advancements are being made in recycling and recovery techniques, enhancing cost-effectiveness and overall sustainability.
As excellent green chemistry solutions, their low volatility, non-flammability, and high stability make them superior replacements for VOCs in diverse applications, including solvents and catalysts. Furthermore, promising developments are seen in pharmaceutical and biomedical applications, where their stability and unique solubilizing properties position them as valuable biocompatible carriers, antimicrobial agents, and components in advanced drug delivery systems.
Segmentation:
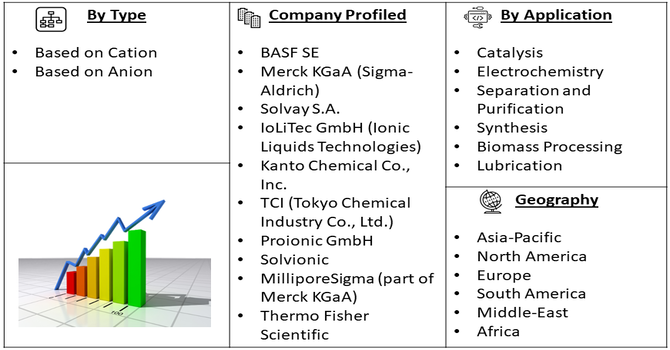
The market can be segmented by Type (Based on Cation (Imidazolium, Pyridinium, Phosphonium, Ammonium) Based on Anion (Halides, Tetrafluoroborate, Hexafluorophosphate, Triflate), Application (Catalysis, Electrochemistry, Separation and Purification, Synthesis, Biomass Processing, and Lubrication), and Region (e.g., North America, Europe, Asia-Pacific, Latin America, Middle East & Africa). The report provides the value (in USD million) for the above segments.
For Detailed Market Segmentation - Get a Free Sample PDF
Market Drivers:
The increasing adoption of advanced technologies—such as batteries, supercapacitors, biofuels, pharmaceutical synthesis, and CO₂ capture—is fueling growth in the ionic liquid market, since ionic liquids serve as highly efficient solvents, electrolytes, and stabilizing agents in these applications.
In May 2025, Nippon Yuka Kogyo Co., Ltd. launched BioxiGuard, Japan’s first antioxidant developed for marine biodiesel fuel, highlights how new chemical solutions are addressing the stability and storage challenges of biofuels. Ionic liquids play a complementary role here: they are often used as green solvents and stabilizers in biofuel production processes, improving reaction efficiency, reducing energy consumption, and enhancing overall fuel quality.
As products like BioxiGuard make biodiesel more reliable and attractive for large-scale use, the demand for advanced processing technologies—where ionic liquids are a critical enabler—will also rise. This not only boosts adoption of biofuels in industries like shipping but also creates new growth avenues for the ionic liquid market, as companies invest in sustainable fuel development, cleaner chemical processes, and long-term energy solutions.
Substantial R&D investments by universities and chemical companies are uncovering new ionic liquids and broadening their applications. For instance, Arkema’s showcase of advanced solutions for EV and ESS battery systems at the Battery Show Europe 2024 highlights how innovation is reshaping energy storage. With ionic liquids offering superior thermal stability, conductivity, and safety benefits, their role in next-generation batteries is expanding. These developments are expected to accelerate adoption, driving significant growth in the global ionic liquid market.
Market Restraints:
A study published in Bioresource Technology highlighted that the high synthesis and purification costs of ionic liquids (ILs) remain a significant barrier to their large-scale commercial adoption. Research-grade ILs are often priced hundreds to thousands of times higher than conventional organic solvents.
This cost challenge arises from the need for specialized raw materials, multi-step synthesis routes, and rigorous purification processes to achieve the required high purity. To address this limitation, ongoing research is actively exploring more cost-effective and scalable production methods, aiming to reduce expenses and enhance the economic feasibility of ILs for diverse industrial applications.
Social Economic Impact
Ionic liquids can bring big social and economic benefits. They make industrial processes cleaner and more efficient, which reduces pollution, saves resources, and supports the world’s move toward renewable energy. This also improves energy security and speeds up the shift to a low-carbon economy. However, their high production costs make them less affordable for smaller businesses, which slows wider adoption. It’s also important to study their long-term impact on health and the environment. Before COVID-19, research in this area was steadily growing, and after the pandemic, the focus on sustainable and resilient technologies like ionic liquids has only increased.
Segmental Analysis
Imidazolium-based salts are a cornerstone of the ionic liquid market, acting as versatile building blocks that enable a wide array of advanced applications. Their unique structure allows them to form liquid salts at low temperatures, offering advantages like minimal evaporation and high stability, making them attractive "green" alternatives to traditional solvents and catalysts in industries ranging from chemical synthesis to renewable energy.
This versatility is a major driver for the broader ionic salt market, as researchers and industries increasingly leverage the tunable properties of these imidazolium compounds to develop more efficient, sustainable, and specialized solutions, pushing innovation across diverse sectors like pharmaceuticals, electrochemistry, and biomass processing.
The biomass processing application segment is projected to record the fastest growth during the forecast period, driven by rising demand for renewable energy solutions. For instance, a key development took place in June 2025, when Neste partnered with Chevron Lummus Global (CLG), a leading technology provider for renewable and conventional fuels. Together, they are working on an innovative technology that converts lignocellulosic biomass—non-food plant material—into high-quality renewable fuels, including sustainable aviation fuel (SAF) and renewable diesel. This collaboration marks an important step in expanding cleaner energy options for the transportation sector, which is under growing pressure to cut emissions.
Ionic liquids (often referred to as ionic salts) play a crucial role in biomass processing because of their unique ability to dissolve tough lignocellulosic structures efficiently. Traditional solvents often struggle with this, but ionic liquids can break down cellulose and hemicellulose, making biomass conversion faster, cleaner, and more cost-effective. As technologies like the Neste–CLG partnership scale up, demand for efficient biomass pretreatment and processing methods will rise significantly. This will directly fuel the growth of the ionic salt market, as industries seek greener solvents that not only boost yield and efficiency but also align with sustainability and low-carbon goals.
In the North American region, the ionic salt market is experiencing robust growth, significantly fueled by substantial high investment and the established presence of major industry players. This dynamic environment fosters innovation and market expansion. For instance, in July 2025, Ontario government's CA$6.2 million investment through its Forest Biomass Program in Northwestern Ontario, which aims to unlock new commercial uses for forest biomass. While not exclusively focused on ionic salts, such programs are crucial as they stimulate the development of sustainable feedstock and processing technologies.
Similarly, advanced biorefineries utilizing forest biomass could potentially employ or even produce ionic liquids—a significant category of ionic salts—as green solvents for efficient extraction of valuable compounds or as catalysts in downstream chemical synthesis. This investment, coupled with the operational presence of established chemical manufacturers and specialized ionic liquid producers across North America (e.g., companies involved in advanced materials, specialty chemicals, and catalysis), creates a fertile ground for the commercialization of these bio-based ionic salt applications. The synergy between government funding, the drive for sustainable materials, and the existing industrial infrastructure positions North America as a key growth region for the broader ionic salt market.
To Learn More About This Report - Request a Free Sample Copy
The competitive landscape of the ionic salt market is characterized by a dynamic interplay between established chemical giants and specialized innovators. Major players, leveraging significant R&D budgets and extensive distribution networks, focus on high-volume applications and broad market penetration. Simultaneously, a wave of agile startups and research institutions are driving innovation, particularly in the development of task-specific ionic liquids with tailored functionalities for niche applications in pharmaceuticals, advanced materials, and renewable energy. This creates a bifurcated market where competition exists not only on price and volume but increasingly on technological differentiation, application-specific performance, and the ability to offer sustainable and cost-effective solutions, including advanced recycling and recovery methods to enhance profitability and environmental credentials.
Here are 10 major players that are active in the ionic salt market:
Recent Developments:
Q1. What are the main growth driving factors for this market?
The main growth driving factors for the ionic salt market include the rising demand for sustainable energy solutions and the increasing adoption of ionic salts in various industries.
Q2. What are the main restraining factors for this market?
The main restraining factors for the ionic salt market include the high initial costs associated with the production and commercialization of ionic salts and the limited availability of raw materials in some regions.
Q3. Which segment is expected to witness high growth?
The pharmaceutical and biotech segment is expected to witness high growth in the ionic salt market due to the increasing use of ionic salts in drug development and delivery.
Q4. Who are the top major players for this market?
The top major players in the ionic salt market include BASF SE, Evonik Industries AG, Merck KGaA, Iolitec Inc., and Scionix, among others.
Q5. Which country is the largest player?
The United States is currently the largest player in the global ionic salt market, driven by the strong presence of major industry participants and the growing demand for ionic salts across various end-use sectors.
Data Library Research are conducted by industry experts who offer insight on industry structure, market segmentations technology assessment and competitive landscape (CL), and penetration, as well as on emerging trends. Their analysis is based on primary interviews (~ 80%) and secondary research (~ 20%) as well as years of professional expertise in their respective industries. Adding to this, by analysing historical trends and current market positions, our analysts predict where the market will be headed for the next five years. Furthermore, the varying trends of segment & categories geographically presented are also studied and the estimated based on the primary & secondary research.
In this particular report from the supply side Data Library Research has conducted primary surveys (interviews) with the key level executives (VP, CEO’s, Marketing Director, Business Development Manager and SOFT) of the companies that active & prominent as well as the midsized organization
FIGURE 1: DLR RESEARH PROCESS
Extensive primary research was conducted to gain a deeper insight of the market and industry performance. The analysis is based on both primary and secondary research as well as years of professional expertise in the respective industries.
In addition to analysing current and historical trends, our analysts predict where the market is headed over the next five years.
It varies by segment for these categories geographically presented in the list of market tables. Speaking about this particular report we have conducted primary surveys (interviews) with the key level executives (VP, CEO’s, Marketing Director, Business Development Manager and many more) of the major players active in the market.
Secondary ResearchSecondary research was mainly used to collect and identify information useful for the extensive, technical, market-oriented, and Friend’s study of the Global Extra Neutral Alcohol. It was also used to obtain key information about major players, market classification and segmentation according to the industry trends, geographical markets, and developments related to the market and technology perspectives. For this study, analysts have gathered information from various credible sources, such as annual reports, sec filings, journals, white papers, SOFT presentations, and company web sites.
Market Size EstimationBoth, top-down and bottom-up approaches were used to estimate and validate the size of the Global market and to estimate the size of various other dependent submarkets in the overall Extra Neutral Alcohol. The key players in the market were identified through secondary research and their market contributions in the respective geographies were determined through primary and secondary research.
Forecast Model