Biocompatibility Testing Solutions For Medical Devices Market Overview and Analysis
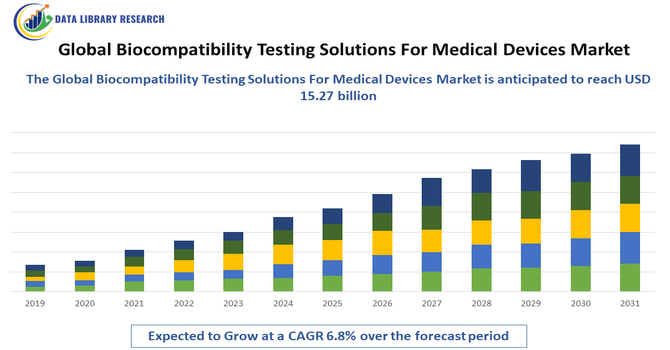
- The Global Biocompatibility Testing Solutions for Medical Devices Market was valued at USD 9.1 billion in 2025 and is expected to reach USD 15.27 billion in 2032, growing with a CAGR of 6.8% from 2025 to 2032.
Get Complete Analysis Of The Report - Download Updated Free Sample PDF
The Global Biocompatibility Testing Solutions for Medical Devices Market refers to the worldwide industry providing services, technologies, and regulatory support to evaluate the biological safety of medical devices. It includes in vitro, in vivo, and chemical characterization tests required to meet international standards such as ISO 10993. The market serves device manufacturers across diagnostics, implants, and disposables, driven by regulatory compliance, innovation in materials, outsourcing trends, and growing demand for safe, effective healthcare products worldwide across established and emerging regions.
Biocompatibility Testing Solutions For Medical Devices Market Latest Trends
The global biocompatibility testing solutions market is shaped by stringent regulatory requirements such as ISO 10993 and updated FDA guidance, driving demand for comprehensive safety evaluations across all device types. There is a growing industry shift toward outsourcing testing services to specialized laboratories to reduce cost and accelerate time-to-market. Advanced methodologies like in vitro and in-silico models are gaining traction as ethical and faster alternatives to traditional animal testing. Additionally, integration of AI, automation, and personalized testing for novel materials supports faster regulatory submissions and addresses increasing complexity in medical device designs.
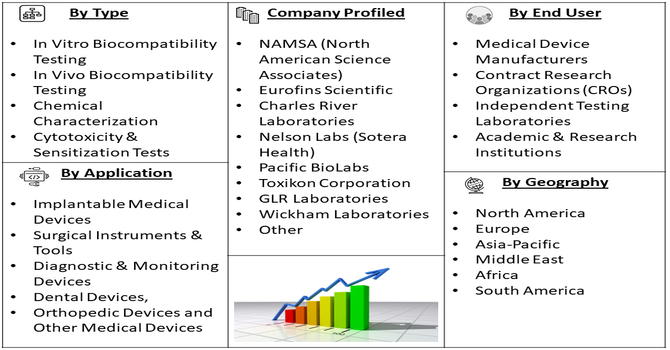
Segmentation: The Global Biocompatibility Testing Solutions for Medical Devices Market is segmented by Test Type (In Vitro Biocompatibility Testing, In Vivo Biocompatibility Testing, Chemical Characterization, Cytotoxicity & Sensitization Tests, Genotoxicity & Implantation Tests and Other Specific Biocompatibility Tests), Technology (Standardized Assays & Protocols, Advanced Analytical Instruments, In Silico Modeling & Computational Toxicology, High-Throughput Screening Platforms and Automation & Robotics-Based Testing), Application (Implantable Medical Devices, Surgical Instruments & Tools, Diagnostic & Monitoring Devices, Dental Devices, Orthopedic Devices and Other Medical Devices), End User (Medical Device Manufacturers, Contract Research Organizations (CROs), Independent Testing Laboratories, Academic & Research Institutions and Geography (North America, Europe, Asia-Pacific, Middle East and Africa, and South America). The report provides the value (in USD million) for the above segments.
For Detailed Market Segmentation - Get a Free Sample PDF
Market Drivers:
- Growth in Medical Devices and Advanced Materials
The expanding global medical device industry significantly fuels the need for biocompatibility testing solutions. Increasing prevalence of chronic diseases, an aging population, and rising adoption of implantable, wearable, and personalized devices drive innovation in medical technology. Advanced materials—such as bioresorbable polymers, nanomaterials, and 3D-printed implants—require rigorous biological evaluation due to complex tissue interactions.
In September 2025, Secretary, Pharmaceuticals highlighted India’s growth trajectory in medical technology sector at APAC MedTech Forum, reported that India’s strategic push to expand its MedTech sector and establish medical device parks boosted the growth of advanced materials and medical devices, increasing demand for biocompatibility testing. Enhanced local manufacturing, reduced import reliance, and broader healthcare access stimulated the global biocompatibility testing market, driving regulatory-compliant safety assessments and innovation in device development.
- Stringent Regulatory Requirements
The growth in the biocompatibility testing market is the increasing stringency of global regulatory standards. Agencies such as the U.S. FDA, European regulators, and others now require comprehensive biocompatibility evaluations for most medical devices to ensure patient safety and minimize adverse biological reactions. Standards like ISO 10993 mandate extensive testing across multiple endpoints, from cytotoxicity to sensitization and implantation effects. This regulatory emphasis forces manufacturers to invest in robust testing solutions, expanding demand for both in-house and outsourced biocompatibility services worldwide.
Market Restraints:
- High Testing Costs and Lengthy Timelines
A major restraint on the market’s growth is the high cost and extended duration of biocompatibility testing. Comprehensive evaluations, particularly for high-risk Class III devices, can be expensive—often running into tens or hundreds of thousands of dollars—and may take six to twelve months or more to complete. These financial and time burdens are especially challenging for startups and SMEs, potentially delaying product launches and straining R&D budgets. Additionally, maintaining GLP-certified facilities and skilled personnel further escalates operational costs, limiting market penetration and innovation among smaller players.
Socioeconomic Impact on Biocompatibility Testing Solutions For Medical Devices Market
Biocompatibility testing underpins patient safety and public health by ensuring materials in medical devices are biologically safe, reducing adverse events and costly recalls. Growing healthcare expenditure and aging populations worldwide increase demand for implants, diagnostics, and wearable devices, expanding testing needs. Compliance with global standards fosters international trade and market access, benefiting manufacturers and testing service providers alike. However, high testing costs and long timelines can burden SMEs and startups, potentially slowing innovation.
Segmental Analysis:
- In Vitro Biocompatibility Testing segment is expected to witness the highest growth over the forecast period
The In Vitro Biocompatibility Testing segment is expected to witness the highest growth over the forecast period due to its ethical advantages, cost-efficiency, and faster turnaround compared to traditional in vivo methods. Advances in cell culture systems, high-throughput screening, and alternative testing technologies are making in vitro assays more predictive of human biological responses. Regulatory agencies and industry stakeholders are increasingly encouraging non-animal models, further boosting adoption. This shift also aligns with global trends toward reducing animal testing while maintaining rigorous safety standards for medical device materials and components.
- Standardized Assays & Protocols segment is expected to witness the highest growth over the forecast period
The Standardized Assays & Protocols segment is expected to register the highest growth within technology categories, driven by the need for consistent, reproducible, and regulatory-compliant biocompatibility evaluations. Standardization around international norms such as ISO 10993 and ASTM methods ensures data acceptance across regions and simplifies global device approvals. As medical device complexity increases, manufacturers and testing labs adopt validated assays that streamline regulatory submissions and facilitate benchmarking across products. Standardized protocols also support automation and digital data analysis, improving throughput and decision-making in safety assessments.
- Implantable Medical Devices segment is expected to witness the highest growth over the forecast period
The Implantable Medical Devices segment is poised for the highest growth because these devices demand extensive biocompatibility evaluation to ensure long-term safety and performance in direct contact with tissues and bodily fluids. With an aging population and rising prevalence of chronic conditions, demand for implants such as orthopedic, cardiovascular, and neural devices is increasing rapidly. Regulatory bodies require rigorous testing for materials used in implants, further boosting the need for comprehensive biocompatibility solutions. Innovations like bioresorbable materials and personalized 3D-printed implants also expand testing requirements, driving market growth.
- Contract Research Organizations (CROs) segment is expected to witness highest growth over the forecast period
The Contract Research Organizations (CROs) segment is expected to witness the highest growth among end users as medical device manufacturers increasingly outsource biocompatibility testing to specialized laboratories. CROs offer advanced infrastructure, regulatory expertise, and breadth of testing services that help reduce internal costs and accelerate time-to-market. This trend is especially strong among small- and mid-sized enterprises that lack in-house testing capabilities. The preference for outsourcing also supports compliance with evolving global standards, boosting demand for end-to-end solutions from experienced CROs.
- North America Region is expected to witness highest growth over the forecast period
North America is anticipated to witness the highest growth over the forecast period, maintaining its leadership due to its well-established healthcare infrastructure, significant R&D investments, and strict regulatory oversight by agencies such as the U.S. FDA. For instance, in March 2025, NAMSA’s acquisition of WuXi AppTec’s U.S. medical device testing operations strengthened North America’s biocompatibility testing market by consolidating expertise and resources. The merger enhanced service capacity, expanded reach to over 4,000 manufacturers, and reinforced the region’s leadership in reliable, high-quality medical device biological safety testing.
The region accounts for a large share of global biocompatibility testing demand, supported by a concentration of medical device manufacturers and contract testing labs. High healthcare spending and continuous innovations in medical technologies also drive the market. North America’s emphasis on compliance and safety standards ensures sustained growth in biocompatibility testing solutions throughout the forecast period.
| Report Matrics |
Details |
| Market Size Value |
USD 15.27 billion |
| Growth Rate |
CAGR of 6.8% |
| Forecast |
2026-2033 |
| Historical data |
2021-2024 |
| Base Year |
2025 |
| Report Coverage |
Forecasted revenue, company rating, competitive environment, growth drivers, and trends |
| Segment Coverage |
Type, Application, End-User, Geography |
| Regional Scope |
North America, Europe, Asia Pacific, Middle East |
| Customized scope |
Free customization of reports (With 3 months Analysis Support ) |
| To Learn More About This Report |
Request a Free Sample Copy |
Biocompatibility Testing Solutions For Medical Devices Market Competitive Landscape
The competitive landscape is moderately concentrated with major players offering ISO-compliant, end-to-end testing solutions. Leading service providers include global contract research organizations like Eurofins Scientific, Nelson Labs, NAMSA, SGS SA, and Charles River Laboratories, which expand capabilities through acquisitions, strategic partnerships, and regional lab networks. These companies differentiate via comprehensive portfolios covering toxicology, in vitro/in vivo testing, and regulatory consulting. Smaller and regional firms increasingly compete by offering cost-effective or niche-specialized services. Innovation in digital platforms and advanced testing technologies further influences competitive positioning as demand for faster, accurate biocompatibility data grows.
The major players for the above market are:
- NAMSA (North American Science Associates)
- Eurofins Scientific
- Charles River Laboratories
- Nelson Labs (Sotera Health)
- Pacific BioLabs
- Toxikon Corporation
- GLR Laboratories
- Wickham Laboratories
- Accuprec Research Labs
- BioComp Laboratories
- Morulaa HealthTech
- Geneva Laboratories
- TÜV SÜD
- SGS SA
- Intertek Group plc
- WuXi AppTec
- Scientific Testing Company (STC)
- CIRS Group
- MeasurLabs
- HTW (CCIC Group)
Recent Development
- In September 2025, Rise Health Nano Optics’ completion of GLP-compliant biocompatibility testing reinforced the significance of certified testing services in the global biocompatibility testing market. The milestone demonstrated growing demand for ISO 10993-compliant cytotoxicity assessments, strengthened the role of accredited laboratories, and supported market growth driven by regulatory approvals and innovations in medical and optical devices.
- In July 2025, Hohenstein’s GLP certification strengthened the global biocompatibility testing market by improving trust in testing quality and regulatory compliance. It enhanced validated capabilities in chemical, physical, and biological safety assessments, supported reliable data generation, and reinforced the importance of accredited laboratories in meeting rising global demand for compliant medical device testing.
Frequently Asked Questions (FAQ) :
Q1. What are the main growth-driving factors for this market?
The market is growing because of strict government regulations that require every medical device to be proven safe before it touches a human body. As companies develop more complex implants, like artificial hearts or joints, the need for advanced testing increases. Additionally, the rise in global healthcare spending and the constant innovation in medical technology are driving the demand for reliable safety checks.
Q2. What are the main restraining factors for this market?
Growth is limited by the high cost of specialized laboratory testing and the long time it takes to get results, which can delay new products from reaching the market. There is also increasing pressure from animal rights groups to move away from traditional animal testing toward "in-vitro" or computer-based models. These new methods are still being perfected and require expensive new technology.
Q3. Which segment is expected to witness high growth?
The In-Vitro Testing segment is expected to see the highest growth. This method tests medical materials using cells in a laboratory dish rather than living animals. It is faster, more ethical, and often more cost-effective. As technology improves and regulators become more comfortable with these lab-based results, more companies are choosing this modern approach for early-stage safety screening.
Q4. Who are the top major players for this market?
The market is led by global laboratory giants and specialized contract research organizations (CROs). Key players include Eurofins Scientific, SGS SA, WuXi AppTec, Intertek Group, and TUV SUD. These companies dominate by maintaining world-class labs that stay up-to-date with changing international safety standards, helping medical device manufacturers navigate the complex path to government approval.
Q5. Which country is the largest player?
The United States is the largest player in the biocompatibility testing market. This is due to the presence of the FDA, which has some of the world’s strictest safety requirements for medical devices. The U.S. also hosts a massive number of medical device startups and established giants, all of which invest heavily in testing to ensure their products meet global safety benchmarks.
List of Figures
Figure 1: Global Biocompatibility Testing Solutions For Medical Devices Market Revenue Breakdown (USD Billion, %) by Region, 2022 & 2029
Figure 2: Global Biocompatibility Testing Solutions For Medical Devices Market Value Share (%), By Segment 1, 2022 & 2029
Figure 3: Global Biocompatibility Testing Solutions For Medical Devices Market Forecast (USD Billion), by Sub-Segment 1, 2018-2029
Figure 4: Global Biocompatibility Testing Solutions For Medical Devices Market Forecast (USD Billion), by Sub-Segment 2, 2018-2029
Figure 5: Global Biocompatibility Testing Solutions For Medical Devices Market Value Share (%), By Segment 2, 2022 & 2029
Figure 6: Global Biocompatibility Testing Solutions For Medical Devices Market Forecast (USD Billion), by Sub-Segment 1, 2018-2029
Figure 7: Global Biocompatibility Testing Solutions For Medical Devices Market Forecast (USD Billion), by Sub-Segment 2, 2018-2029
Figure 8: Global Biocompatibility Testing Solutions For Medical Devices Market Forecast (USD Billion), by Sub-Segment 3, 2018-2029
Figure 9: Global Biocompatibility Testing Solutions For Medical Devices Market Forecast (USD Billion), by Others, 2018-2029
Figure 10: Global Biocompatibility Testing Solutions For Medical Devices Market Value Share (%), By Segment 3, 2022 & 2029
Figure 11: Global Biocompatibility Testing Solutions For Medical Devices Market Forecast (USD Billion), by Sub-Segment 1, 2018-2029
Figure 12: Global Biocompatibility Testing Solutions For Medical Devices Market Forecast (USD Billion), by Sub-Segment 2, 2018-2029
Figure 13: Global Biocompatibility Testing Solutions For Medical Devices Market Forecast (USD Billion), by Sub-Segment 3, 2018-2029
Figure 14: Global Biocompatibility Testing Solutions For Medical Devices Market Forecast (USD Billion), by Others, 2018-2029
Figure 15: Global Biocompatibility Testing Solutions For Medical Devices Market Value (USD Billion), by Region, 2022 & 2029
Figure 16: North America Biocompatibility Testing Solutions For Medical Devices Market Value Share (%), By Segment 1, 2022 & 2029
Figure 17: North America Biocompatibility Testing Solutions For Medical Devices Market Forecast (USD Billion), by Sub-Segment 1, 2018-2029
Figure 18: North America Biocompatibility Testing Solutions For Medical Devices Market Forecast (USD Billion), by Sub-Segment 2, 2018-2029
Figure 19: North America Biocompatibility Testing Solutions For Medical Devices Market Value Share (%), By Segment 2, 2022 & 2029
Figure 20: North America Biocompatibility Testing Solutions For Medical Devices Market Forecast (USD Billion), by Sub-Segment 1, 2018-2029
Figure 21: North America Biocompatibility Testing Solutions For Medical Devices Market Forecast (USD Billion), by Sub-Segment 2, 2018-2029
Figure 22: North America Biocompatibility Testing Solutions For Medical Devices Market Forecast (USD Billion), by Sub-Segment 3, 2018-2029
Figure 23: North America Biocompatibility Testing Solutions For Medical Devices Market Forecast (USD Billion), by Others, 2018-2029
Figure 24: North America Biocompatibility Testing Solutions For Medical Devices Market Value Share (%), By Segment 3, 2022 & 2029
Figure 25: North America Biocompatibility Testing Solutions For Medical Devices Market Forecast (USD Billion), by Sub-Segment 1, 2018-2029
Figure 26: North America Biocompatibility Testing Solutions For Medical Devices Market Forecast (USD Billion), by Sub-Segment 2, 2018-2029
Figure 27: North America Biocompatibility Testing Solutions For Medical Devices Market Forecast (USD Billion), by Sub-Segment 3, 2018-2029
Figure 28: North America Biocompatibility Testing Solutions For Medical Devices Market Forecast (USD Billion), by Others, 2018-2029
Figure 29: North America Biocompatibility Testing Solutions For Medical Devices Market Forecast (USD Billion), by U.S., 2018-2029
Figure 30: North America Biocompatibility Testing Solutions For Medical Devices Market Forecast (USD Billion), by Canada, 2018-2029
Figure 31: Latin America Biocompatibility Testing Solutions For Medical Devices Market Value Share (%), By Segment 1, 2022 & 2029
Figure 32: Latin America Biocompatibility Testing Solutions For Medical Devices Market Forecast (USD Billion), by Sub-Segment 1, 2018-2029
Figure 33: Latin America Biocompatibility Testing Solutions For Medical Devices Market Forecast (USD Billion), by Sub-Segment 2, 2018-2029
Figure 34: Latin America Biocompatibility Testing Solutions For Medical Devices Market Value Share (%), By Segment 2, 2022 & 2029
Figure 35: Latin America Biocompatibility Testing Solutions For Medical Devices Market Forecast (USD Billion), by Sub-Segment 1, 2018-2029
Figure 36: Latin America Biocompatibility Testing Solutions For Medical Devices Market Forecast (USD Billion), by Sub-Segment 2, 2018-2029
Figure 37: Latin America Biocompatibility Testing Solutions For Medical Devices Market Forecast (USD Billion), by Sub-Segment 3, 2018-2029
Figure 38: Latin America Biocompatibility Testing Solutions For Medical Devices Market Forecast (USD Billion), by Others, 2018-2029
Figure 39: Latin America Biocompatibility Testing Solutions For Medical Devices Market Value Share (%), By Segment 3, 2022 & 2029
Figure 40: Latin America Biocompatibility Testing Solutions For Medical Devices Market Forecast (USD Billion), by Sub-Segment 1, 2018-2029
Figure 41: Latin America Biocompatibility Testing Solutions For Medical Devices Market Forecast (USD Billion), by Sub-Segment 2, 2018-2029
Figure 42: Latin America Biocompatibility Testing Solutions For Medical Devices Market Forecast (USD Billion), by Sub-Segment 3, 2018-2029
Figure 43: Latin America Biocompatibility Testing Solutions For Medical Devices Market Forecast (USD Billion), by Others, 2018-2029
Figure 44: Latin America Biocompatibility Testing Solutions For Medical Devices Market Forecast (USD Billion), by Brazil, 2018-2029
Figure 45: Latin America Biocompatibility Testing Solutions For Medical Devices Market Forecast (USD Billion), by Mexico, 2018-2029
Figure 46: Latin America Biocompatibility Testing Solutions For Medical Devices Market Forecast (USD Billion), by Rest of Latin America, 2018-2029
Figure 47: Europe Biocompatibility Testing Solutions For Medical Devices Market Value Share (%), By Segment 1, 2022 & 2029
Figure 48: Europe Biocompatibility Testing Solutions For Medical Devices Market Forecast (USD Billion), by Sub-Segment 1, 2018-2029
Figure 49: Europe Biocompatibility Testing Solutions For Medical Devices Market Forecast (USD Billion), by Sub-Segment 2, 2018-2029
Figure 50: Europe Biocompatibility Testing Solutions For Medical Devices Market Value Share (%), By Segment 2, 2022 & 2029
Figure 51: Europe Biocompatibility Testing Solutions For Medical Devices Market Forecast (USD Billion), by Sub-Segment 1, 2018-2029
Figure 52: Europe Biocompatibility Testing Solutions For Medical Devices Market Forecast (USD Billion), by Sub-Segment 2, 2018-2029
Figure 53: Europe Biocompatibility Testing Solutions For Medical Devices Market Forecast (USD Billion), by Sub-Segment 3, 2018-2029
Figure 54: Europe Biocompatibility Testing Solutions For Medical Devices Market Forecast (USD Billion), by Others, 2018-2029
Figure 55: Europe Biocompatibility Testing Solutions For Medical Devices Market Value Share (%), By Segment 3, 2022 & 2029
Figure 56: Europe Biocompatibility Testing Solutions For Medical Devices Market Forecast (USD Billion), by Sub-Segment 1, 2018-2029
Figure 57: Europe Biocompatibility Testing Solutions For Medical Devices Market Forecast (USD Billion), by Sub-Segment 2, 2018-2029
Figure 58: Europe Biocompatibility Testing Solutions For Medical Devices Market Forecast (USD Billion), by Sub-Segment 3, 2018-2029
Figure 59: Europe Biocompatibility Testing Solutions For Medical Devices Market Forecast (USD Billion), by Others, 2018-2029
Figure 60: Europe Biocompatibility Testing Solutions For Medical Devices Market Forecast (USD Billion), by U.K., 2018-2029
Figure 61: Europe Biocompatibility Testing Solutions For Medical Devices Market Forecast (USD Billion), by Germany, 2018-2029
Figure 62: Europe Biocompatibility Testing Solutions For Medical Devices Market Forecast (USD Billion), by France, 2018-2029
Figure 63: Europe Biocompatibility Testing Solutions For Medical Devices Market Forecast (USD Billion), by Italy, 2018-2029
Figure 64: Europe Biocompatibility Testing Solutions For Medical Devices Market Forecast (USD Billion), by Spain, 2018-2029
Figure 65: Europe Biocompatibility Testing Solutions For Medical Devices Market Forecast (USD Billion), by Russia, 2018-2029
Figure 66: Europe Biocompatibility Testing Solutions For Medical Devices Market Forecast (USD Billion), by Rest of Europe, 2018-2029
Figure 67: Asia Pacific Biocompatibility Testing Solutions For Medical Devices Market Value Share (%), By Segment 1, 2022 & 2029
Figure 68: Asia Pacific Biocompatibility Testing Solutions For Medical Devices Market Forecast (USD Billion), by Sub-Segment 1, 2018-2029
Figure 69: Asia Pacific Biocompatibility Testing Solutions For Medical Devices Market Forecast (USD Billion), by Sub-Segment 2, 2018-2029
Figure 70: Asia Pacific Biocompatibility Testing Solutions For Medical Devices Market Value Share (%), By Segment 2, 2022 & 2029
Figure 71: Asia Pacific Biocompatibility Testing Solutions For Medical Devices Market Forecast (USD Billion), by Sub-Segment 1, 2018-2029
Figure 72: Asia Pacific Biocompatibility Testing Solutions For Medical Devices Market Forecast (USD Billion), by Sub-Segment 2, 2018-2029
Figure 73: Asia Pacific Biocompatibility Testing Solutions For Medical Devices Market Forecast (USD Billion), by Sub-Segment 3, 2018-2029
Figure 74: Asia Pacific Biocompatibility Testing Solutions For Medical Devices Market Forecast (USD Billion), by Others, 2018-2029
Figure 75: Asia Pacific Biocompatibility Testing Solutions For Medical Devices Market Value Share (%), By Segment 3, 2022 & 2029
Figure 76: Asia Pacific Biocompatibility Testing Solutions For Medical Devices Market Forecast (USD Billion), by Sub-Segment 1, 2018-2029
Figure 77: Asia Pacific Biocompatibility Testing Solutions For Medical Devices Market Forecast (USD Billion), by Sub-Segment 2, 2018-2029
Figure 78: Asia Pacific Biocompatibility Testing Solutions For Medical Devices Market Forecast (USD Billion), by Sub-Segment 3, 2018-2029
Figure 79: Asia Pacific Biocompatibility Testing Solutions For Medical Devices Market Forecast (USD Billion), by Others, 2018-2029
Figure 80: Asia Pacific Biocompatibility Testing Solutions For Medical Devices Market Forecast (USD Billion), by China, 2018-2029
Figure 81: Asia Pacific Biocompatibility Testing Solutions For Medical Devices Market Forecast (USD Billion), by India, 2018-2029
Figure 82: Asia Pacific Biocompatibility Testing Solutions For Medical Devices Market Forecast (USD Billion), by Japan, 2018-2029
Figure 83: Asia Pacific Biocompatibility Testing Solutions For Medical Devices Market Forecast (USD Billion), by Australia, 2018-2029
Figure 84: Asia Pacific Biocompatibility Testing Solutions For Medical Devices Market Forecast (USD Billion), by Southeast Asia, 2018-2029
Figure 85: Asia Pacific Biocompatibility Testing Solutions For Medical Devices Market Forecast (USD Billion), by Rest of Asia Pacific, 2018-2029
Figure 86: Middle East & Africa Biocompatibility Testing Solutions For Medical Devices Market Value Share (%), By Segment 1, 2022 & 2029
Figure 87: Middle East & Africa Biocompatibility Testing Solutions For Medical Devices Market Forecast (USD Billion), by Sub-Segment 1, 2018-2029
Figure 88: Middle East & Africa Biocompatibility Testing Solutions For Medical Devices Market Forecast (USD Billion), by Sub-Segment 2, 2018-2029
Figure 89: Middle East & Africa Biocompatibility Testing Solutions For Medical Devices Market Value Share (%), By Segment 2, 2022 & 2029
Figure 90: Middle East & Africa Biocompatibility Testing Solutions For Medical Devices Market Forecast (USD Billion), by Sub-Segment 1, 2018-2029
Figure 91: Middle East & Africa Biocompatibility Testing Solutions For Medical Devices Market Forecast (USD Billion), by Sub-Segment 2, 2018-2029
Figure 92: Middle East & Africa Biocompatibility Testing Solutions For Medical Devices Market Forecast (USD Billion), by Sub-Segment 3, 2018-2029
Figure 93: Middle East & Africa Biocompatibility Testing Solutions For Medical Devices Market Forecast (USD Billion), by Others, 2018-2029
Figure 94: Middle East & Africa Biocompatibility Testing Solutions For Medical Devices Market Value Share (%), By Segment 3, 2022 & 2029
Figure 95: Middle East & Africa Biocompatibility Testing Solutions For Medical Devices Market Forecast (USD Billion), by Sub-Segment 1, 2018-2029
Figure 96: Middle East & Africa Biocompatibility Testing Solutions For Medical Devices Market Forecast (USD Billion), by Sub-Segment 2, 2018-2029
Figure 97: Middle East & Africa Biocompatibility Testing Solutions For Medical Devices Market Forecast (USD Billion), by Sub-Segment 3, 2018-2029
Figure 98: Middle East & Africa Biocompatibility Testing Solutions For Medical Devices Market Forecast (USD Billion), by Others, 2018-2029
Figure 99: Middle East & Africa Biocompatibility Testing Solutions For Medical Devices Market Forecast (USD Billion), by GCC, 2018-2029
Figure 100: Middle East & Africa Biocompatibility Testing Solutions For Medical Devices Market Forecast (USD Billion), by South Africa, 2018-2029
Figure 101: Middle East & Africa Biocompatibility Testing Solutions For Medical Devices Market Forecast (USD Billion), by Rest of Middle East & Africa, 2018-2029
List of Tables
Table 1: Global Biocompatibility Testing Solutions For Medical Devices Market Revenue (USD Billion) Forecast, by Segment 1, 2018-2029
Table 2: Global Biocompatibility Testing Solutions For Medical Devices Market Revenue (USD Billion) Forecast, by Segment 2, 2018-2029
Table 3: Global Biocompatibility Testing Solutions For Medical Devices Market Revenue (USD Billion) Forecast, by Segment 3, 2018-2029
Table 4: Global Biocompatibility Testing Solutions For Medical Devices Market Revenue (USD Billion) Forecast, by Region, 2018-2029
Table 5: North America Biocompatibility Testing Solutions For Medical Devices Market Revenue (USD Billion) Forecast, by Segment 1, 2018-2029
Table 6: North America Biocompatibility Testing Solutions For Medical Devices Market Revenue (USD Billion) Forecast, by Segment 2, 2018-2029
Table 7: North America Biocompatibility Testing Solutions For Medical Devices Market Revenue (USD Billion) Forecast, by Segment 3, 2018-2029
Table 8: North America Biocompatibility Testing Solutions For Medical Devices Market Revenue (USD Billion) Forecast, by Country, 2018-2029
Table 9: Europe Biocompatibility Testing Solutions For Medical Devices Market Revenue (USD Billion) Forecast, by Segment 1, 2018-2029
Table 10: Europe Biocompatibility Testing Solutions For Medical Devices Market Revenue (USD Billion) Forecast, by Segment 2, 2018-2029
Table 11: Europe Biocompatibility Testing Solutions For Medical Devices Market Revenue (USD Billion) Forecast, by Segment 3, 2018-2029
Table 12: Europe Biocompatibility Testing Solutions For Medical Devices Market Revenue (USD Billion) Forecast, by Country, 2018-2029
Table 13: Latin America Biocompatibility Testing Solutions For Medical Devices Market Revenue (USD Billion) Forecast, by Segment 1, 2018-2029
Table 14: Latin America Biocompatibility Testing Solutions For Medical Devices Market Revenue (USD Billion) Forecast, by Segment 2, 2018-2029
Table 15: Latin America Biocompatibility Testing Solutions For Medical Devices Market Revenue (USD Billion) Forecast, by Segment 3, 2018-2029
Table 16: Latin America Biocompatibility Testing Solutions For Medical Devices Market Revenue (USD Billion) Forecast, by Country, 2018-2029
Table 17: Asia Pacific Biocompatibility Testing Solutions For Medical Devices Market Revenue (USD Billion) Forecast, by Segment 1, 2018-2029
Table 18: Asia Pacific Biocompatibility Testing Solutions For Medical Devices Market Revenue (USD Billion) Forecast, by Segment 2, 2018-2029
Table 19: Asia Pacific Biocompatibility Testing Solutions For Medical Devices Market Revenue (USD Billion) Forecast, by Segment 3, 2018-2029
Table 20: Asia Pacific Biocompatibility Testing Solutions For Medical Devices Market Revenue (USD Billion) Forecast, by Country, 2018-2029
Table 21: Middle East & Africa Biocompatibility Testing Solutions For Medical Devices Market Revenue (USD Billion) Forecast, by Segment 1, 2018-2029
Table 22: Middle East & Africa Biocompatibility Testing Solutions For Medical Devices Market Revenue (USD Billion) Forecast, by Segment 2, 2018-2029
Table 23: Middle East & Africa Biocompatibility Testing Solutions For Medical Devices Market Revenue (USD Billion) Forecast, by Segment 3, 2018-2029
Table 24: Middle East & Africa Biocompatibility Testing Solutions For Medical Devices Market Revenue (USD Billion) Forecast, by Country, 2018-2029
Research Process
Data Library Research are conducted by industry experts who offer insight on
industry structure, market segmentations technology assessment and competitive landscape (CL), and penetration, as well as on emerging trends. Their analysis is based on primary interviews (~ 80%) and secondary research (~ 20%) as well as years of professional expertise in their respective industries. Adding to this, by analysing historical trends and current market positions, our analysts predict where the market will be headed for the next five years. Furthermore, the varying trends of segment & categories geographically presented are also studied and the estimated based on the primary & secondary research.
In this particular report from the supply side Data Library Research has conducted primary surveys (interviews) with the key level executives (VP, CEO’s, Marketing Director, Business Development Manager
and SOFT) of the companies that active & prominent as well as the midsized organization
FIGURE 1: DLR RESEARH PROCESS
![research-methodology1]()
Primary Research
Extensive primary research was conducted to gain a deeper insight of the market and industry performance. The analysis is based on both primary and secondary research as well as years of professional expertise in the respective industries.
In addition to analysing current and historical trends, our analysts predict where the market is headed over the next five years.
It varies by segment for these categories geographically presented in the list of market tables. Speaking about this particular report we have conducted primary surveys (interviews) with the key level executives (VP, CEO’s, Marketing Director, Business Development Manager and many more) of the major players active in the market.
Secondary Research
Secondary research was mainly used to collect and identify information useful for the extensive, technical, market-oriented, and Friend’s study of the Global Extra Neutral Alcohol. It was also used to obtain key information about major players, market classification and segmentation according to the industry trends, geographical markets, and developments related to the market and technology perspectives. For this study, analysts have gathered information from various credible sources, such as annual reports, sec filings, journals, white papers, SOFT presentations, and company web sites.
Market Size Estimation
Both, top-down and bottom-up approaches were used to estimate and validate the size of the Global market and to estimate the size of various other dependent submarkets in the overall Extra Neutral Alcohol. The key players in the market were identified through secondary research and their market contributions in the respective geographies were determined through primary and secondary research.
Forecast Model
![research-methodology2]()