AMOLED Display for Wearable Devices Market Overview and Analysis
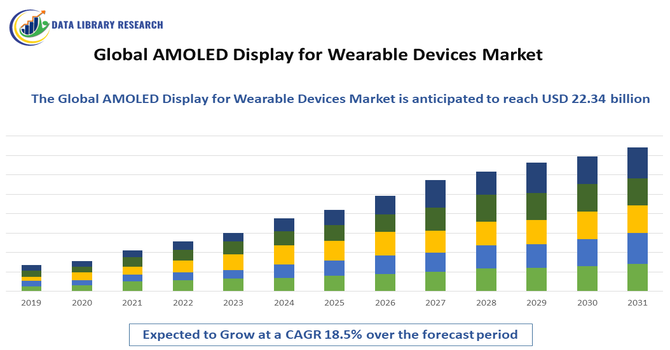
- The Global AMOLED Display for Wearable Devices Market is currently valued at USD 8.8 billion in 2025 and expected to reach 22.34 billion in 2032, and is forecasted to expand at a robust Compound Annual Growth Rate (CAGR) typically ranging from 18.5% through the forecast period, 2025-2032.
Get Complete Analysis Of The Report - Download Updated Free Sample PDF
The Global AMOLED Display for Wearable Devices Market is primarily driven by the rapid adoption of smartwatches, fitness trackers, and other wearable electronics, as consumers increasingly seek compact, high-resolution, and energy-efficient displays for on-the-go applications. AMOLED technology provides superior color reproduction, high contrast, thin form factors, and low power consumption, making it ideal for small wearable screens where battery life and visual clarity are critical.
AMOLED Display for Wearable Devices Market Latest Trends
The Global AMOLED Display for Wearable Devices Market is experiencing dynamic shifts driven by several key trends. Manufacturers are increasingly adopting high resolution, energy efficient AMOLED screens in smartwatches and fitness bands to deliver vibrant visuals and extended battery life for health monitoring and activity tracking, which remains a major usage driver. There’s also a rise in circular and larger display formats with slim bezels to maximize screen area on compact wearables. Additionally, advancements like LTPO backplanes enabling adaptive refresh rates help balance performance with power efficiency, while integration of AI driven interfaces and 5G connectivity pushes more immersive and responsive user experiences. These developments collectively shape the evolving AMOLED wearable landscape.
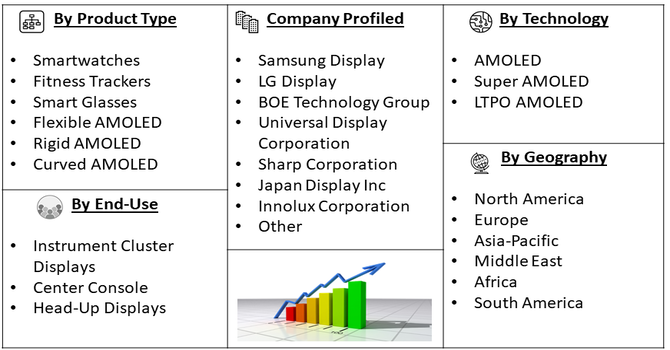
Segmentation: Global AMOLED Display for Wearable Devices Market is segmented By Device Type (Smartwatches, Fitness Trackers, Smart Glasses), Display Type (Flexible AMOLED, Rigid AMOLED, Curved AMOLED), Screen Size (Below 1.5 inches, 1.5–2.5 inches, Above 2.5 inches), Resolution (HD, Full HD, QHD), Technology (AMOLED, Super AMOLED, LTPO AMOLED), By End-User (Consumer Wearables, Healthcare & Fitness, Industrial), and Geography (North America, Europe, Asia-Pacific, Middle East and Africa, and South America). The report provides the value (in USD million) for the above segments.
For Detailed Market Segmentation - Get a Free Sample PDF
Market Drivers:
- Rising Adoption of Smart Wearables and Health Monitoring Devices
The growing popularity of wearable devices such as smartwatches, fitness trackers, and health monitors is a major driver of the AMOLED display market. Consumers increasingly rely on wearables to track fitness metrics, monitor heart rate, sleep patterns, and other health indicators, which require high-resolution, vibrant, and energy-efficient displays. AMOLED technology provides superior color accuracy, deep contrast, and reduced power consumption, making it ideal for small, always-on wearable screens. The trend of integrating health and lifestyle features into compact, stylish wearables continues to drive strong demand for AMOLED panels globally.
- Technological Advancements in Display and Form Factor
Continuous innovation in AMOLED technology is fueling market growth for wearable devices. Developments such as flexible and curved AMOLED panels, LTPO (Low-Temperature Polycrystalline Oxide) backplanes, and high pixel density displays enable more compact, lightweight, and energy-efficient designs without compromising visual performance. These advancements allow manufacturers to create aesthetically appealing devices with longer battery life and improved durability, meeting consumer expectations for convenience, comfort, and style. The combination of technological innovation and consumer demand for multifunctional wearables accelerates adoption of AMOLED displays in this segment.
Market Restraints:
- High Production Costs and Price Sensitivity
A major restraint for the Global AMOLED Display for Wearable Devices Market is the high manufacturing cost associated with AMOLED technology. Producing flexible, high-resolution, and energy-efficient displays for compact wearable devices requires advanced materials, precision fabrication, and stringent quality control. These factors increase the cost of the end product, which is often reflected in the retail price of wearables. In price-sensitive markets, higher costs can limit adoption, particularly for mid-range or budget smartwatches and fitness trackers. This price barrier slows penetration in emerging economies and restricts growth in certain consumer segments.
Socioeconomic Impact on AMOLED Display for the Wearable Devices Market
The global AMOLED display market for wearable devices has significant socioeconomic impact by enhancing connectivity, health monitoring, and lifestyle convenience. High-quality displays in smartwatches, fitness trackers, and AR/VR devices enable accurate health tracking, notifications, and immersive experiences, improving daily life and personal well-being. Rising demand for wearable technology creates employment opportunities in display manufacturing, software development, and supply chains, especially in Asia-Pacific and other developing regions. The market also drives innovation in miniaturization, low-power consumption, and flexible displays, supporting startups and tech enterprises. Additionally, widespread adoption of AMOLED wearables promotes digital inclusion, encourages smart living, and stimulates economic growth through consumer spending, investment in research, and regional technological advancement in electronics and healthcare sectors worldwide.
Segmental Analysis:
- Smartwatches segment is expected to witness the highest growth over the forecast period
Smartwatches dominate the wearable devices segment due to their multifunctional capabilities, including notifications, health tracking, and fitness monitoring. The adoption of AMOLED displays in smartwatches is growing because these displays offer high contrast ratios, better battery efficiency, and vibrant colors, which enhance user experience. Rising consumer awareness about health and connected lifestyles is driving the demand for AMOLED-equipped smartwatches globally.
- Flexible AMOLED segment is expected to witness the highest growth over the forecast period
Flexible AMOLED displays are increasingly preferred in wearable devices for their ability to bend and conform to various designs. These displays enable thinner, lighter, and more ergonomic wearables, such as curved smart bands and wrist-worn fitness trackers. Additionally, flexible AMOLED displays support innovative designs and provide better durability, attracting premium wearable manufacturers to adopt them.
- 1.5–2.5 inches segment is expected to witness the highest growth over the forecast period
The 1.5–2.5 inches screen size segment is the most commonly used in wearable devices, offering an optimal balance between display readability and device compactness. AMOLED displays in this size range deliver sharp visuals and high brightness while conserving power, which is critical for wearable devices with limited battery capacity. This segment sees strong adoption in both fitness trackers and smartwatches.
- Full HD segment is expected to witness the highest growth over the forecast period
Full HD resolution provides clear and crisp visuals for wearable devices, enhancing the user experience for multimedia content, notifications, and fitness metrics. AMOLED displays with Full HD resolution offer superior contrast and color accuracy compared to lower-resolution screens, making them suitable for premium smartwatches and high-end fitness trackers.
- LTPO AMOLED segment is expected to witness highest growth over the forecast period
LTPO (Low-Temperature Polycrystalline Oxide) AMOLED technology enables dynamic refresh rates, reducing power consumption significantly. This technology is particularly useful for smartwatches and other wearables where battery life is a key constraint. LTPO AMOLED displays allow smooth animations, high refresh rates, and efficient energy management, making them highly desirable in advanced wearable devices
- Consumer Wearables segment is expected to witness highest growth over the forecast period
The consumer wearables segment is the largest end-user for AMOLED displays, driven by lifestyle and fitness trends. Smartwatches and fitness trackers with AMOLED displays are increasingly adopted by consumers for their vibrant visuals, durability, and energy efficiency. The rising preference for stylish, multifunctional devices also contributes to the growth of this segment.
The healthcare and medical wearables segment is emerging as a significant contributor to AMOLED display adoption. Devices such as heart rate monitors, glucose trackers, and wearable ECG systems rely on high-resolution, energy-efficient AMOLED screens to deliver accurate real-time data and clear visuals. Growing awareness of preventive healthcare and remote patient monitoring is driving demand, while technological advancements in flexible and compact AMOLED displays enable more comfortable, user-friendly designs.
- Asia-Pacific segment is expected to witness highest growth over the forecast period
The Asia-Pacific region is expected to witness the highest growth over the forecast period in the global AMOLED display market for wearable devices. This growth is driven by increasing smartphone and wearable adoption, rising health awareness, and a tech-savvy young population in countries such as China, India, Japan, and South Korea.
Strong presence of display manufacturers, electronics suppliers, and wearable device brands enhances production capabilities and technological innovation in the region. Expanding e-commerce platforms and growing disposable incomes are also making advanced AMOLED wearables more accessible. Additionally, government initiatives supporting digital health, smart devices, and innovation in consumer electronics are further accelerating market adoption, positioning Asia-Pacific as the leading growth hub for AMOLED wearable displays globally.
| Report Matrics |
Details |
| Market Size Value |
USD 22.34 billion |
| Growth Rate |
CAGR of 18.5 % |
| Forecast |
2026-2033 |
| Historical data |
2021-2024 |
| Base Year |
2025 |
| Report Coverage |
Forecasted revenue, company rating, competitive environment, growth drivers, and trends |
| Segment Coverage |
Type, Application, End-User, Geography |
| Regional Scope |
North America, Europe, Asia Pacific, Middle East |
| Customized scope |
Free customization of reports (With 3 months' analysis support) |
| To Learn More About This Report |
Request a Free Sample Copy |
AMOLED Display for Wearable Devices Market Competitive Landscape
The Global AMOLED Display for Wearable Devices Market is highly competitive and characterized by the presence of both established global display giants and emerging regional specialists, each striving to innovate and capture greater market share. Leading players such as Samsung Display and LG Display maintain a strong foothold owing to their deep technological expertise, large-scale manufacturing capabilities, and extensive R&D investments, which enable them to consistently deliver high performance AMOLED panels for wearable applications such as smartwatches and fitness trackers.
Key Players:
- Samsung Display
- LG Display
- BOE Technology Group
- Universal Display Corporation
- Sharp Corporation
- Japan Display Inc
- Innolux Corporation
- AU Optronics
- Tianma Microelectronics
- Visionox Technology
- EverDisplay Optronics (EDO)
- China Star Optoelectronics Technology (CSOT)
- Royole Corporation
- Truly International Holdings
- HannStar Display Corporation
- RITEK Corporation
- JOLED
- Futaba Corporation
- Xiaomi (panel integration partner)
- Vivo (panel integration partner)
Recent Development
- In 2024, The launch of IIT Madras’s AMOLED Research Centre (ARC) strengthens the global AMOLED wearable devices market by advancing next-generation display innovation. Supported by MeitY, DRDO, and Tata Sons, the Centre fosters research in smartphones, tablets, watches, and wearables, while its state-of-the-art cleanroom and advanced equipment enable high-quality fabrication and testing. This initiative enhances India’s display manufacturing capabilities, promotes technological development, and contributes to faster adoption of AMOLED displays in wearable devices worldwide.
- In January 2024, Samsung Electronics’ launch of advanced QLED, Micro LED, and OLED display lineups, featuring next-generation AI processors, is influencing the global AMOLED wearable devices market by setting new benchmarks in smart display performance. Enhanced visuals, energy efficiency, and AI-powered features inspire innovation in wearable technology, while security integration with Samsung Knox builds consumer trust. These developments drive adoption, encourage multifunctional device designs, and accelerate growth in the AMOLED wearable segment worldwide.
Frequently Asked Questions (FAQ) :
Q1. What are the main growth-driving factors for this market?
The primary driver is the demand for "always-on" displays that don't drain battery life. AMOLED screens only light up individual pixels, making them incredibly power-efficient for smartwatches. Additionally, the growing consumer focus on health monitoring and fitness tracking requires vibrant, high-contrast screens that are easily readable outdoors during physical activities.
Q2. What are the main restraining factors for this market?
The main restraint is the high cost of manufacturing small, high-pixel-density AMOLED panels compared to cheaper LCD alternatives. Furthermore, wearable devices are prone to physical impact and constant exposure to the elements, which can lead to screen damage. The limited lifespan of organic materials under constant "always-on" usage also remains a technical hurdle for manufacturers.
Q3. Which segment is expected to witness high growth?
The Smartwatch segment is expected to witness the highest growth. As these devices evolve from simple trackers into independent communication tools, users demand smartphone-quality visuals on their wrists. The shift toward circular and curved watch designs specifically favors AMOLED technology, which can be manufactured on flexible substrates to fit unique, stylish form factors.
Q4. Who are the top major players for this market?
The market is dominated by display giants that have mastered miniaturized OLED production. Key players include Samsung Display, LG Display, BOE Technology, and Everdisplay Optronics (EDO). Samsung and LG are the primary suppliers for major brands like Apple and Garmin, while BOE is rapidly capturing the growing mid-range fitness tracker market.
Q5. Which country is the largest player?
China has emerged as the largest player in the wearable AMOLED market by volume. While South Korea leads in high-end technology, China's massive ecosystem for manufacturing affordable fitness bands and smartwatches has driven enormous production scales. Government subsidies for display "fabs" have allowed Chinese companies to dominate the supply chain for most global wearable brands.
List of Figures
Figure 1: Global AMOLED Display for Wearable Devices Market Revenue Breakdown (USD Billion, %) by Region, 2022 & 2029
Figure 2: Global AMOLED Display for Wearable Devices Market Value Share (%), By Segment 1, 2022 & 2029
Figure 3: Global AMOLED Display for Wearable Devices Market Forecast (USD Billion), by Sub-Segment 1, 2018-2029
Figure 4: Global AMOLED Display for Wearable Devices Market Forecast (USD Billion), by Sub-Segment 2, 2018-2029
Figure 5: Global AMOLED Display for Wearable Devices Market Value Share (%), By Segment 2, 2022 & 2029
Figure 6: Global AMOLED Display for Wearable Devices Market Forecast (USD Billion), by Sub-Segment 1, 2018-2029
Figure 7: Global AMOLED Display for Wearable Devices Market Forecast (USD Billion), by Sub-Segment 2, 2018-2029
Figure 8: Global AMOLED Display for Wearable Devices Market Forecast (USD Billion), by Sub-Segment 3, 2018-2029
Figure 9: Global AMOLED Display for Wearable Devices Market Forecast (USD Billion), by Others, 2018-2029
Figure 10: Global AMOLED Display for Wearable Devices Market Value Share (%), By Segment 3, 2022 & 2029
Figure 11: Global AMOLED Display for Wearable Devices Market Forecast (USD Billion), by Sub-Segment 1, 2018-2029
Figure 12: Global AMOLED Display for Wearable Devices Market Forecast (USD Billion), by Sub-Segment 2, 2018-2029
Figure 13: Global AMOLED Display for Wearable Devices Market Forecast (USD Billion), by Sub-Segment 3, 2018-2029
Figure 14: Global AMOLED Display for Wearable Devices Market Forecast (USD Billion), by Others, 2018-2029
Figure 15: Global AMOLED Display for Wearable Devices Market Value (USD Billion), by Region, 2022 & 2029
Figure 16: North America AMOLED Display for Wearable Devices Market Value Share (%), By Segment 1, 2022 & 2029
Figure 17: North America AMOLED Display for Wearable Devices Market Forecast (USD Billion), by Sub-Segment 1, 2018-2029
Figure 18: North America AMOLED Display for Wearable Devices Market Forecast (USD Billion), by Sub-Segment 2, 2018-2029
Figure 19: North America AMOLED Display for Wearable Devices Market Value Share (%), By Segment 2, 2022 & 2029
Figure 20: North America AMOLED Display for Wearable Devices Market Forecast (USD Billion), by Sub-Segment 1, 2018-2029
Figure 21: North America AMOLED Display for Wearable Devices Market Forecast (USD Billion), by Sub-Segment 2, 2018-2029
Figure 22: North America AMOLED Display for Wearable Devices Market Forecast (USD Billion), by Sub-Segment 3, 2018-2029
Figure 23: North America AMOLED Display for Wearable Devices Market Forecast (USD Billion), by Others, 2018-2029
Figure 24: North America AMOLED Display for Wearable Devices Market Value Share (%), By Segment 3, 2022 & 2029
Figure 25: North America AMOLED Display for Wearable Devices Market Forecast (USD Billion), by Sub-Segment 1, 2018-2029
Figure 26: North America AMOLED Display for Wearable Devices Market Forecast (USD Billion), by Sub-Segment 2, 2018-2029
Figure 27: North America AMOLED Display for Wearable Devices Market Forecast (USD Billion), by Sub-Segment 3, 2018-2029
Figure 28: North America AMOLED Display for Wearable Devices Market Forecast (USD Billion), by Others, 2018-2029
Figure 29: North America AMOLED Display for Wearable Devices Market Forecast (USD Billion), by U.S., 2018-2029
Figure 30: North America AMOLED Display for Wearable Devices Market Forecast (USD Billion), by Canada, 2018-2029
Figure 31: Latin America AMOLED Display for Wearable Devices Market Value Share (%), By Segment 1, 2022 & 2029
Figure 32: Latin America AMOLED Display for Wearable Devices Market Forecast (USD Billion), by Sub-Segment 1, 2018-2029
Figure 33: Latin America AMOLED Display for Wearable Devices Market Forecast (USD Billion), by Sub-Segment 2, 2018-2029
Figure 34: Latin America AMOLED Display for Wearable Devices Market Value Share (%), By Segment 2, 2022 & 2029
Figure 35: Latin America AMOLED Display for Wearable Devices Market Forecast (USD Billion), by Sub-Segment 1, 2018-2029
Figure 36: Latin America AMOLED Display for Wearable Devices Market Forecast (USD Billion), by Sub-Segment 2, 2018-2029
Figure 37: Latin America AMOLED Display for Wearable Devices Market Forecast (USD Billion), by Sub-Segment 3, 2018-2029
Figure 38: Latin America AMOLED Display for Wearable Devices Market Forecast (USD Billion), by Others, 2018-2029
Figure 39: Latin America AMOLED Display for Wearable Devices Market Value Share (%), By Segment 3, 2022 & 2029
Figure 40: Latin America AMOLED Display for Wearable Devices Market Forecast (USD Billion), by Sub-Segment 1, 2018-2029
Figure 41: Latin America AMOLED Display for Wearable Devices Market Forecast (USD Billion), by Sub-Segment 2, 2018-2029
Figure 42: Latin America AMOLED Display for Wearable Devices Market Forecast (USD Billion), by Sub-Segment 3, 2018-2029
Figure 43: Latin America AMOLED Display for Wearable Devices Market Forecast (USD Billion), by Others, 2018-2029
Figure 44: Latin America AMOLED Display for Wearable Devices Market Forecast (USD Billion), by Brazil, 2018-2029
Figure 45: Latin America AMOLED Display for Wearable Devices Market Forecast (USD Billion), by Mexico, 2018-2029
Figure 46: Latin America AMOLED Display for Wearable Devices Market Forecast (USD Billion), by Rest of Latin America, 2018-2029
Figure 47: Europe AMOLED Display for Wearable Devices Market Value Share (%), By Segment 1, 2022 & 2029
Figure 48: Europe AMOLED Display for Wearable Devices Market Forecast (USD Billion), by Sub-Segment 1, 2018-2029
Figure 49: Europe AMOLED Display for Wearable Devices Market Forecast (USD Billion), by Sub-Segment 2, 2018-2029
Figure 50: Europe AMOLED Display for Wearable Devices Market Value Share (%), By Segment 2, 2022 & 2029
Figure 51: Europe AMOLED Display for Wearable Devices Market Forecast (USD Billion), by Sub-Segment 1, 2018-2029
Figure 52: Europe AMOLED Display for Wearable Devices Market Forecast (USD Billion), by Sub-Segment 2, 2018-2029
Figure 53: Europe AMOLED Display for Wearable Devices Market Forecast (USD Billion), by Sub-Segment 3, 2018-2029
Figure 54: Europe AMOLED Display for Wearable Devices Market Forecast (USD Billion), by Others, 2018-2029
Figure 55: Europe AMOLED Display for Wearable Devices Market Value Share (%), By Segment 3, 2022 & 2029
Figure 56: Europe AMOLED Display for Wearable Devices Market Forecast (USD Billion), by Sub-Segment 1, 2018-2029
Figure 57: Europe AMOLED Display for Wearable Devices Market Forecast (USD Billion), by Sub-Segment 2, 2018-2029
Figure 58: Europe AMOLED Display for Wearable Devices Market Forecast (USD Billion), by Sub-Segment 3, 2018-2029
Figure 59: Europe AMOLED Display for Wearable Devices Market Forecast (USD Billion), by Others, 2018-2029
Figure 60: Europe AMOLED Display for Wearable Devices Market Forecast (USD Billion), by U.K., 2018-2029
Figure 61: Europe AMOLED Display for Wearable Devices Market Forecast (USD Billion), by Germany, 2018-2029
Figure 62: Europe AMOLED Display for Wearable Devices Market Forecast (USD Billion), by France, 2018-2029
Figure 63: Europe AMOLED Display for Wearable Devices Market Forecast (USD Billion), by Italy, 2018-2029
Figure 64: Europe AMOLED Display for Wearable Devices Market Forecast (USD Billion), by Spain, 2018-2029
Figure 65: Europe AMOLED Display for Wearable Devices Market Forecast (USD Billion), by Russia, 2018-2029
Figure 66: Europe AMOLED Display for Wearable Devices Market Forecast (USD Billion), by Rest of Europe, 2018-2029
Figure 67: Asia Pacific AMOLED Display for Wearable Devices Market Value Share (%), By Segment 1, 2022 & 2029
Figure 68: Asia Pacific AMOLED Display for Wearable Devices Market Forecast (USD Billion), by Sub-Segment 1, 2018-2029
Figure 69: Asia Pacific AMOLED Display for Wearable Devices Market Forecast (USD Billion), by Sub-Segment 2, 2018-2029
Figure 70: Asia Pacific AMOLED Display for Wearable Devices Market Value Share (%), By Segment 2, 2022 & 2029
Figure 71: Asia Pacific AMOLED Display for Wearable Devices Market Forecast (USD Billion), by Sub-Segment 1, 2018-2029
Figure 72: Asia Pacific AMOLED Display for Wearable Devices Market Forecast (USD Billion), by Sub-Segment 2, 2018-2029
Figure 73: Asia Pacific AMOLED Display for Wearable Devices Market Forecast (USD Billion), by Sub-Segment 3, 2018-2029
Figure 74: Asia Pacific AMOLED Display for Wearable Devices Market Forecast (USD Billion), by Others, 2018-2029
Figure 75: Asia Pacific AMOLED Display for Wearable Devices Market Value Share (%), By Segment 3, 2022 & 2029
Figure 76: Asia Pacific AMOLED Display for Wearable Devices Market Forecast (USD Billion), by Sub-Segment 1, 2018-2029
Figure 77: Asia Pacific AMOLED Display for Wearable Devices Market Forecast (USD Billion), by Sub-Segment 2, 2018-2029
Figure 78: Asia Pacific AMOLED Display for Wearable Devices Market Forecast (USD Billion), by Sub-Segment 3, 2018-2029
Figure 79: Asia Pacific AMOLED Display for Wearable Devices Market Forecast (USD Billion), by Others, 2018-2029
Figure 80: Asia Pacific AMOLED Display for Wearable Devices Market Forecast (USD Billion), by China, 2018-2029
Figure 81: Asia Pacific AMOLED Display for Wearable Devices Market Forecast (USD Billion), by India, 2018-2029
Figure 82: Asia Pacific AMOLED Display for Wearable Devices Market Forecast (USD Billion), by Japan, 2018-2029
Figure 83: Asia Pacific AMOLED Display for Wearable Devices Market Forecast (USD Billion), by Australia, 2018-2029
Figure 84: Asia Pacific AMOLED Display for Wearable Devices Market Forecast (USD Billion), by Southeast Asia, 2018-2029
Figure 85: Asia Pacific AMOLED Display for Wearable Devices Market Forecast (USD Billion), by Rest of Asia Pacific, 2018-2029
Figure 86: Middle East & Africa AMOLED Display for Wearable Devices Market Value Share (%), By Segment 1, 2022 & 2029
Figure 87: Middle East & Africa AMOLED Display for Wearable Devices Market Forecast (USD Billion), by Sub-Segment 1, 2018-2029
Figure 88: Middle East & Africa AMOLED Display for Wearable Devices Market Forecast (USD Billion), by Sub-Segment 2, 2018-2029
Figure 89: Middle East & Africa AMOLED Display for Wearable Devices Market Value Share (%), By Segment 2, 2022 & 2029
Figure 90: Middle East & Africa AMOLED Display for Wearable Devices Market Forecast (USD Billion), by Sub-Segment 1, 2018-2029
Figure 91: Middle East & Africa AMOLED Display for Wearable Devices Market Forecast (USD Billion), by Sub-Segment 2, 2018-2029
Figure 92: Middle East & Africa AMOLED Display for Wearable Devices Market Forecast (USD Billion), by Sub-Segment 3, 2018-2029
Figure 93: Middle East & Africa AMOLED Display for Wearable Devices Market Forecast (USD Billion), by Others, 2018-2029
Figure 94: Middle East & Africa AMOLED Display for Wearable Devices Market Value Share (%), By Segment 3, 2022 & 2029
Figure 95: Middle East & Africa AMOLED Display for Wearable Devices Market Forecast (USD Billion), by Sub-Segment 1, 2018-2029
Figure 96: Middle East & Africa AMOLED Display for Wearable Devices Market Forecast (USD Billion), by Sub-Segment 2, 2018-2029
Figure 97: Middle East & Africa AMOLED Display for Wearable Devices Market Forecast (USD Billion), by Sub-Segment 3, 2018-2029
Figure 98: Middle East & Africa AMOLED Display for Wearable Devices Market Forecast (USD Billion), by Others, 2018-2029
Figure 99: Middle East & Africa AMOLED Display for Wearable Devices Market Forecast (USD Billion), by GCC, 2018-2029
Figure 100: Middle East & Africa AMOLED Display for Wearable Devices Market Forecast (USD Billion), by South Africa, 2018-2029
Figure 101: Middle East & Africa AMOLED Display for Wearable Devices Market Forecast (USD Billion), by Rest of Middle East & Africa, 2018-2029
List of Tables
Table 1: Global AMOLED Display for Wearable Devices Market Revenue (USD Billion) Forecast, by Segment 1, 2018-2029
Table 2: Global AMOLED Display for Wearable Devices Market Revenue (USD Billion) Forecast, by Segment 2, 2018-2029
Table 3: Global AMOLED Display for Wearable Devices Market Revenue (USD Billion) Forecast, by Segment 3, 2018-2029
Table 4: Global AMOLED Display for Wearable Devices Market Revenue (USD Billion) Forecast, by Region, 2018-2029
Table 5: North America AMOLED Display for Wearable Devices Market Revenue (USD Billion) Forecast, by Segment 1, 2018-2029
Table 6: North America AMOLED Display for Wearable Devices Market Revenue (USD Billion) Forecast, by Segment 2, 2018-2029
Table 7: North America AMOLED Display for Wearable Devices Market Revenue (USD Billion) Forecast, by Segment 3, 2018-2029
Table 8: North America AMOLED Display for Wearable Devices Market Revenue (USD Billion) Forecast, by Country, 2018-2029
Table 9: Europe AMOLED Display for Wearable Devices Market Revenue (USD Billion) Forecast, by Segment 1, 2018-2029
Table 10: Europe AMOLED Display for Wearable Devices Market Revenue (USD Billion) Forecast, by Segment 2, 2018-2029
Table 11: Europe AMOLED Display for Wearable Devices Market Revenue (USD Billion) Forecast, by Segment 3, 2018-2029
Table 12: Europe AMOLED Display for Wearable Devices Market Revenue (USD Billion) Forecast, by Country, 2018-2029
Table 13: Latin America AMOLED Display for Wearable Devices Market Revenue (USD Billion) Forecast, by Segment 1, 2018-2029
Table 14: Latin America AMOLED Display for Wearable Devices Market Revenue (USD Billion) Forecast, by Segment 2, 2018-2029
Table 15: Latin America AMOLED Display for Wearable Devices Market Revenue (USD Billion) Forecast, by Segment 3, 2018-2029
Table 16: Latin America AMOLED Display for Wearable Devices Market Revenue (USD Billion) Forecast, by Country, 2018-2029
Table 17: Asia Pacific AMOLED Display for Wearable Devices Market Revenue (USD Billion) Forecast, by Segment 1, 2018-2029
Table 18: Asia Pacific AMOLED Display for Wearable Devices Market Revenue (USD Billion) Forecast, by Segment 2, 2018-2029
Table 19: Asia Pacific AMOLED Display for Wearable Devices Market Revenue (USD Billion) Forecast, by Segment 3, 2018-2029
Table 20: Asia Pacific AMOLED Display for Wearable Devices Market Revenue (USD Billion) Forecast, by Country, 2018-2029
Table 21: Middle East & Africa AMOLED Display for Wearable Devices Market Revenue (USD Billion) Forecast, by Segment 1, 2018-2029
Table 22: Middle East & Africa AMOLED Display for Wearable Devices Market Revenue (USD Billion) Forecast, by Segment 2, 2018-2029
Table 23: Middle East & Africa AMOLED Display for Wearable Devices Market Revenue (USD Billion) Forecast, by Segment 3, 2018-2029
Table 24: Middle East & Africa AMOLED Display for Wearable Devices Market Revenue (USD Billion) Forecast, by Country, 2018-2029
Research Process
Data Library Research are conducted by industry experts who offer insight on
industry structure, market segmentations technology assessment and competitive landscape (CL), and penetration, as well as on emerging trends. Their analysis is based on primary interviews (~ 80%) and secondary research (~ 20%) as well as years of professional expertise in their respective industries. Adding to this, by analysing historical trends and current market positions, our analysts predict where the market will be headed for the next five years. Furthermore, the varying trends of segment & categories geographically presented are also studied and the estimated based on the primary & secondary research.
In this particular report from the supply side Data Library Research has conducted primary surveys (interviews) with the key level executives (VP, CEO’s, Marketing Director, Business Development Manager
and SOFT) of the companies that active & prominent as well as the midsized organization
FIGURE 1: DLR RESEARH PROCESS
![research-methodology1]()
Primary Research
Extensive primary research was conducted to gain a deeper insight of the market and industry performance. The analysis is based on both primary and secondary research as well as years of professional expertise in the respective industries.
In addition to analysing current and historical trends, our analysts predict where the market is headed over the next five years.
It varies by segment for these categories geographically presented in the list of market tables. Speaking about this particular report we have conducted primary surveys (interviews) with the key level executives (VP, CEO’s, Marketing Director, Business Development Manager and many more) of the major players active in the market.
Secondary Research
Secondary research was mainly used to collect and identify information useful for the extensive, technical, market-oriented, and Friend’s study of the Global Extra Neutral Alcohol. It was also used to obtain key information about major players, market classification and segmentation according to the industry trends, geographical markets, and developments related to the market and technology perspectives. For this study, analysts have gathered information from various credible sources, such as annual reports, sec filings, journals, white papers, SOFT presentations, and company web sites.
Market Size Estimation
Both, top-down and bottom-up approaches were used to estimate and validate the size of the Global market and to estimate the size of various other dependent submarkets in the overall Extra Neutral Alcohol. The key players in the market were identified through secondary research and their market contributions in the respective geographies were determined through primary and secondary research.
Forecast Model
![research-methodology2]()