Third Generation Semiconductor Discrete Devices Market Overview and Analysis:
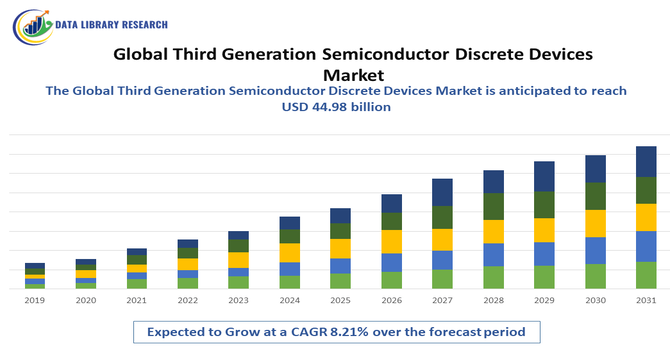
- The global third-generation semiconductor discrete devices market is expected to reach USD 35.51 billion in 2025 and is expected to reach USD 44.98 billion by 2032, grow at a CAGR of 8.21% from 2025-2032.
Get Complete Analysis Of The Report - Download Updated Free Sample PDF
Global third-generation semiconductor discrete devices are advanced electronic components made from wide bandgap materials like GaN and SiC. They offer higher efficiency, faster switching, and superior thermal performance compared to silicon devices, enabling improved energy management, power electronics, and high-performance applications across automotive, renewable energy, and industrial sectors worldwide. @@@@@ The growth of the global third-generation semiconductor discrete devices market is primarily driven by the increasing adoption of wide bandgap materials like Gallium Nitride (GaN) and Silicon Carbide (SiC), which offer higher efficiency, better thermal performance, and superior voltage handling compared to traditional silicon devices. Rising demand from the electric vehicle sector to enhance powertrain efficiency and battery management, coupled with the integration of these devices in renewable energy systems such as solar and wind inverters, is further fueling market expansion.
Third Generation Semiconductor Discrete Devices Market Latest Trends:
The global third-generation semiconductor discrete devices market is witnessing several key trends in 2025, driven by technological advancements and evolving industry needs. A major trend is the advancement in Gallium Nitride (GaN) technology, highlighted by Infineon Technologies producing GaN chips on 300mm wafers, allowing for 2.3 times more chips per wafer compared to 200mm wafers, reducing production costs and enhancing scalability in power electronics. Another trend is the integration of GaN and Silicon Carbide (SiC) devices with next-generation AI infrastructure, as demonstrated by Navitas Semiconductor’s development of power chips for 800-volt direct current (VDC) delivery in AI data centers, eliminating extra converters, reducing copper usage, and improving energy efficiency.
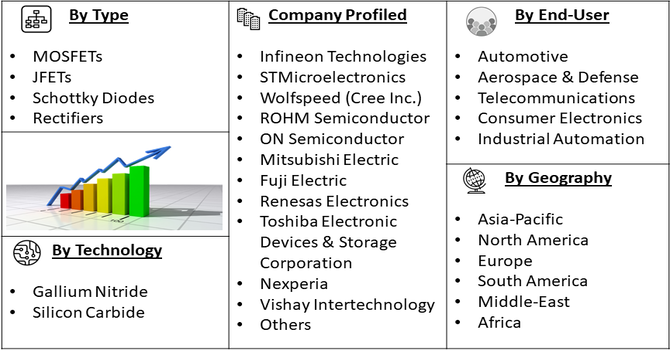
Segmentation: Global Third Generation Semiconductor Discrete Devices Market is segmented By Product Type (MOSFETs, JFETs, Schottky Diodes, Rectifiers), Technology (Gallium Nitride, Silicon Carbide), Application (Automotive, Renewable Energy, Industrial, Telecommunications, Consumer Electronics), End-User Industry (Automotive, Aerospace & Defense, Telecommunications, Consumer Electronics, Industrial Automation), and Geography (North America, Europe, Asia-Pacific, Middle East and Africa, and South America). The report provides the value (in USD million) for the above segments.
For Detailed Market Segmentation - Get a Free Sample PDF
Market Drivers:
- Adoption of Wide Bandgap Materials
The transition from conventional silicon-based semiconductors to wide bandgap (WBG) materials such as Gallium Nitride (GaN) and Silicon Carbide (SiC) is a major driver for the market. These materials allow devices to operate at higher voltages, frequencies, and temperatures while maintaining greater efficiency and lower energy losses. As a result, GaN and SiC-based discrete devices are increasingly preferred in high-performance applications across automotive, industrial, and consumer electronics sectors, fueling market growth.
- Rising Demand in Electric Vehicles and Renewable Energy
The global shift toward electric vehicles (EVs) and renewable energy solutions is driving demand for third-generation semiconductor discrete devices. EVs require highly efficient powertrain components, such as inverters and battery management systems, which benefit from the superior thermal and voltage performance of GaN and SiC devices. Similarly, renewable energy systems like solar inverters and wind converters rely on these devices to maximize energy efficiency and reliability, creating substantial growth opportunities in the market.
Market Restraints:
The production of wide bandgap (WBG) semiconductors, such as Gallium Nitride (GaN) and Silicon Carbide (SiC), involves complex processes and specialized equipment, leading to higher manufacturing costs compared to traditional silicon-based devices. These elevated costs can hinder widespread adoption, particularly in price-sensitive applications. However, despite the higher initial costs, WBG semiconductors offer significant long-term benefits, including improved energy efficiency, higher power density, and enhanced thermal performance. These advantages lead to reduced operational expenses and longer device lifespans, making them cost-effective over time. As manufacturing technologies advance and economies of scale are achieved, production costs are expected to decrease, further driving adoption across various industries. Additionally, the growing demand for renewable energy, electric vehicles, and high-performance electronics is accelerating investment in WBG semiconductor development, ultimately supporting broader market growth and technological innovation.
Socio Economic Impact on Third Generation Semiconductor Discrete Devices Market
The global third-generation semiconductor discrete devices market has a profound socioeconomic impact by driving advancements in electronics, energy, and automotive industries. These devices, made from materials like silicon carbide and gallium nitride, enable higher efficiency, faster switching, and greater thermal stability, which improve the performance and energy efficiency of various technologies. This advancement supports the growth of clean energy solutions, electric vehicles, and telecommunications, fostering sustainable development. The market stimulates job creation in high-tech manufacturing, research, and development sectors, contributing to economic growth and technological innovation worldwide. Additionally, increased adoption of these devices enhances industrial competitiveness, reduces energy costs, and promotes environmental sustainability, benefiting both developed and emerging economies by supporting digital transformation and green technology initiatives.
Segmental Analysis:
- Gallium Nitride segment is expected to witness highest growth over the forecast period
GaN-based devices are experiencing the fastest growth within the technology segment. Their ability to operate at higher voltages, frequencies, and temperatures while maintaining low energy losses makes them ideal for applications in EVs, 5G telecommunications infrastructure, and compact consumer electronics, driving rapid adoption across multiple sectors. In October 2025, Alpha and Omega Semiconductor Limited (AOS) announced its support for the power requirements of NVIDIA’s innovative 800 VDC architecture, designed for next-generation AI data centers with megawatt-scale racks to handle rapidly growing AI workloads. By providing advanced discrete power and wide bandgap devices, AOS strengthened its role in enabling high-efficiency, high-performance power solutions. This development positively impacted the global third-generation semiconductor discrete devices market, particularly driving demand for Gallium Nitride (GaN) devices, as AI and high-power computing applications increasingly require reliable, energy-efficient wide bandgap semiconductor solutions.
- Automotive segment is expected to witness highest growth over the forecast period
The automotive sector is a major application segment, particularly with the increasing penetration of electric vehicles (EVs). Third-generation semiconductor devices are used in EV powertrains, onboard chargers, and battery management systems, improving efficiency, range, and reliability, which is fueling demand in this segment. For instance, Navitas Semiconductor showcased its innovations for AI data centers, EVs, and mobile technology at CES 2025 in Las Vegas, highlighting the world’s first 8.5 kW AI data center power supply and high-efficiency GaN power ICs. This strengthened the global third-generation semiconductor discrete devices market, accelerating GaN and SiC adoption and enhancing power efficiency in the automotive segment.
- Industrial Automation segment is expected to witness highest growth over the forecast period
Industrial automation relies heavily on these devices for motor drives, robotics, and power supplies. The enhanced thermal performance and high-voltage handling capabilities of GaN and SiC devices allow industries to achieve higher energy efficiency, reduce downtime, and support the transition to more automated and electrified manufacturing processes.
- North America region is expected to witness highest growth over the forecast period
The North America region is expected to witness the highest growth in the global third-generation semiconductor discrete devices market over the forecast period. This growth is driven by the region's strong presence of key semiconductor manufacturers, substantial investments in research and development, and the increasing adoption of electric vehicles, renewable energy systems, and advanced industrial automation. For instance, in September 2025, Wolfspeed, Inc. announced the commercial launch of its 200mm silicon carbide (SiC) materials products, marking a key milestone in accelerating the industry’s shift from silicon to SiC. Following positive feedback from initial customers, the company released 200mm SiC wafers and epitaxy for immediate qualification. This launch enhanced scalability and quality for high-performance power devices, strengthening the global third-generation semiconductor discrete devices market and boosting North America’s position in advanced SiC technology adoption.
Additionally, the expansion of 5G telecommunications infrastructure and the demand for energy-efficient consumer electronics further support market growth. The combination of technological innovation, supportive industrial policies, and a well-established supply chain makes North America a leading region in the adoption of Gallium Nitride (GaN) and Silicon Carbide (SiC) devices.
| Report Matrics |
Details |
| Market Size Value |
USD 44.98 billion |
| Growth Rate |
CAGR of 8.21% |
| Forecast |
2026-2033 |
| Historical data |
2021-2024 |
| Base Year |
2025 |
| Report Coverage |
Forecasted revenue, company rating, competitive environment, growth drivers, and trends |
| Segment Coverage |
Type, Application, End-User, Geography |
| Regional Scope |
North America, Europe, Asia Pacific, Middle East |
| Customized scope |
Free customization of reports (With 3 months Analysis Support ) |
| To Learn More About This Report |
Request a Free Sample Copy |
Third Generation Semiconductor Discrete Devices Market Competitive Landscape
The global third-generation semiconductor discrete devices market is characterized by intense competition among established industry leaders and emerging innovators. Key players are focusing on technological advancements, strategic partnerships, and expanding production capacities to capitalize on the growing demand for Gallium Nitride (GaN) and Silicon Carbide (SiC) devices.
Notable companies in this sector include:
- Infineon Technologies
- STMicroelectronics
- Wolfspeed (Cree Inc.)
- ROHM Semiconductor
- ON Semiconductor
- Mitsubishi Electric
- Fuji Electric
- Renesas Electronics
- Toshiba Electronic Devices & Storage Corporation
- Nexperia
- Vishay Intertechnology
- Microchip Technology (Microsemi)
- Semikron Danfoss
- Littelfuse
- Global Power Technology
- BASiC Semiconductor
- Kyma Technologies
- Soitec
- IQE
- Sanan Optoelectronics
Recent Development
- In August 2025, The Union Cabinet, chaired by PM Narendra Modi, approved four semiconductor projects under the India Semiconductor Mission, totaling Rs. 4,600 crore and creating 2,034 skilled jobs. SiCSem’s Odisha facility, in collaboration with Clas-SiC Wafer Fab Ltd., became India’s first commercial SiC compound semiconductor fab. These projects strengthened India’s presence in the global third-generation semiconductor discrete devices market, boosting supply and supporting EVs, defense, and renewable energy applications.
- In August 2025, Toshiba launched three 650V SiC MOSFETs—“TW027U65C,” “TW048U65C,” and “TW083U65C”—featuring third-generation SiC chips in TOLL packages for industrial and photovoltaic applications. Volume shipments began immediately. This strengthened Toshiba’s position in the global third-generation semiconductor discrete devices market, boosting adoption in renewable energy, industrial electronics, and high-performance power management.
Frequently Asked Questions (FAQ) :
Q1. What are the main growth driving factors for this market?
The primary growth drivers are the accelerating global shift towards electrification and the demand for energy-efficient power solutions. The expansion of the Electric Vehicle (EV) and Hybrid Electric Vehicle (HEV) market is a major catalyst, as SiC and GaN devices offer superior power conversion efficiency, smaller size, and lighter weight for inverters, onboard chargers, and DC-DC converters. Furthermore, the massive rollout of 5G communication infrastructure, industrial automation, and the demand for more efficient renewable energy inverters (solar, wind) are significantly fueling the adoption of these high-performance, wide-bandgap semiconductors.
Q2. What are the main restraining factors for this market?
The market faces restraints primarily due to high material and fabrication costs associated with third-generation semiconductors like SiC and GaN, compared to traditional silicon. The manufacturing processes are complex, requiring high-priced, state-of-the-art equipment and specialized expertise, which increases the total expenditure. Additionally, the supply chain for raw materials and the nascent stage of the ecosystem, including a lack of standardization and limited availability of large-diameter SiC wafers, can pose challenges, leading to higher initial product prices and potential supply constraints.
Q3. Which segment is expected to witness high growth?
The Automotive & EV/HEV segment is overwhelmingly projected to witness the highest growth. The rapid and compulsory global transition to electric mobility necessitates highly efficient, compact, and high-voltage power electronics to extend driving range and enable faster charging. Consequently, the adoption of SiC MOSFETs and GaN transistors in EV power modules, inverters, and charging infrastructure is experiencing exponential growth. Following closely is the EV Charging segment and applications like UPS, Data Centers, and Server Power Supplies due to their need for high-frequency and power-dense solutions.
Q4. Who are the top major players for this market?
The global market for third-generation semiconductor discrete devices is dominated by a few integrated device manufacturers (IDMs) and specialized companies. Infineon Technologies AG, STMicroelectronics NV, Wolfspeed, Inc., ROHM Co., Ltd., and onsemi (formerly ON Semiconductor) are consistently cited as the leading players. These companies are heavily investing in both SiC and GaN technologies, controlling significant market share, particularly in high-growth areas like power modules for electric vehicles. Other key players include Mitsubishi Electric, Fuji Electric, and Microchip Technology.
Q5. Which country is the largest player?
While it is difficult to isolate a single country for the entire market due to its global nature, the Asia-Pacific region collectively holds the largest market share in the broader semiconductor and discrete semiconductor market. Within this region, China, with its massive electronics manufacturing base and immense domestic demand (especially for EVs and 5G), is a leading force in production and consumption. However, in terms of advanced technology leadership and top-tier company headquarters, countries like the United States, Germany (Europe), and Japan house the key major players and foundational research.
List of Figures
Figure 1: Global Third Generation Semiconductor Discrete Devices Market Revenue Breakdown (USD Billion, %) by Region, 2022 & 2029
Figure 2: Global Third Generation Semiconductor Discrete Devices Market Value Share (%), By Segment 1, 2022 & 2029
Figure 3: Global Third Generation Semiconductor Discrete Devices Market Forecast (USD Billion), by Sub-Segment 1, 2018-2029
Figure 4: Global Third Generation Semiconductor Discrete Devices Market Forecast (USD Billion), by Sub-Segment 2, 2018-2029
Figure 5: Global Third Generation Semiconductor Discrete Devices Market Value Share (%), By Segment 2, 2022 & 2029
Figure 6: Global Third Generation Semiconductor Discrete Devices Market Forecast (USD Billion), by Sub-Segment 1, 2018-2029
Figure 7: Global Third Generation Semiconductor Discrete Devices Market Forecast (USD Billion), by Sub-Segment 2, 2018-2029
Figure 8: Global Third Generation Semiconductor Discrete Devices Market Forecast (USD Billion), by Sub-Segment 3, 2018-2029
Figure 9: Global Third Generation Semiconductor Discrete Devices Market Forecast (USD Billion), by Others, 2018-2029
Figure 10: Global Third Generation Semiconductor Discrete Devices Market Value Share (%), By Segment 3, 2022 & 2029
Figure 11: Global Third Generation Semiconductor Discrete Devices Market Forecast (USD Billion), by Sub-Segment 1, 2018-2029
Figure 12: Global Third Generation Semiconductor Discrete Devices Market Forecast (USD Billion), by Sub-Segment 2, 2018-2029
Figure 13: Global Third Generation Semiconductor Discrete Devices Market Forecast (USD Billion), by Sub-Segment 3, 2018-2029
Figure 14: Global Third Generation Semiconductor Discrete Devices Market Forecast (USD Billion), by Others, 2018-2029
Figure 15: Global Third Generation Semiconductor Discrete Devices Market Value (USD Billion), by Region, 2022 & 2029
Figure 16: North America Third Generation Semiconductor Discrete Devices Market Value Share (%), By Segment 1, 2022 & 2029
Figure 17: North America Third Generation Semiconductor Discrete Devices Market Forecast (USD Billion), by Sub-Segment 1, 2018-2029
Figure 18: North America Third Generation Semiconductor Discrete Devices Market Forecast (USD Billion), by Sub-Segment 2, 2018-2029
Figure 19: North America Third Generation Semiconductor Discrete Devices Market Value Share (%), By Segment 2, 2022 & 2029
Figure 20: North America Third Generation Semiconductor Discrete Devices Market Forecast (USD Billion), by Sub-Segment 1, 2018-2029
Figure 21: North America Third Generation Semiconductor Discrete Devices Market Forecast (USD Billion), by Sub-Segment 2, 2018-2029
Figure 22: North America Third Generation Semiconductor Discrete Devices Market Forecast (USD Billion), by Sub-Segment 3, 2018-2029
Figure 23: North America Third Generation Semiconductor Discrete Devices Market Forecast (USD Billion), by Others, 2018-2029
Figure 24: North America Third Generation Semiconductor Discrete Devices Market Value Share (%), By Segment 3, 2022 & 2029
Figure 25: North America Third Generation Semiconductor Discrete Devices Market Forecast (USD Billion), by Sub-Segment 1, 2018-2029
Figure 26: North America Third Generation Semiconductor Discrete Devices Market Forecast (USD Billion), by Sub-Segment 2, 2018-2029
Figure 27: North America Third Generation Semiconductor Discrete Devices Market Forecast (USD Billion), by Sub-Segment 3, 2018-2029
Figure 28: North America Third Generation Semiconductor Discrete Devices Market Forecast (USD Billion), by Others, 2018-2029
Figure 29: North America Third Generation Semiconductor Discrete Devices Market Forecast (USD Billion), by U.S., 2018-2029
Figure 30: North America Third Generation Semiconductor Discrete Devices Market Forecast (USD Billion), by Canada, 2018-2029
Figure 31: Latin America Third Generation Semiconductor Discrete Devices Market Value Share (%), By Segment 1, 2022 & 2029
Figure 32: Latin America Third Generation Semiconductor Discrete Devices Market Forecast (USD Billion), by Sub-Segment 1, 2018-2029
Figure 33: Latin America Third Generation Semiconductor Discrete Devices Market Forecast (USD Billion), by Sub-Segment 2, 2018-2029
Figure 34: Latin America Third Generation Semiconductor Discrete Devices Market Value Share (%), By Segment 2, 2022 & 2029
Figure 35: Latin America Third Generation Semiconductor Discrete Devices Market Forecast (USD Billion), by Sub-Segment 1, 2018-2029
Figure 36: Latin America Third Generation Semiconductor Discrete Devices Market Forecast (USD Billion), by Sub-Segment 2, 2018-2029
Figure 37: Latin America Third Generation Semiconductor Discrete Devices Market Forecast (USD Billion), by Sub-Segment 3, 2018-2029
Figure 38: Latin America Third Generation Semiconductor Discrete Devices Market Forecast (USD Billion), by Others, 2018-2029
Figure 39: Latin America Third Generation Semiconductor Discrete Devices Market Value Share (%), By Segment 3, 2022 & 2029
Figure 40: Latin America Third Generation Semiconductor Discrete Devices Market Forecast (USD Billion), by Sub-Segment 1, 2018-2029
Figure 41: Latin America Third Generation Semiconductor Discrete Devices Market Forecast (USD Billion), by Sub-Segment 2, 2018-2029
Figure 42: Latin America Third Generation Semiconductor Discrete Devices Market Forecast (USD Billion), by Sub-Segment 3, 2018-2029
Figure 43: Latin America Third Generation Semiconductor Discrete Devices Market Forecast (USD Billion), by Others, 2018-2029
Figure 44: Latin America Third Generation Semiconductor Discrete Devices Market Forecast (USD Billion), by Brazil, 2018-2029
Figure 45: Latin America Third Generation Semiconductor Discrete Devices Market Forecast (USD Billion), by Mexico, 2018-2029
Figure 46: Latin America Third Generation Semiconductor Discrete Devices Market Forecast (USD Billion), by Rest of Latin America, 2018-2029
Figure 47: Europe Third Generation Semiconductor Discrete Devices Market Value Share (%), By Segment 1, 2022 & 2029
Figure 48: Europe Third Generation Semiconductor Discrete Devices Market Forecast (USD Billion), by Sub-Segment 1, 2018-2029
Figure 49: Europe Third Generation Semiconductor Discrete Devices Market Forecast (USD Billion), by Sub-Segment 2, 2018-2029
Figure 50: Europe Third Generation Semiconductor Discrete Devices Market Value Share (%), By Segment 2, 2022 & 2029
Figure 51: Europe Third Generation Semiconductor Discrete Devices Market Forecast (USD Billion), by Sub-Segment 1, 2018-2029
Figure 52: Europe Third Generation Semiconductor Discrete Devices Market Forecast (USD Billion), by Sub-Segment 2, 2018-2029
Figure 53: Europe Third Generation Semiconductor Discrete Devices Market Forecast (USD Billion), by Sub-Segment 3, 2018-2029
Figure 54: Europe Third Generation Semiconductor Discrete Devices Market Forecast (USD Billion), by Others, 2018-2029
Figure 55: Europe Third Generation Semiconductor Discrete Devices Market Value Share (%), By Segment 3, 2022 & 2029
Figure 56: Europe Third Generation Semiconductor Discrete Devices Market Forecast (USD Billion), by Sub-Segment 1, 2018-2029
Figure 57: Europe Third Generation Semiconductor Discrete Devices Market Forecast (USD Billion), by Sub-Segment 2, 2018-2029
Figure 58: Europe Third Generation Semiconductor Discrete Devices Market Forecast (USD Billion), by Sub-Segment 3, 2018-2029
Figure 59: Europe Third Generation Semiconductor Discrete Devices Market Forecast (USD Billion), by Others, 2018-2029
Figure 60: Europe Third Generation Semiconductor Discrete Devices Market Forecast (USD Billion), by U.K., 2018-2029
Figure 61: Europe Third Generation Semiconductor Discrete Devices Market Forecast (USD Billion), by Germany, 2018-2029
Figure 62: Europe Third Generation Semiconductor Discrete Devices Market Forecast (USD Billion), by France, 2018-2029
Figure 63: Europe Third Generation Semiconductor Discrete Devices Market Forecast (USD Billion), by Italy, 2018-2029
Figure 64: Europe Third Generation Semiconductor Discrete Devices Market Forecast (USD Billion), by Spain, 2018-2029
Figure 65: Europe Third Generation Semiconductor Discrete Devices Market Forecast (USD Billion), by Russia, 2018-2029
Figure 66: Europe Third Generation Semiconductor Discrete Devices Market Forecast (USD Billion), by Rest of Europe, 2018-2029
Figure 67: Asia Pacific Third Generation Semiconductor Discrete Devices Market Value Share (%), By Segment 1, 2022 & 2029
Figure 68: Asia Pacific Third Generation Semiconductor Discrete Devices Market Forecast (USD Billion), by Sub-Segment 1, 2018-2029
Figure 69: Asia Pacific Third Generation Semiconductor Discrete Devices Market Forecast (USD Billion), by Sub-Segment 2, 2018-2029
Figure 70: Asia Pacific Third Generation Semiconductor Discrete Devices Market Value Share (%), By Segment 2, 2022 & 2029
Figure 71: Asia Pacific Third Generation Semiconductor Discrete Devices Market Forecast (USD Billion), by Sub-Segment 1, 2018-2029
Figure 72: Asia Pacific Third Generation Semiconductor Discrete Devices Market Forecast (USD Billion), by Sub-Segment 2, 2018-2029
Figure 73: Asia Pacific Third Generation Semiconductor Discrete Devices Market Forecast (USD Billion), by Sub-Segment 3, 2018-2029
Figure 74: Asia Pacific Third Generation Semiconductor Discrete Devices Market Forecast (USD Billion), by Others, 2018-2029
Figure 75: Asia Pacific Third Generation Semiconductor Discrete Devices Market Value Share (%), By Segment 3, 2022 & 2029
Figure 76: Asia Pacific Third Generation Semiconductor Discrete Devices Market Forecast (USD Billion), by Sub-Segment 1, 2018-2029
Figure 77: Asia Pacific Third Generation Semiconductor Discrete Devices Market Forecast (USD Billion), by Sub-Segment 2, 2018-2029
Figure 78: Asia Pacific Third Generation Semiconductor Discrete Devices Market Forecast (USD Billion), by Sub-Segment 3, 2018-2029
Figure 79: Asia Pacific Third Generation Semiconductor Discrete Devices Market Forecast (USD Billion), by Others, 2018-2029
Figure 80: Asia Pacific Third Generation Semiconductor Discrete Devices Market Forecast (USD Billion), by China, 2018-2029
Figure 81: Asia Pacific Third Generation Semiconductor Discrete Devices Market Forecast (USD Billion), by India, 2018-2029
Figure 82: Asia Pacific Third Generation Semiconductor Discrete Devices Market Forecast (USD Billion), by Japan, 2018-2029
Figure 83: Asia Pacific Third Generation Semiconductor Discrete Devices Market Forecast (USD Billion), by Australia, 2018-2029
Figure 84: Asia Pacific Third Generation Semiconductor Discrete Devices Market Forecast (USD Billion), by Southeast Asia, 2018-2029
Figure 85: Asia Pacific Third Generation Semiconductor Discrete Devices Market Forecast (USD Billion), by Rest of Asia Pacific, 2018-2029
Figure 86: Middle East & Africa Third Generation Semiconductor Discrete Devices Market Value Share (%), By Segment 1, 2022 & 2029
Figure 87: Middle East & Africa Third Generation Semiconductor Discrete Devices Market Forecast (USD Billion), by Sub-Segment 1, 2018-2029
Figure 88: Middle East & Africa Third Generation Semiconductor Discrete Devices Market Forecast (USD Billion), by Sub-Segment 2, 2018-2029
Figure 89: Middle East & Africa Third Generation Semiconductor Discrete Devices Market Value Share (%), By Segment 2, 2022 & 2029
Figure 90: Middle East & Africa Third Generation Semiconductor Discrete Devices Market Forecast (USD Billion), by Sub-Segment 1, 2018-2029
Figure 91: Middle East & Africa Third Generation Semiconductor Discrete Devices Market Forecast (USD Billion), by Sub-Segment 2, 2018-2029
Figure 92: Middle East & Africa Third Generation Semiconductor Discrete Devices Market Forecast (USD Billion), by Sub-Segment 3, 2018-2029
Figure 93: Middle East & Africa Third Generation Semiconductor Discrete Devices Market Forecast (USD Billion), by Others, 2018-2029
Figure 94: Middle East & Africa Third Generation Semiconductor Discrete Devices Market Value Share (%), By Segment 3, 2022 & 2029
Figure 95: Middle East & Africa Third Generation Semiconductor Discrete Devices Market Forecast (USD Billion), by Sub-Segment 1, 2018-2029
Figure 96: Middle East & Africa Third Generation Semiconductor Discrete Devices Market Forecast (USD Billion), by Sub-Segment 2, 2018-2029
Figure 97: Middle East & Africa Third Generation Semiconductor Discrete Devices Market Forecast (USD Billion), by Sub-Segment 3, 2018-2029
Figure 98: Middle East & Africa Third Generation Semiconductor Discrete Devices Market Forecast (USD Billion), by Others, 2018-2029
Figure 99: Middle East & Africa Third Generation Semiconductor Discrete Devices Market Forecast (USD Billion), by GCC, 2018-2029
Figure 100: Middle East & Africa Third Generation Semiconductor Discrete Devices Market Forecast (USD Billion), by South Africa, 2018-2029
Figure 101: Middle East & Africa Third Generation Semiconductor Discrete Devices Market Forecast (USD Billion), by Rest of Middle East & Africa, 2018-2029
List of Tables
Table 1: Global Third Generation Semiconductor Discrete Devices Market Revenue (USD Billion) Forecast, by Segment 1, 2018-2029
Table 2: Global Third Generation Semiconductor Discrete Devices Market Revenue (USD Billion) Forecast, by Segment 2, 2018-2029
Table 3: Global Third Generation Semiconductor Discrete Devices Market Revenue (USD Billion) Forecast, by Segment 3, 2018-2029
Table 4: Global Third Generation Semiconductor Discrete Devices Market Revenue (USD Billion) Forecast, by Region, 2018-2029
Table 5: North America Third Generation Semiconductor Discrete Devices Market Revenue (USD Billion) Forecast, by Segment 1, 2018-2029
Table 6: North America Third Generation Semiconductor Discrete Devices Market Revenue (USD Billion) Forecast, by Segment 2, 2018-2029
Table 7: North America Third Generation Semiconductor Discrete Devices Market Revenue (USD Billion) Forecast, by Segment 3, 2018-2029
Table 8: North America Third Generation Semiconductor Discrete Devices Market Revenue (USD Billion) Forecast, by Country, 2018-2029
Table 9: Europe Third Generation Semiconductor Discrete Devices Market Revenue (USD Billion) Forecast, by Segment 1, 2018-2029
Table 10: Europe Third Generation Semiconductor Discrete Devices Market Revenue (USD Billion) Forecast, by Segment 2, 2018-2029
Table 11: Europe Third Generation Semiconductor Discrete Devices Market Revenue (USD Billion) Forecast, by Segment 3, 2018-2029
Table 12: Europe Third Generation Semiconductor Discrete Devices Market Revenue (USD Billion) Forecast, by Country, 2018-2029
Table 13: Latin America Third Generation Semiconductor Discrete Devices Market Revenue (USD Billion) Forecast, by Segment 1, 2018-2029
Table 14: Latin America Third Generation Semiconductor Discrete Devices Market Revenue (USD Billion) Forecast, by Segment 2, 2018-2029
Table 15: Latin America Third Generation Semiconductor Discrete Devices Market Revenue (USD Billion) Forecast, by Segment 3, 2018-2029
Table 16: Latin America Third Generation Semiconductor Discrete Devices Market Revenue (USD Billion) Forecast, by Country, 2018-2029
Table 17: Asia Pacific Third Generation Semiconductor Discrete Devices Market Revenue (USD Billion) Forecast, by Segment 1, 2018-2029
Table 18: Asia Pacific Third Generation Semiconductor Discrete Devices Market Revenue (USD Billion) Forecast, by Segment 2, 2018-2029
Table 19: Asia Pacific Third Generation Semiconductor Discrete Devices Market Revenue (USD Billion) Forecast, by Segment 3, 2018-2029
Table 20: Asia Pacific Third Generation Semiconductor Discrete Devices Market Revenue (USD Billion) Forecast, by Country, 2018-2029
Table 21: Middle East & Africa Third Generation Semiconductor Discrete Devices Market Revenue (USD Billion) Forecast, by Segment 1, 2018-2029
Table 22: Middle East & Africa Third Generation Semiconductor Discrete Devices Market Revenue (USD Billion) Forecast, by Segment 2, 2018-2029
Table 23: Middle East & Africa Third Generation Semiconductor Discrete Devices Market Revenue (USD Billion) Forecast, by Segment 3, 2018-2029
Table 24: Middle East & Africa Third Generation Semiconductor Discrete Devices Market Revenue (USD Billion) Forecast, by Country, 2018-2029
Research Process
Data Library Research are conducted by industry experts who offer insight on
industry structure, market segmentations technology assessment and competitive landscape (CL), and penetration, as well as on emerging trends. Their analysis is based on primary interviews (~ 80%) and secondary research (~ 20%) as well as years of professional expertise in their respective industries. Adding to this, by analysing historical trends and current market positions, our analysts predict where the market will be headed for the next five years. Furthermore, the varying trends of segment & categories geographically presented are also studied and the estimated based on the primary & secondary research.
In this particular report from the supply side Data Library Research has conducted primary surveys (interviews) with the key level executives (VP, CEO’s, Marketing Director, Business Development Manager
and SOFT) of the companies that active & prominent as well as the midsized organization
FIGURE 1: DLR RESEARH PROCESS
![research-methodology1]()
Primary Research
Extensive primary research was conducted to gain a deeper insight of the market and industry performance. The analysis is based on both primary and secondary research as well as years of professional expertise in the respective industries.
In addition to analysing current and historical trends, our analysts predict where the market is headed over the next five years.
It varies by segment for these categories geographically presented in the list of market tables. Speaking about this particular report we have conducted primary surveys (interviews) with the key level executives (VP, CEO’s, Marketing Director, Business Development Manager and many more) of the major players active in the market.
Secondary Research
Secondary research was mainly used to collect and identify information useful for the extensive, technical, market-oriented, and Friend’s study of the Global Extra Neutral Alcohol. It was also used to obtain key information about major players, market classification and segmentation according to the industry trends, geographical markets, and developments related to the market and technology perspectives. For this study, analysts have gathered information from various credible sources, such as annual reports, sec filings, journals, white papers, SOFT presentations, and company web sites.
Market Size Estimation
Both, top-down and bottom-up approaches were used to estimate and validate the size of the Global market and to estimate the size of various other dependent submarkets in the overall Extra Neutral Alcohol. The key players in the market were identified through secondary research and their market contributions in the respective geographies were determined through primary and secondary research.
Forecast Model
![research-methodology2]()