Continuous Glucose Monitoring (CGM) Devices Market Overview and Analysis
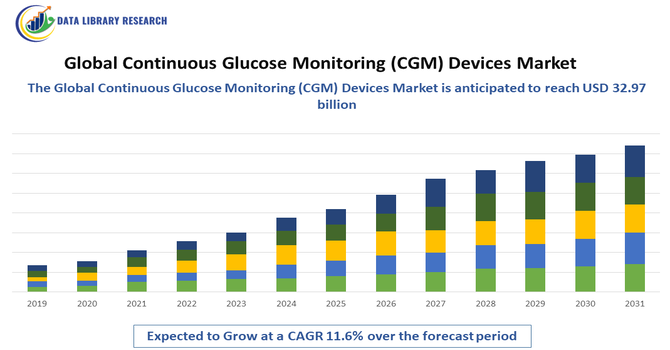
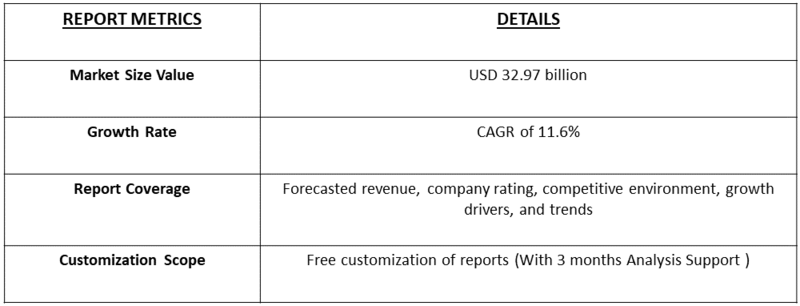
- The Global Continuous Glucose Monitoring (CGM) Devices Market, valued at USD 12.63 billion in 2025 and projected to reach USD 32.97 billion by 2033, is growing at a 11.6% CAGR from 2025-2032.
Get Complete Analysis Of The Report - Download Updated Free Sample PDF
The Global Continuous Glucose Monitoring (CGM) Devices Market refers to the development, production, and adoption of wearable devices that continuously monitor glucose levels in real time for patients with diabetes. CGM devices provide critical insights into blood sugar trends, enabling better glycemic control and reducing risks of hypoglycemia and hyperglycemia. Market growth is driven by the rising prevalence of diabetes, increasing awareness of diabetes management, and technological advancements in sensor accuracy, connectivity, and mobile integration.
Continuous Glucose Monitoring (CGM) Devices Market Latest Trends
The Global Continuous Glucose Monitoring (CGM) Devices Market is witnessing rapid expansion due to technological advancements and increasing adoption of diabetes management solutions. Real-time glucose monitoring, integration with insulin pumps, mobile applications, and cloud-based data platforms are driving market growth. Trends include hybrid and fully closed-loop systems, predictive analytics for hypo- and hyperglycemia, and non-invasive or minimally invasive sensors. Wearable design improvements and enhanced user-friendliness are boosting patient adherence.
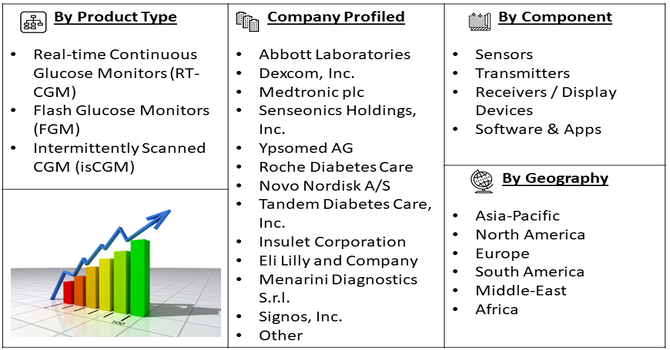
Segmentation: The Global Continuous Glucose Monitoring (CGM) Devices Market is segmented by Product Type (Real-time Continuous Glucose Monitors (RT-CGM) and Flash Glucose Monitors (FGM) / Intermittently Scanned CGM (isCGM)), Component (Sensors, Transmitters, Receivers / Display Devices and Software & Apps), Diabetes Type (Type 1 Diabetes (T1D), Type 2 Diabetes (T2D) and Gestational Diabetes) and Geography (North America, Europe, Asia-Pacific, Middle East and Africa, and South America). The report provides the value (in USD million) for the above segments.
For Detailed Market Segmentation - Get a Free Sample PDF
Market Drivers:
- Rising Diabetes Prevalence and Awareness
The global prevalence of diabetes continues to rise, with millions of individuals affected by Type 1 and Type 2 diabetes, driving demand for continuous glucose monitoring (CGM) devices. Growing awareness about the benefits of early detection, real-time glucose tracking, and proactive disease management has encouraged patients and healthcare providers to adopt CGM systems. Educational initiatives, public health campaigns, and the push for self-management solutions have further enhanced adoption. The need to prevent complications such as cardiovascular disease, neuropathy, and retinopathy has positioned CGM devices as essential tools for effective glycemic control and improved patient outcomes globally.
- Technological Advancements and Integration with Digital Health
Advancements in CGM technology, including improved sensor accuracy, extended wear time, and minimally invasive designs, have significantly increased user adoption. Integration with smartphones, wearable devices, and diabetes management apps enables real-time data analysis, predictive alerts, and personalized treatment plans. AI-driven predictive algorithms and cloud-based data platforms have enhanced usability for both patients and clinicians.
Continuous innovation, such as flash glucose monitoring, dual glucose-ketone sensors, and remote monitoring features, has improved convenience and treatment adherence. For instance, in 2025, Senseonics Holdings, Inc. (NYSE American: SENS), a medical technology company specializing in long-term implantable continuous glucose monitoring (CGM) systems, announced it had filed for CE Mark registration for its Eversense 365 CGM system. This filing marked a key regulatory step toward expanding availability in Europe, enabling broader patient access to long-term, implantable glucose monitoring solutions. These technological developments have expanded CGM accessibility, reinforced patient engagement, and strengthened the market’s growth trajectory.
Market Restraints:
- High Device Cost and Limited Reimbursement
Despite their clinical benefits, CGM devices remain relatively expensive, limiting adoption, particularly in low- and middle-income regions. High upfront costs for sensors, transmitters, and display devices, combined with ongoing replacement expenses, pose financial challenges for patients. Limited reimbursement policies and inconsistent insurance coverage further restrict accessibility, making CGM adoption less feasible for economically constrained populations. Additionally, the need for healthcare provider support, training, and device calibration can increase indirect costs. These financial barriers slow market penetration, especially in price-sensitive regions, and restrain the widespread adoption of CGM technology despite its proven advantages in diabetes management.
Socioeconomic Impact on Continuous Glucose Monitoring (CGM) Devices Market
Continuous glucose monitoring devices significantly improve patient quality of life by providing real-time insights into blood glucose fluctuations, reducing complications, and enabling proactive management. Effective CGM usage decreases hospitalizations and long-term costs associated with diabetes-related complications such as neuropathy, retinopathy, and cardiovascular disease. Enhanced glucose control increases productivity and reduces absenteeism, benefiting both individuals and society. However, high device costs and limited insurance coverage in certain regions restrict accessibility. Government initiatives promoting reimbursement, awareness, and early diagnosis enhance adoption, particularly in pediatric and high-risk populations, highlighting the socioeconomic importance of CGM devices in reducing the global diabetes burden and healthcare expenditure.
Segmental Analysis:
- Flash Glucose Monitors (FGM) / Intermittently Scanned CGM (isCGM) segment is expected to witness the highest growth over the forecast period
The Flash Glucose Monitors (FGM) or Intermittently Scanned CGM segment is expected to witness the highest growth over the forecast period due to its affordability, convenience, and non-invasive design. These devices allow users to monitor glucose levels by scanning a sensor without continuous finger pricks, improving patient adherence. Rising awareness about diabetes self-management and increasing demand for real-time, user-friendly glucose monitoring solutions are driving adoption globally. The ability to provide quick insights, integrate with mobile apps, and reduce long-term complications makes FGM/isCGM increasingly popular among both Type 1 and Type 2 diabetes patients.
- Receivers / Display Devices segment is expected to witness the highest growth over the forecast period
The Receivers and Display Devices segment is projected to experience significant growth as these components are critical for interpreting CGM data in real-time. Advancements in device design, portability, and integration with mobile applications and cloud platforms have enhanced user experience and data accessibility. Increasing adoption of CGM systems in both home and clinical settings has intensified demand for intuitive display devices. Furthermore, continuous improvements in battery life, screen clarity, and connectivity features support higher adoption. The segment growth is driven by patients’ and healthcare providers’ preference for reliable, accessible, and actionable glucose data to optimize diabetes management.
- Type 2 Diabetes (T2D) segment is expected to witness the highest growth over the forecast period
The Type 2 Diabetes (T2D) segment is expected to witness the highest growth due to the rising global prevalence of T2D, driven by lifestyle changes, obesity, and aging populations. Increased awareness regarding early monitoring and disease management has encouraged CGM adoption among insulin-dependent and high-risk patients. Real-time glucose monitoring enables better glycemic control, reduces complications, and improves medication adherence. Healthcare providers increasingly recommend CGM solutions for T2D patients to optimize treatment plans. Additionally, technological advancements in minimally invasive and user-friendly CGM systems have made monitoring more accessible, supporting the expanding demand in this rapidly growing patient segment.
- North America Region is expected to witness the highest growth over the forecast period
North America is projected to witness the highest growth in the CGM devices market due to high diabetes prevalence, favorable reimbursement policies, and advanced healthcare infrastructure. The region has widespread adoption of innovative CGM technologies supported by strong awareness programs, insurance coverage, and government initiatives.
Presence of major market players, continuous R&D, and patient preference for real-time glucose monitoring contribute to growth. For instance, in 2025, Abbott announced results from its REFLECT real-world studies demonstrating that FreeStyle Libre continuous glucose monitoring (CGM) technology significantly reduced the risk of heart-related hospitalizations in people with diabetes. For the first time, data showed that CGM helped lessen the severity of cardiovascular complications in Type 1 diabetes patients, regardless of prior hypoglycemia or heart disease history. Similar reductions were observed in insulin-treated Type 2 diabetes patients using Libre technology.
Additionally, rising adoption of remote monitoring, telemedicine, and integration with mobile health applications has accelerated market penetration. For instance, in July 2025, OMRON Healthcare collaborated with Tricog Health to launch KeeboHealth, an AI-driven platform designed to transform remote cardiac care in India, advancing efforts toward the company’s “Going for Zero” vision and enhancing accessibility, efficiency, and early intervention in cardiovascular healthcare. The AI-powered KeeboHealth platform is enhancing remote patient monitoring and data-driven diabetes management. This integration of digital health solutions is boosting the adoption and effectiveness of Continuous Glucose Monitoring (CGM) devices in North America, thereby making this region a hub for technological innovation, clinical trials, and regulatory approvals, driving continued expansion of CGM device adoption.
To Learn More About This Report - Request a Free Sample Copy
Continuous Glucose Monitoring (CGM) Devices Market Competitive Landscape
The Global CGM Devices Market is highly competitive, dominated by established medical device and diabetes technology companies. Leading players like Dexcom, Abbott, Medtronic, and Senseonics focus on improving sensor accuracy, wearable designs, and interoperability with insulin pumps and artificial pancreas systems. Companies differentiate through technological innovation, patient support programs, and cloud-based data analytics platforms. Mergers, acquisitions, and strategic collaborations are common to expand market reach and R&D capabilities. Emerging startups are developing non-invasive or implantable sensors, intensifying competition.
The major players for above market are:
- Abbott Laboratories
- Dexcom, Inc.
- Medtronic plc
- Senseonics Holdings, Inc.
- Ypsomed AG
- Roche Diabetes Care
- Novo Nordisk A/S
- Tandem Diabetes Care, Inc.
- Insulet Corporation
- Eli Lilly and Company
- Menarini Diagnostics S.r.l.
- Signos, Inc.
- GlySens Incorporated
- Bio-RFID (Know Labs)
- Indigo Diabetes
- Ultrahuman (M1 CGM)
- Profusa, Inc.
- Liom (Spiden)
- Occuity
- Echo Therapeutics, Inc.
Recent Development
- In November 2025, Researchers at the Indian Institute of Technology Madras (IIT Madras) developed and patented a cost-effective, user-friendly, and minimally invasive glucose monitoring device for diabetes patients. Designed for comfort, accessibility, and long-term affordability, the device maintained high accuracy and reliability. The innovation addressed India’s growing diabetes burden, affecting over 10.1 crore people, according to the 2023 ICMR INDIAB study.
- In September 2025, Roche presented real-world data from the rollout of its Accu-Chek SmartGuide continuous glucose monitoring (CGM) solution at the European Association for the Study of Diabetes (EASD) annual meeting. The company also announced integration with the mySugr diabetes management app, enabling broader access to an AI-powered predictive solution and enhancing diabetes management for a larger patient population.
Frequently Asked Questions (FAQ) :
Q1. What are the main growth-driving factors for this market?
The market is growing because of the rising global population of people with diabetes who need constant sugar tracking. Unlike painful finger-prick tests, CGM devices provide real-time data and alerts. The integration of these sensors with smartphones and smartwatches makes managing health more convenient, driving higher adoption among tech-savvy patients.
Q2. What are the main restraining factors for this market?
Growth is limited by the high cost of the sensors, which must be replaced every few days or weeks. In many countries, limited insurance coverage makes these devices too expensive for the average person. Additionally, some users experience skin irritation from the adhesive patches or find the constant alerts overwhelming.
Q3. Which segment is expected to witness high growth?
The Transmitter and Receiver segment is expected to see the highest growth. As the "brain" of the system, these components are becoming more advanced, offering better Bluetooth connectivity and longer battery life. Their ability to send data directly to insulin pumps for automated delivery makes them essential for modern care.
Q4. Who are the top major players for this market?
The market is led by global medical technology giants that specialize in diabetes care. Key players include Dexcom, Abbott Laboratories, Medtronic, Senseonics, and Roche. These companies dominate by creating smaller, more accurate sensors and forming partnerships with digital health platforms to provide users with detailed, easy-to-read reports on their health.
Q5. Which country is the largest player?
The United States is the largest player in the CGM devices market. It leads because of its advanced healthcare system and high spending on diabetes management. Favorable reimbursement through private insurance and Medicare, combined with a strong culture of using the latest medical gadgets, keeps the U.S. in the top position.
List of Figures
Figure 1: Global Continuous Glucose Monitoring (CGM) Devices Market Revenue Breakdown (USD Billion, %) by Region, 2019 & 2027
Figure 2: Global Continuous Glucose Monitoring (CGM) Devices Market Value Share (%), By Segment 1, 2019 & 2027
Figure 3: Global Continuous Glucose Monitoring (CGM) Devices Market Forecast (USD Billion), by Sub-Segment 1, 2016-2027
Figure 4: Global Continuous Glucose Monitoring (CGM) Devices Market Forecast (USD Billion), by Sub-Segment 2, 2016-2027
Figure 5: Global Continuous Glucose Monitoring (CGM) Devices Market Value Share (%), By Segment 2, 2019 & 2027
Figure 6: Global Continuous Glucose Monitoring (CGM) Devices Market Forecast (USD Billion), by Sub-Segment 1, 2016-2027
Figure 7: Global Continuous Glucose Monitoring (CGM) Devices Market Forecast (USD Billion), by Sub-Segment 2, 2016-2027
Figure 8: Global Continuous Glucose Monitoring (CGM) Devices Market Forecast (USD Billion), by Sub-Segment 3, 2016-2027
Figure 9: Global Continuous Glucose Monitoring (CGM) Devices Market Forecast (USD Billion), by Others, 2016-2027
Figure 10: Global Continuous Glucose Monitoring (CGM) Devices Market Value Share (%), By Segment 3, 2019 & 2027
Figure 11: Global Continuous Glucose Monitoring (CGM) Devices Market Forecast (USD Billion), by Sub-Segment 1, 2016-2027
Figure 12: Global Continuous Glucose Monitoring (CGM) Devices Market Forecast (USD Billion), by Sub-Segment 2, 2016-2027
Figure 13: Global Continuous Glucose Monitoring (CGM) Devices Market Forecast (USD Billion), by Sub-Segment 3, 2016-2027
Figure 14: Global Continuous Glucose Monitoring (CGM) Devices Market Forecast (USD Billion), by Others, 2016-2027
Figure 15: Global Continuous Glucose Monitoring (CGM) Devices Market Value (USD Billion), by Region, 2019 & 2027
Figure 16: North America Continuous Glucose Monitoring (CGM) Devices Market Value Share (%), By Segment 1, 2019 & 2027
Figure 17: North America Continuous Glucose Monitoring (CGM) Devices Market Forecast (USD Billion), by Sub-Segment 1, 2016-2027
Figure 18: North America Continuous Glucose Monitoring (CGM) Devices Market Forecast (USD Billion), by Sub-Segment 2, 2016-2027
Figure 19: North America Continuous Glucose Monitoring (CGM) Devices Market Value Share (%), By Segment 2, 2019 & 2027
Figure 20: North America Continuous Glucose Monitoring (CGM) Devices Market Forecast (USD Billion), by Sub-Segment 1, 2016-2027
Figure 21: North America Continuous Glucose Monitoring (CGM) Devices Market Forecast (USD Billion), by Sub-Segment 2, 2016-2027
Figure 22: North America Continuous Glucose Monitoring (CGM) Devices Market Forecast (USD Billion), by Sub-Segment 3, 2016-2027
Figure 23: North America Continuous Glucose Monitoring (CGM) Devices Market Forecast (USD Billion), by Others, 2016-2027
Figure 24: North America Continuous Glucose Monitoring (CGM) Devices Market Value Share (%), By Segment 3, 2019 & 2027
Figure 25: North America Continuous Glucose Monitoring (CGM) Devices Market Forecast (USD Billion), by Sub-Segment 1, 2016-2027
Figure 26: North America Continuous Glucose Monitoring (CGM) Devices Market Forecast (USD Billion), by Sub-Segment 2, 2016-2027
Figure 27: North America Continuous Glucose Monitoring (CGM) Devices Market Forecast (USD Billion), by Sub-Segment 3, 2016-2027
Figure 28: North America Continuous Glucose Monitoring (CGM) Devices Market Forecast (USD Billion), by Others, 2016-2027
Figure 29: North America Continuous Glucose Monitoring (CGM) Devices Market Forecast (USD Billion), by U.S., 2016-2027
Figure 30: North America Continuous Glucose Monitoring (CGM) Devices Market Forecast (USD Billion), by Canada, 2016-2027
Figure 31: Latin America Continuous Glucose Monitoring (CGM) Devices Market Value Share (%), By Segment 1, 2019 & 2027
Figure 32: Latin America Continuous Glucose Monitoring (CGM) Devices Market Forecast (USD Billion), by Sub-Segment 1, 2016-2027
Figure 33: Latin America Continuous Glucose Monitoring (CGM) Devices Market Forecast (USD Billion), by Sub-Segment 2, 2016-2027
Figure 34: Latin America Continuous Glucose Monitoring (CGM) Devices Market Value Share (%), By Segment 2, 2019 & 2027
Figure 35: Latin America Continuous Glucose Monitoring (CGM) Devices Market Forecast (USD Billion), by Sub-Segment 1, 2016-2027
Figure 36: Latin America Continuous Glucose Monitoring (CGM) Devices Market Forecast (USD Billion), by Sub-Segment 2, 2016-2027
Figure 37: Latin America Continuous Glucose Monitoring (CGM) Devices Market Forecast (USD Billion), by Sub-Segment 3, 2016-2027
Figure 38: Latin America Continuous Glucose Monitoring (CGM) Devices Market Forecast (USD Billion), by Others, 2016-2027
Figure 39: Latin America Continuous Glucose Monitoring (CGM) Devices Market Value Share (%), By Segment 3, 2019 & 2027
Figure 40: Latin America Continuous Glucose Monitoring (CGM) Devices Market Forecast (USD Billion), by Sub-Segment 1, 2016-2027
Figure 41: Latin America Continuous Glucose Monitoring (CGM) Devices Market Forecast (USD Billion), by Sub-Segment 2, 2016-2027
Figure 42: Latin America Continuous Glucose Monitoring (CGM) Devices Market Forecast (USD Billion), by Sub-Segment 3, 2016-2027
Figure 43: Latin America Continuous Glucose Monitoring (CGM) Devices Market Forecast (USD Billion), by Others, 2016-2027
Figure 44: Latin America Continuous Glucose Monitoring (CGM) Devices Market Forecast (USD Billion), by Brazil, 2016-2027
Figure 45: Latin America Continuous Glucose Monitoring (CGM) Devices Market Forecast (USD Billion), by Mexico, 2016-2027
Figure 46: Latin America Continuous Glucose Monitoring (CGM) Devices Market Forecast (USD Billion), by Rest of Latin America, 2016-2027
Figure 47: Europe Continuous Glucose Monitoring (CGM) Devices Market Value Share (%), By Segment 1, 2019 & 2027
Figure 48: Europe Continuous Glucose Monitoring (CGM) Devices Market Forecast (USD Billion), by Sub-Segment 1, 2016-2027
Figure 49: Europe Continuous Glucose Monitoring (CGM) Devices Market Forecast (USD Billion), by Sub-Segment 2, 2016-2027
Figure 50: Europe Continuous Glucose Monitoring (CGM) Devices Market Value Share (%), By Segment 2, 2019 & 2027
Figure 51: Europe Continuous Glucose Monitoring (CGM) Devices Market Forecast (USD Billion), by Sub-Segment 1, 2016-2027
Figure 52: Europe Continuous Glucose Monitoring (CGM) Devices Market Forecast (USD Billion), by Sub-Segment 2, 2016-2027
Figure 53: Europe Continuous Glucose Monitoring (CGM) Devices Market Forecast (USD Billion), by Sub-Segment 3, 2016-2027
Figure 54: Europe Continuous Glucose Monitoring (CGM) Devices Market Forecast (USD Billion), by Others, 2016-2027
Figure 55: Europe Continuous Glucose Monitoring (CGM) Devices Market Value Share (%), By Segment 3, 2019 & 2027
Figure 56: Europe Continuous Glucose Monitoring (CGM) Devices Market Forecast (USD Billion), by Sub-Segment 1, 2016-2027
Figure 57: Europe Continuous Glucose Monitoring (CGM) Devices Market Forecast (USD Billion), by Sub-Segment 2, 2016-2027
Figure 58: Europe Continuous Glucose Monitoring (CGM) Devices Market Forecast (USD Billion), by Sub-Segment 3, 2016-2027
Figure 59: Europe Continuous Glucose Monitoring (CGM) Devices Market Forecast (USD Billion), by Others, 2016-2027
Figure 60: Europe Continuous Glucose Monitoring (CGM) Devices Market Forecast (USD Billion), by U.K., 2016-2027
Figure 61: Europe Continuous Glucose Monitoring (CGM) Devices Market Forecast (USD Billion), by Germany, 2016-2027
Figure 62: Europe Continuous Glucose Monitoring (CGM) Devices Market Forecast (USD Billion), by France, 2016-2027
Figure 63: Europe Continuous Glucose Monitoring (CGM) Devices Market Forecast (USD Billion), by Italy, 2016-2027
Figure 64: Europe Continuous Glucose Monitoring (CGM) Devices Market Forecast (USD Billion), by Spain, 2016-2027
Figure 65: Europe Continuous Glucose Monitoring (CGM) Devices Market Forecast (USD Billion), by Russia, 2016-2027
Figure 66: Europe Continuous Glucose Monitoring (CGM) Devices Market Forecast (USD Billion), by Rest of Europe, 2016-2027
Figure 67: Asia Pacific Continuous Glucose Monitoring (CGM) Devices Market Value Share (%), By Segment 1, 2019 & 2027
Figure 68: Asia Pacific Continuous Glucose Monitoring (CGM) Devices Market Forecast (USD Billion), by Sub-Segment 1, 2016-2027
Figure 69: Asia Pacific Continuous Glucose Monitoring (CGM) Devices Market Forecast (USD Billion), by Sub-Segment 2, 2016-2027
Figure 70: Asia Pacific Continuous Glucose Monitoring (CGM) Devices Market Value Share (%), By Segment 2, 2019 & 2027
Figure 71: Asia Pacific Continuous Glucose Monitoring (CGM) Devices Market Forecast (USD Billion), by Sub-Segment 1, 2016-2027
Figure 72: Asia Pacific Continuous Glucose Monitoring (CGM) Devices Market Forecast (USD Billion), by Sub-Segment 2, 2016-2027
Figure 73: Asia Pacific Continuous Glucose Monitoring (CGM) Devices Market Forecast (USD Billion), by Sub-Segment 3, 2016-2027
Figure 74: Asia Pacific Continuous Glucose Monitoring (CGM) Devices Market Forecast (USD Billion), by Others, 2016-2027
Figure 75: Asia Pacific Continuous Glucose Monitoring (CGM) Devices Market Value Share (%), By Segment 3, 2019 & 2027
Figure 76: Asia Pacific Continuous Glucose Monitoring (CGM) Devices Market Forecast (USD Billion), by Sub-Segment 1, 2016-2027
Figure 77: Asia Pacific Continuous Glucose Monitoring (CGM) Devices Market Forecast (USD Billion), by Sub-Segment 2, 2016-2027
Figure 78: Asia Pacific Continuous Glucose Monitoring (CGM) Devices Market Forecast (USD Billion), by Sub-Segment 3, 2016-2027
Figure 79: Asia Pacific Continuous Glucose Monitoring (CGM) Devices Market Forecast (USD Billion), by Others, 2016-2027
Figure 80: Asia Pacific Continuous Glucose Monitoring (CGM) Devices Market Forecast (USD Billion), by China, 2016-2027
Figure 81: Asia Pacific Continuous Glucose Monitoring (CGM) Devices Market Forecast (USD Billion), by India, 2016-2027
Figure 82: Asia Pacific Continuous Glucose Monitoring (CGM) Devices Market Forecast (USD Billion), by Japan, 2016-2027
Figure 83: Asia Pacific Continuous Glucose Monitoring (CGM) Devices Market Forecast (USD Billion), by Australia, 2016-2027
Figure 84: Asia Pacific Continuous Glucose Monitoring (CGM) Devices Market Forecast (USD Billion), by Southeast Asia, 2016-2027
Figure 85: Asia Pacific Continuous Glucose Monitoring (CGM) Devices Market Forecast (USD Billion), by Rest of Asia Pacific, 2016-2027
Figure 86: Middle East & Africa Continuous Glucose Monitoring (CGM) Devices Market Value Share (%), By Segment 1, 2019 & 2027
Figure 87: Middle East & Africa Continuous Glucose Monitoring (CGM) Devices Market Forecast (USD Billion), by Sub-Segment 1, 2016-2027
Figure 88: Middle East & Africa Continuous Glucose Monitoring (CGM) Devices Market Forecast (USD Billion), by Sub-Segment 2, 2016-2027
Figure 89: Middle East & Africa Continuous Glucose Monitoring (CGM) Devices Market Value Share (%), By Segment 2, 2019 & 2027
Figure 90: Middle East & Africa Continuous Glucose Monitoring (CGM) Devices Market Forecast (USD Billion), by Sub-Segment 1, 2016-2027
Figure 91: Middle East & Africa Continuous Glucose Monitoring (CGM) Devices Market Forecast (USD Billion), by Sub-Segment 2, 2016-2027
Figure 92: Middle East & Africa Continuous Glucose Monitoring (CGM) Devices Market Forecast (USD Billion), by Sub-Segment 3, 2016-2027
Figure 93: Middle East & Africa Continuous Glucose Monitoring (CGM) Devices Market Forecast (USD Billion), by Others, 2016-2027
Figure 94: Middle East & Africa Continuous Glucose Monitoring (CGM) Devices Market Value Share (%), By Segment 3, 2019 & 2027
Figure 95: Middle East & Africa Continuous Glucose Monitoring (CGM) Devices Market Forecast (USD Billion), by Sub-Segment 1, 2016-2027
Figure 96: Middle East & Africa Continuous Glucose Monitoring (CGM) Devices Market Forecast (USD Billion), by Sub-Segment 2, 2016-2027
Figure 97: Middle East & Africa Continuous Glucose Monitoring (CGM) Devices Market Forecast (USD Billion), by Sub-Segment 3, 2016-2027
Figure 98: Middle East & Africa Continuous Glucose Monitoring (CGM) Devices Market Forecast (USD Billion), by Others, 2016-2027
Figure 99: Middle East & Africa Continuous Glucose Monitoring (CGM) Devices Market Forecast (USD Billion), by GCC, 2016-2027
Figure 100: Middle East & Africa Continuous Glucose Monitoring (CGM) Devices Market Forecast (USD Billion), by South Africa, 2016-2027
Figure 101: Middle East & Africa Continuous Glucose Monitoring (CGM) Devices Market Forecast (USD Billion), by Rest of Middle East & Africa, 2016-2027
List of Tables
Table 1: Global Continuous Glucose Monitoring (CGM) Devices Market Revenue (USD Billion) Forecast, by Segment 1, 2016-2027
Table 2: Global Continuous Glucose Monitoring (CGM) Devices Market Revenue (USD Billion) Forecast, by Segment 2, 2016-2027
Table 3: Global Continuous Glucose Monitoring (CGM) Devices Market Revenue (USD Billion) Forecast, by Segment 3, 2016-2027
Table 4: Global Continuous Glucose Monitoring (CGM) Devices Market Revenue (USD Billion) Forecast, by Region, 2016-2027
Table 5: North America Continuous Glucose Monitoring (CGM) Devices Market Revenue (USD Billion) Forecast, by Segment 1, 2016-2027
Table 6: North America Continuous Glucose Monitoring (CGM) Devices Market Revenue (USD Billion) Forecast, by Segment 2, 2016-2027
Table 7: North America Continuous Glucose Monitoring (CGM) Devices Market Revenue (USD Billion) Forecast, by Segment 3, 2016-2027
Table 8: North America Continuous Glucose Monitoring (CGM) Devices Market Revenue (USD Billion) Forecast, by Country, 2016-2027
Table 9: Europe Continuous Glucose Monitoring (CGM) Devices Market Revenue (USD Billion) Forecast, by Segment 1, 2016-2027
Table 10: Europe Continuous Glucose Monitoring (CGM) Devices Market Revenue (USD Billion) Forecast, by Segment 2, 2016-2027
Table 11: Europe Continuous Glucose Monitoring (CGM) Devices Market Revenue (USD Billion) Forecast, by Segment 3, 2016-2027
Table 12: Europe Continuous Glucose Monitoring (CGM) Devices Market Revenue (USD Billion) Forecast, by Country, 2016-2027
Table 13: Latin America Continuous Glucose Monitoring (CGM) Devices Market Revenue (USD Billion) Forecast, by Segment 1, 2016-2027
Table 14: Latin America Continuous Glucose Monitoring (CGM) Devices Market Revenue (USD Billion) Forecast, by Segment 2, 2016-2027
Table 15: Latin America Continuous Glucose Monitoring (CGM) Devices Market Revenue (USD Billion) Forecast, by Segment 3, 2016-2027
Table 16: Latin America Continuous Glucose Monitoring (CGM) Devices Market Revenue (USD Billion) Forecast, by Country, 2016-2027
Table 17: Asia Pacific Continuous Glucose Monitoring (CGM) Devices Market Revenue (USD Billion) Forecast, by Segment 1, 2016-2027
Table 18: Asia Pacific Continuous Glucose Monitoring (CGM) Devices Market Revenue (USD Billion) Forecast, by Segment 2, 2016-2027
Table 19: Asia Pacific Continuous Glucose Monitoring (CGM) Devices Market Revenue (USD Billion) Forecast, by Segment 3, 2016-2027
Table 20: Asia Pacific Continuous Glucose Monitoring (CGM) Devices Market Revenue (USD Billion) Forecast, by Country, 2016-2027
Table 21: Middle East & Africa Continuous Glucose Monitoring (CGM) Devices Market Revenue (USD Billion) Forecast, by Segment 1, 2016-2027
Table 22: Middle East & Africa Continuous Glucose Monitoring (CGM) Devices Market Revenue (USD Billion) Forecast, by Segment 2, 2016-2027
Table 23: Middle East & Africa Continuous Glucose Monitoring (CGM) Devices Market Revenue (USD Billion) Forecast, by Segment 3, 2016-2027
Table 24: Middle East & Africa Continuous Glucose Monitoring (CGM) Devices Market Revenue (USD Billion) Forecast, by Country, 2016-2027
Research Process
Data Library Research are conducted by industry experts who offer insight on
industry structure, market segmentations technology assessment and competitive landscape (CL), and penetration, as well as on emerging trends. Their analysis is based on primary interviews (~ 80%) and secondary research (~ 20%) as well as years of professional expertise in their respective industries. Adding to this, by analysing historical trends and current market positions, our analysts predict where the market will be headed for the next five years. Furthermore, the varying trends of segment & categories geographically presented are also studied and the estimated based on the primary & secondary research.
In this particular report from the supply side Data Library Research has conducted primary surveys (interviews) with the key level executives (VP, CEO’s, Marketing Director, Business Development Manager
and SOFT) of the companies that active & prominent as well as the midsized organization
FIGURE 1: DLR RESEARH PROCESS
![research-methodology1]()
Primary Research
Extensive primary research was conducted to gain a deeper insight of the market and industry performance. The analysis is based on both primary and secondary research as well as years of professional expertise in the respective industries.
In addition to analysing current and historical trends, our analysts predict where the market is headed over the next five years.
It varies by segment for these categories geographically presented in the list of market tables. Speaking about this particular report we have conducted primary surveys (interviews) with the key level executives (VP, CEO’s, Marketing Director, Business Development Manager and many more) of the major players active in the market.
Secondary Research
Secondary research was mainly used to collect and identify information useful for the extensive, technical, market-oriented, and Friend’s study of the Global Extra Neutral Alcohol. It was also used to obtain key information about major players, market classification and segmentation according to the industry trends, geographical markets, and developments related to the market and technology perspectives. For this study, analysts have gathered information from various credible sources, such as annual reports, sec filings, journals, white papers, SOFT presentations, and company web sites.
Market Size Estimation
Both, top-down and bottom-up approaches were used to estimate and validate the size of the Global market and to estimate the size of various other dependent submarkets in the overall Extra Neutral Alcohol. The key players in the market were identified through secondary research and their market contributions in the respective geographies were determined through primary and secondary research.
Forecast Model
![research-methodology2]()