Biological Imaging Technology Market Overview and Analysis
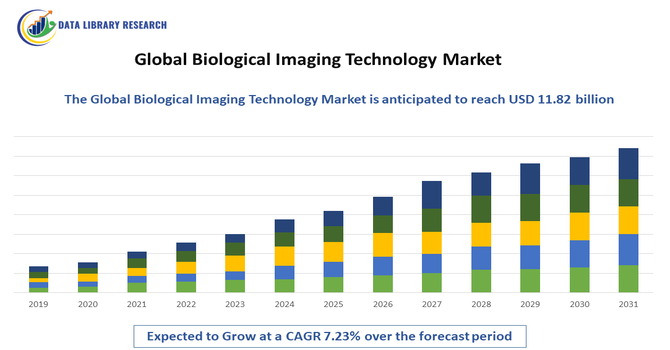
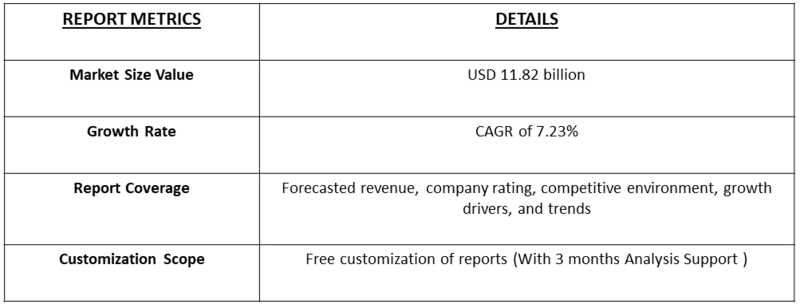
- The Global Biological Imaging Technology Market size is accounted at USD 4.56 billion in 2025 and is forecasted to hit around USD 11.82 billion by 2032, representing a CAGR of 7.23% from 2025 to 2032.
Get Complete Analysis Of The Report - Download Updated Free Sample PDF
The Global Biological Imaging Technology Market refers to the worldwide industry focused on developing, manufacturing, and selling imaging systems used to study biological processes, cells, and tissues. It includes technologies like microscopy, MRI, PET, CT, and optical imaging for research, diagnostics, and drug development. The growth of this market is driven by rising demand for advanced medical diagnostics, personalized medicine, and biotechnology research, the market involves key players, innovation in imaging techniques, and applications across healthcare, pharmaceuticals, and life sciences, reflecting rapid technological advancement and increasing healthcare investments.
Biological Imaging Technology Market Latest Trends
The Global Biological Imaging Technology Market is experiencing robust expansion driven by the integration of advanced technologies like AI, machine learning, and cloud-based imaging, enhancing diagnostic precision and workflow efficiency. Innovations in 3D imaging, sensor technology, and non invasive diagnostics are shaping industry trends. Increasing demand for personalized medicine and early disease detection, especially in oncology and chronic illness monitoring, further propels growth. Adoption of digital imaging systems and wearable imaging sensors is rising.
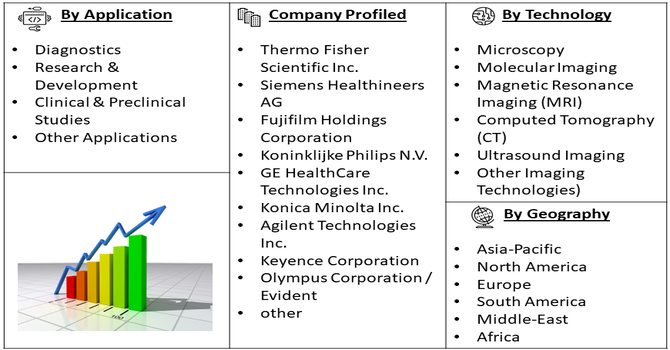
Segmentation: The Global Biological Imaging Technology Market is segmented by Technology (Microscopy, Molecular Imaging, Magnetic Resonance Imaging (MRI), Computed Tomography (CT), Ultrasound Imaging, and Other Imaging Technologies), Application (Diagnostics, Research & Development, Clinical & Preclinical Studies and Other Applications), and Geography (North America, Europe, Asia-Pacific, Middle East and Africa, and South America). The report provides the value (in USD million) for the above segments.
For Detailed Market Segmentation - Get a Free Sample PDF
Market Drivers:
- Growing Demand for Advanced Diagnostics
The increasing prevalence of chronic diseases such as cancer, cardiovascular disorders, and neurological conditions is driving demand for advanced biological imaging technologies. Early and accurate diagnosis is critical for effective treatment, and imaging systems like MRI, PET, CT, and high-resolution microscopy enable precise visualization of tissues, cells, and molecular processes. Additionally, rising awareness of preventive healthcare and personalized medicine further fuels adoption. Hospitals, research centers, and diagnostic labs are investing in cutting-edge imaging equipment to improve clinical outcomes. This trend is particularly pronounced in developed regions, contributing to steady market growth globally.
- Technological Advancements and Integration with AI
Continuous innovations in imaging technologies, such as 3D imaging, super-resolution microscopy, and molecular imaging, are driving market expansion. Integration with artificial intelligence, machine learning, and cloud-based platforms enhances image analysis, workflow efficiency, and diagnostic accuracy. Digital imaging and automated systems reduce human error and enable faster decision-making in both research and clinical applications. The convergence of AI with imaging technology also opens opportunities for predictive diagnostics, remote monitoring, and precision medicine. These advancements attract significant investment from healthcare institutions and biotech companies, fostering rapid adoption and strengthening the market’s growth trajectory globally.
Market Restraints:
- High Cost of Equipment and Maintenance
The high acquisition cost of advanced biological imaging systems, along with expensive maintenance and operational requirements, remains a significant market restraint. Small laboratories, emerging research institutions, and clinics in developing regions often struggle to afford high-end imaging devices such as MRI, PET, and high-resolution microscopes. Additionally, specialized training is required for operators and technicians, increasing indirect costs. The financial burden limits widespread adoption, especially in price-sensitive markets. Frequent upgrades and consumables further add to expenses, restraining market penetration. As a result, cost considerations slow growth despite rising demand and technological advancements in the global biological imaging technology market.
Socioeconomic Impact on Biological Imaging Technology Market
Biological imaging technologies significantly impact global socioeconomic landscapes by improving healthcare outcomes and enabling earlier, more accurate diagnoses. These systems support effective management of rising chronic diseases and aging populations, reducing long term healthcare costs and improving quality of life. Enhanced imaging also accelerates research and drug development, contributing to biomedical innovation and competitive healthcare industries. Broader access to advanced diagnostics can reduce disparities in healthcare delivery, though high equipment costs and workforce training needs remain challenges. Expansion of imaging infrastructure stimulates economic activity in healthcare services, manufacturing, and skilled employment, while supporting preventive care and personalized treatment strategies worldwide.
Segmental Analysis:
- The microscopy segment is expected to witness the highest growth over the forecast period
The microscopy segment is projected to experience the highest growth in the global biological imaging technology market due to increasing demand for high-resolution cellular and molecular imaging. Advanced techniques, including confocal, fluorescence, and super-resolution microscopy, are widely used in biomedical research, drug discovery, and genomics studies. Rising adoption in academic and pharmaceutical research institutions, along with the integration of AI for automated image analysis, enhances precision and efficiency. Continuous technological innovations, such as live-cell imaging and multi-modal microscopy, further expand applications. The need for detailed visualization in early disease detection and personalized medicine drives strong market growth.
- Diagnostics segment is expected to witness the highest growth over the forecast period
The diagnostics segment is expected to grow significantly, driven by the rising prevalence of chronic and lifestyle-related diseases worldwide. Imaging technologies like MRI, PET, CT, and molecular imaging play a critical role in early detection, treatment planning, and monitoring of conditions such as cancer, cardiovascular diseases, and neurological disorders. Increasing awareness of preventive healthcare and personalized medicine further boosts demand. Hospitals, diagnostic centers, and specialty clinics are investing in advanced imaging equipment to improve clinical outcomes. Moreover, government initiatives and healthcare infrastructure development in emerging markets support the expansion of diagnostic imaging services, fueling the segment’s rapid growth.
- North American Region is expected to witness the highest growth over the forecast period
North America is projected to witness the highest growth in the global biological imaging technology market due to advanced healthcare infrastructure, high adoption of innovative imaging systems, and strong investment in research and development. The region’s focus on early disease detection, personalized medicine, and cancer diagnostics drives demand for high-end imaging technologies. For instance, in May 2025, Stately Bio secured USD 12 million in seed funding to scale its ML-powered live-cell imaging platform and advance stem cell-derived therapeutics. This investment boosted North America’s Biological Imaging Technology Market by accelerating adoption of AI-integrated imaging solutions, enhancing live-cell analysis capabilities, and driving innovation in cell therapy research, strengthening the region’s leadership in advanced biomedical imaging technologies.
Similarly, in April 2025, Kanvas Biosciences showcased its HiPR-Map Platform, a high-resolution spectral imaging technology enabling precise microbial cell mapping at single-cell and species-level resolution. This advancement strengthened North America’s Biological Imaging Technology Market by enhancing spatial and functional analysis of microbial communities, outperforming traditional methods, and supporting live biotherapeutic product research, thereby driving adoption of advanced imaging solutions in microbiology and biopharmaceutical development.
Additionally, supportive regulatory frameworks, extensive funding for biomedical research, and presence of major market players contribute to rapid growth. The increasing prevalence of chronic diseases and government initiatives promoting healthcare modernization further strengthen market expansion. North America remains a leader in technological adoption and innovation in biological imaging.
To Learn More About This Report - Request a Free Sample Copy
Biological Imaging Technology Market Competitive Landscape
The competitive landscape of the Global Biological Imaging Technology Market features established multinational corporations and innovative niche players. Leaders such as Thermo Fisher Scientific, Siemens Healthineers, GE Healthcare, Philips, Olympus, Nikon, and Agilent dominate through extensive R&D investment and strategic collaborations. These companies focus on developing high resolution systems, AI enhanced imaging, and integrated platforms for clinical and research use. Competition emphasizes technological differentiation, product performance, and partnerships with hospitals and research institutions. Smaller and emerging firms often target specialized segments or technologies, such as advanced probes or data management platforms, intensifying innovation.
The major players for this market are:
- Thermo Fisher Scientific Inc.
- Siemens Healthineers AG
- Fujifilm Holdings Corporation
- Koninklijke Philips N.V.
- GE HealthCare Technologies Inc.
- Konica Minolta Inc.
- Agilent Technologies Inc.
- Keyence Corporation
- Olympus Corporation / Evident
- Nikon Corporation
- Canon Medical Systems (Canon Inc.)
- Bruker Corporation
- Leica Microsystems (Danaher)
- Hamamatsu Photonics K.K.
- Carl Zeiss AG / ZEISS Group
- Bio Rad Laboratories, Inc.
- Andor Technology Ltd.
- PerkinElmer, Inc.
- Danaher Corporation
- CytoViva
Recent Development
- In August 2025, PAVmed Inc. executed a non-binding agreement with Duke University to license advanced esophageal precancer detection technology combining a/LCI and OCT. This development enhanced the Global Biological Imaging Technology Market by introducing more efficient, non-invasive diagnostic tools, potentially reducing reliance on traditional biopsies and accelerating adoption of multi-modality imaging solutions in gastroenterology and early cancer detection applications worldwide.
- In March 2025, Thermo Fisher Scientific formed a Technology Alliance with the Chan Zuckerberg Imaging Institute to develop advanced tools for visualizing human cells. This collaboration strengthened the Global Biological Imaging Technology Market by accelerating innovation in high-resolution cellular imaging, enhancing research capabilities, and supporting breakthroughs in biomedical studies, thereby driving demand for cutting-edge imaging technologies across academic, pharmaceutical, and biotechnology sectors worldwide.
Frequently Asked Questions (FAQ) :
Q1. What are the main growth-driving factors for this market?
The market is growing due to the rising need for early and accurate disease diagnosis, particularly for cancer and neurological disorders. Advances in high-resolution microscopy and molecular imaging are allowing researchers to see biological processes in real-time. Additionally, increased funding for life sciences and drug discovery research is driving the demand for sophisticated imaging tools.
Q2. What are the main restraining factors for this market?
Growth is limited by the very high cost of advanced imaging systems, such as super-resolution microscopes and MRI scanners, which can be unaffordable for smaller labs. A shortage of highly skilled technicians to operate these complex machines is also a challenge. Furthermore, strict regulatory approval processes for new imaging agents and technologies can delay market entry.
Q3. Which segment is expected to witness high growth?
The Optical Imaging segment is expected to see the highest growth. This technology is non-invasive and does not use harmful radiation, making it ideal for repeated observations in live subjects. Its increasing use in "near-infrared" fluorescence and bioluminescence for preclinical research and surgical guidance is making it a top choice for modern medical and laboratory facilities.
Q4. Who are the top major players for this market?
The market is led by global leaders in optics and medical technology. Key players include Olympus Corporation, Carl Zeiss AG, Leica Microsystems (Danaher), Nikon Corporation, and GE HealthCare. These companies dominate by continuously innovating with AI-integrated software that helps scientists analyze massive amounts of imaging data more quickly and accurately than ever before.
Q5. Which country is the largest player?
The United States is the largest player in the biological imaging market. It holds this position due to its massive investment in biotechnology R&D and the presence of world-class academic research institutions. A strong focus on personalized medicine and a well-funded healthcare system ensure a constant demand for the latest imaging innovations.
List of Figures
Figure 1: Global Biological Imaging Technology Market Revenue Breakdown (USD Billion, %) by Region, 2019 & 2027
Figure 2: Global Biological Imaging Technology Market Value Share (%), By Segment 1, 2019 & 2027
Figure 3: Global Biological Imaging Technology Market Forecast (USD Billion), by Sub-Segment 1, 2016-2027
Figure 4: Global Biological Imaging Technology Market Forecast (USD Billion), by Sub-Segment 2, 2016-2027
Figure 5: Global Biological Imaging Technology Market Value Share (%), By Segment 2, 2019 & 2027
Figure 6: Global Biological Imaging Technology Market Forecast (USD Billion), by Sub-Segment 1, 2016-2027
Figure 7: Global Biological Imaging Technology Market Forecast (USD Billion), by Sub-Segment 2, 2016-2027
Figure 8: Global Biological Imaging Technology Market Forecast (USD Billion), by Sub-Segment 3, 2016-2027
Figure 9: Global Biological Imaging Technology Market Forecast (USD Billion), by Others, 2016-2027
Figure 10: Global Biological Imaging Technology Market Value Share (%), By Segment 3, 2019 & 2027
Figure 11: Global Biological Imaging Technology Market Forecast (USD Billion), by Sub-Segment 1, 2016-2027
Figure 12: Global Biological Imaging Technology Market Forecast (USD Billion), by Sub-Segment 2, 2016-2027
Figure 13: Global Biological Imaging Technology Market Forecast (USD Billion), by Sub-Segment 3, 2016-2027
Figure 14: Global Biological Imaging Technology Market Forecast (USD Billion), by Others, 2016-2027
Figure 15: Global Biological Imaging Technology Market Value (USD Billion), by Region, 2019 & 2027
Figure 16: North America Biological Imaging Technology Market Value Share (%), By Segment 1, 2019 & 2027
Figure 17: North America Biological Imaging Technology Market Forecast (USD Billion), by Sub-Segment 1, 2016-2027
Figure 18: North America Biological Imaging Technology Market Forecast (USD Billion), by Sub-Segment 2, 2016-2027
Figure 19: North America Biological Imaging Technology Market Value Share (%), By Segment 2, 2019 & 2027
Figure 20: North America Biological Imaging Technology Market Forecast (USD Billion), by Sub-Segment 1, 2016-2027
Figure 21: North America Biological Imaging Technology Market Forecast (USD Billion), by Sub-Segment 2, 2016-2027
Figure 22: North America Biological Imaging Technology Market Forecast (USD Billion), by Sub-Segment 3, 2016-2027
Figure 23: North America Biological Imaging Technology Market Forecast (USD Billion), by Others, 2016-2027
Figure 24: North America Biological Imaging Technology Market Value Share (%), By Segment 3, 2019 & 2027
Figure 25: North America Biological Imaging Technology Market Forecast (USD Billion), by Sub-Segment 1, 2016-2027
Figure 26: North America Biological Imaging Technology Market Forecast (USD Billion), by Sub-Segment 2, 2016-2027
Figure 27: North America Biological Imaging Technology Market Forecast (USD Billion), by Sub-Segment 3, 2016-2027
Figure 28: North America Biological Imaging Technology Market Forecast (USD Billion), by Others, 2016-2027
Figure 29: North America Biological Imaging Technology Market Forecast (USD Billion), by U.S., 2016-2027
Figure 30: North America Biological Imaging Technology Market Forecast (USD Billion), by Canada, 2016-2027
Figure 31: Latin America Biological Imaging Technology Market Value Share (%), By Segment 1, 2019 & 2027
Figure 32: Latin America Biological Imaging Technology Market Forecast (USD Billion), by Sub-Segment 1, 2016-2027
Figure 33: Latin America Biological Imaging Technology Market Forecast (USD Billion), by Sub-Segment 2, 2016-2027
Figure 34: Latin America Biological Imaging Technology Market Value Share (%), By Segment 2, 2019 & 2027
Figure 35: Latin America Biological Imaging Technology Market Forecast (USD Billion), by Sub-Segment 1, 2016-2027
Figure 36: Latin America Biological Imaging Technology Market Forecast (USD Billion), by Sub-Segment 2, 2016-2027
Figure 37: Latin America Biological Imaging Technology Market Forecast (USD Billion), by Sub-Segment 3, 2016-2027
Figure 38: Latin America Biological Imaging Technology Market Forecast (USD Billion), by Others, 2016-2027
Figure 39: Latin America Biological Imaging Technology Market Value Share (%), By Segment 3, 2019 & 2027
Figure 40: Latin America Biological Imaging Technology Market Forecast (USD Billion), by Sub-Segment 1, 2016-2027
Figure 41: Latin America Biological Imaging Technology Market Forecast (USD Billion), by Sub-Segment 2, 2016-2027
Figure 42: Latin America Biological Imaging Technology Market Forecast (USD Billion), by Sub-Segment 3, 2016-2027
Figure 43: Latin America Biological Imaging Technology Market Forecast (USD Billion), by Others, 2016-2027
Figure 44: Latin America Biological Imaging Technology Market Forecast (USD Billion), by Brazil, 2016-2027
Figure 45: Latin America Biological Imaging Technology Market Forecast (USD Billion), by Mexico, 2016-2027
Figure 46: Latin America Biological Imaging Technology Market Forecast (USD Billion), by Rest of Latin America, 2016-2027
Figure 47: Europe Biological Imaging Technology Market Value Share (%), By Segment 1, 2019 & 2027
Figure 48: Europe Biological Imaging Technology Market Forecast (USD Billion), by Sub-Segment 1, 2016-2027
Figure 49: Europe Biological Imaging Technology Market Forecast (USD Billion), by Sub-Segment 2, 2016-2027
Figure 50: Europe Biological Imaging Technology Market Value Share (%), By Segment 2, 2019 & 2027
Figure 51: Europe Biological Imaging Technology Market Forecast (USD Billion), by Sub-Segment 1, 2016-2027
Figure 52: Europe Biological Imaging Technology Market Forecast (USD Billion), by Sub-Segment 2, 2016-2027
Figure 53: Europe Biological Imaging Technology Market Forecast (USD Billion), by Sub-Segment 3, 2016-2027
Figure 54: Europe Biological Imaging Technology Market Forecast (USD Billion), by Others, 2016-2027
Figure 55: Europe Biological Imaging Technology Market Value Share (%), By Segment 3, 2019 & 2027
Figure 56: Europe Biological Imaging Technology Market Forecast (USD Billion), by Sub-Segment 1, 2016-2027
Figure 57: Europe Biological Imaging Technology Market Forecast (USD Billion), by Sub-Segment 2, 2016-2027
Figure 58: Europe Biological Imaging Technology Market Forecast (USD Billion), by Sub-Segment 3, 2016-2027
Figure 59: Europe Biological Imaging Technology Market Forecast (USD Billion), by Others, 2016-2027
Figure 60: Europe Biological Imaging Technology Market Forecast (USD Billion), by U.K., 2016-2027
Figure 61: Europe Biological Imaging Technology Market Forecast (USD Billion), by Germany, 2016-2027
Figure 62: Europe Biological Imaging Technology Market Forecast (USD Billion), by France, 2016-2027
Figure 63: Europe Biological Imaging Technology Market Forecast (USD Billion), by Italy, 2016-2027
Figure 64: Europe Biological Imaging Technology Market Forecast (USD Billion), by Spain, 2016-2027
Figure 65: Europe Biological Imaging Technology Market Forecast (USD Billion), by Russia, 2016-2027
Figure 66: Europe Biological Imaging Technology Market Forecast (USD Billion), by Rest of Europe, 2016-2027
Figure 67: Asia Pacific Biological Imaging Technology Market Value Share (%), By Segment 1, 2019 & 2027
Figure 68: Asia Pacific Biological Imaging Technology Market Forecast (USD Billion), by Sub-Segment 1, 2016-2027
Figure 69: Asia Pacific Biological Imaging Technology Market Forecast (USD Billion), by Sub-Segment 2, 2016-2027
Figure 70: Asia Pacific Biological Imaging Technology Market Value Share (%), By Segment 2, 2019 & 2027
Figure 71: Asia Pacific Biological Imaging Technology Market Forecast (USD Billion), by Sub-Segment 1, 2016-2027
Figure 72: Asia Pacific Biological Imaging Technology Market Forecast (USD Billion), by Sub-Segment 2, 2016-2027
Figure 73: Asia Pacific Biological Imaging Technology Market Forecast (USD Billion), by Sub-Segment 3, 2016-2027
Figure 74: Asia Pacific Biological Imaging Technology Market Forecast (USD Billion), by Others, 2016-2027
Figure 75: Asia Pacific Biological Imaging Technology Market Value Share (%), By Segment 3, 2019 & 2027
Figure 76: Asia Pacific Biological Imaging Technology Market Forecast (USD Billion), by Sub-Segment 1, 2016-2027
Figure 77: Asia Pacific Biological Imaging Technology Market Forecast (USD Billion), by Sub-Segment 2, 2016-2027
Figure 78: Asia Pacific Biological Imaging Technology Market Forecast (USD Billion), by Sub-Segment 3, 2016-2027
Figure 79: Asia Pacific Biological Imaging Technology Market Forecast (USD Billion), by Others, 2016-2027
Figure 80: Asia Pacific Biological Imaging Technology Market Forecast (USD Billion), by China, 2016-2027
Figure 81: Asia Pacific Biological Imaging Technology Market Forecast (USD Billion), by India, 2016-2027
Figure 82: Asia Pacific Biological Imaging Technology Market Forecast (USD Billion), by Japan, 2016-2027
Figure 83: Asia Pacific Biological Imaging Technology Market Forecast (USD Billion), by Australia, 2016-2027
Figure 84: Asia Pacific Biological Imaging Technology Market Forecast (USD Billion), by Southeast Asia, 2016-2027
Figure 85: Asia Pacific Biological Imaging Technology Market Forecast (USD Billion), by Rest of Asia Pacific, 2016-2027
Figure 86: Middle East & Africa Biological Imaging Technology Market Value Share (%), By Segment 1, 2019 & 2027
Figure 87: Middle East & Africa Biological Imaging Technology Market Forecast (USD Billion), by Sub-Segment 1, 2016-2027
Figure 88: Middle East & Africa Biological Imaging Technology Market Forecast (USD Billion), by Sub-Segment 2, 2016-2027
Figure 89: Middle East & Africa Biological Imaging Technology Market Value Share (%), By Segment 2, 2019 & 2027
Figure 90: Middle East & Africa Biological Imaging Technology Market Forecast (USD Billion), by Sub-Segment 1, 2016-2027
Figure 91: Middle East & Africa Biological Imaging Technology Market Forecast (USD Billion), by Sub-Segment 2, 2016-2027
Figure 92: Middle East & Africa Biological Imaging Technology Market Forecast (USD Billion), by Sub-Segment 3, 2016-2027
Figure 93: Middle East & Africa Biological Imaging Technology Market Forecast (USD Billion), by Others, 2016-2027
Figure 94: Middle East & Africa Biological Imaging Technology Market Value Share (%), By Segment 3, 2019 & 2027
Figure 95: Middle East & Africa Biological Imaging Technology Market Forecast (USD Billion), by Sub-Segment 1, 2016-2027
Figure 96: Middle East & Africa Biological Imaging Technology Market Forecast (USD Billion), by Sub-Segment 2, 2016-2027
Figure 97: Middle East & Africa Biological Imaging Technology Market Forecast (USD Billion), by Sub-Segment 3, 2016-2027
Figure 98: Middle East & Africa Biological Imaging Technology Market Forecast (USD Billion), by Others, 2016-2027
Figure 99: Middle East & Africa Biological Imaging Technology Market Forecast (USD Billion), by GCC, 2016-2027
Figure 100: Middle East & Africa Biological Imaging Technology Market Forecast (USD Billion), by South Africa, 2016-2027
Figure 101: Middle East & Africa Biological Imaging Technology Market Forecast (USD Billion), by Rest of Middle East & Africa, 2016-2027
List of Tables
Table 1: Global Biological Imaging Technology Market Revenue (USD Billion) Forecast, by Segment 1, 2016-2027
Table 2: Global Biological Imaging Technology Market Revenue (USD Billion) Forecast, by Segment 2, 2016-2027
Table 3: Global Biological Imaging Technology Market Revenue (USD Billion) Forecast, by Segment 3, 2016-2027
Table 4: Global Biological Imaging Technology Market Revenue (USD Billion) Forecast, by Region, 2016-2027
Table 5: North America Biological Imaging Technology Market Revenue (USD Billion) Forecast, by Segment 1, 2016-2027
Table 6: North America Biological Imaging Technology Market Revenue (USD Billion) Forecast, by Segment 2, 2016-2027
Table 7: North America Biological Imaging Technology Market Revenue (USD Billion) Forecast, by Segment 3, 2016-2027
Table 8: North America Biological Imaging Technology Market Revenue (USD Billion) Forecast, by Country, 2016-2027
Table 9: Europe Biological Imaging Technology Market Revenue (USD Billion) Forecast, by Segment 1, 2016-2027
Table 10: Europe Biological Imaging Technology Market Revenue (USD Billion) Forecast, by Segment 2, 2016-2027
Table 11: Europe Biological Imaging Technology Market Revenue (USD Billion) Forecast, by Segment 3, 2016-2027
Table 12: Europe Biological Imaging Technology Market Revenue (USD Billion) Forecast, by Country, 2016-2027
Table 13: Latin America Biological Imaging Technology Market Revenue (USD Billion) Forecast, by Segment 1, 2016-2027
Table 14: Latin America Biological Imaging Technology Market Revenue (USD Billion) Forecast, by Segment 2, 2016-2027
Table 15: Latin America Biological Imaging Technology Market Revenue (USD Billion) Forecast, by Segment 3, 2016-2027
Table 16: Latin America Biological Imaging Technology Market Revenue (USD Billion) Forecast, by Country, 2016-2027
Table 17: Asia Pacific Biological Imaging Technology Market Revenue (USD Billion) Forecast, by Segment 1, 2016-2027
Table 18: Asia Pacific Biological Imaging Technology Market Revenue (USD Billion) Forecast, by Segment 2, 2016-2027
Table 19: Asia Pacific Biological Imaging Technology Market Revenue (USD Billion) Forecast, by Segment 3, 2016-2027
Table 20: Asia Pacific Biological Imaging Technology Market Revenue (USD Billion) Forecast, by Country, 2016-2027
Table 21: Middle East & Africa Biological Imaging Technology Market Revenue (USD Billion) Forecast, by Segment 1, 2016-2027
Table 22: Middle East & Africa Biological Imaging Technology Market Revenue (USD Billion) Forecast, by Segment 2, 2016-2027
Table 23: Middle East & Africa Biological Imaging Technology Market Revenue (USD Billion) Forecast, by Segment 3, 2016-2027
Table 24: Middle East & Africa Biological Imaging Technology Market Revenue (USD Billion) Forecast, by Country, 2016-2027
Research Process
Data Library Research are conducted by industry experts who offer insight on
industry structure, market segmentations technology assessment and competitive landscape (CL), and penetration, as well as on emerging trends. Their analysis is based on primary interviews (~ 80%) and secondary research (~ 20%) as well as years of professional expertise in their respective industries. Adding to this, by analysing historical trends and current market positions, our analysts predict where the market will be headed for the next five years. Furthermore, the varying trends of segment & categories geographically presented are also studied and the estimated based on the primary & secondary research.
In this particular report from the supply side Data Library Research has conducted primary surveys (interviews) with the key level executives (VP, CEO’s, Marketing Director, Business Development Manager
and SOFT) of the companies that active & prominent as well as the midsized organization
FIGURE 1: DLR RESEARH PROCESS
![research-methodology1]()
Primary Research
Extensive primary research was conducted to gain a deeper insight of the market and industry performance. The analysis is based on both primary and secondary research as well as years of professional expertise in the respective industries.
In addition to analysing current and historical trends, our analysts predict where the market is headed over the next five years.
It varies by segment for these categories geographically presented in the list of market tables. Speaking about this particular report we have conducted primary surveys (interviews) with the key level executives (VP, CEO’s, Marketing Director, Business Development Manager and many more) of the major players active in the market.
Secondary Research
Secondary research was mainly used to collect and identify information useful for the extensive, technical, market-oriented, and Friend’s study of the Global Extra Neutral Alcohol. It was also used to obtain key information about major players, market classification and segmentation according to the industry trends, geographical markets, and developments related to the market and technology perspectives. For this study, analysts have gathered information from various credible sources, such as annual reports, sec filings, journals, white papers, SOFT presentations, and company web sites.
Market Size Estimation
Both, top-down and bottom-up approaches were used to estimate and validate the size of the Global market and to estimate the size of various other dependent submarkets in the overall Extra Neutral Alcohol. The key players in the market were identified through secondary research and their market contributions in the respective geographies were determined through primary and secondary research.
Forecast Model
![research-methodology2]()