Counter-UAS Technology Market Overview and Analysis
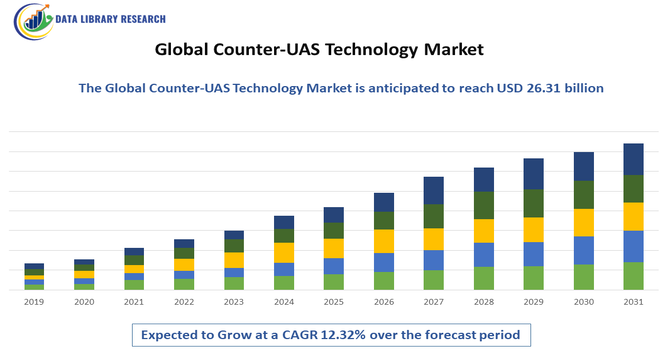
The Global Counter-UAS Technology Market value is projected to be USD 26.31 billion by 2032, growing from USD 8.24 billion in 2025, growing with a CAGR of 12.32% from 2025-2032.
Get Complete Analysis Of The Report - Download Updated Free Sample PDF
The Global Counter-UAS (Unmanned Aerial Systems) Technology Market involves solutions designed to detect, track, and neutralize unauthorized or hostile drones. It includes radar, radio frequency, electro-optical, and directed energy systems deployed across defense, critical infrastructure, and commercial sectors. Rising drone threats, regulatory frameworks, and security concerns drive the adoption of advanced counter-UAS technologies globally.
Counter-UAS Technology Market Latest Trends
The Counter-UAS technology market is witnessing rapid growth due to the increasing deployment of drones for commercial, recreational, and malicious purposes. Adoption of multi-sensor solutions combining radar, radio frequency, electro-optical, and infrared technologies is rising, enabling real-time detection and mitigation. Governments and defense agencies are investing heavily in integrated C-UAS systems to protect airports, military bases, critical infrastructure, and urban areas. AI-powered threat analysis, automated response systems, and portable solutions are gaining traction.
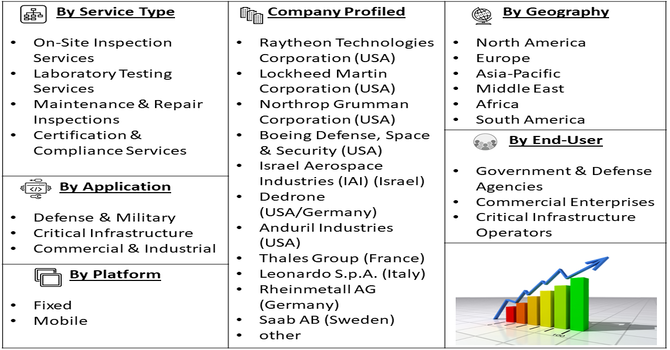
Segmentation: The Counter-UAS technology market is segmented by Type of System (Detection Systems and Neutralization Systems), Platform (Fixed and Mobile), Application (Defense & Military, Critical Infrastructure and Commercial & Industrial), End User (Government & Defense Agencies, Commercial Enterprises and Critical Infrastructure Operators), and Geography (North America, Europe, Asia-Pacific, Middle East and Africa, and South America). The report provides the value (in USD million) for the above segments.
For Detailed Market Segmentation - Get a Free Sample PDF
Market Drivers:
- Rising Security Threats from Unauthorized and Malicious Drones
The increasing drone incidents, including trespassing, espionage, smuggling, and terrorist attacks, drive the adoption of Counter-UAS technologies. Defense agencies, airports, and critical infrastructure face heightened risks from low-cost drones capable of carrying payloads, surveillance devices, or explosives. Rising public and private security concerns accelerate investment in detection, tracking, and neutralization systems. The need for proactive threat mitigation and real-time response capabilities encourages the deployment of integrated, multi-sensor C-UAS platforms. Governments are introducing stricter regulations and mandates for drone monitoring, further boosting market demand. Consequently, rising drone-related threats act as a primary driver of the global Counter-UAS technology market.
- Technological Advancements and Integration with AI and IoT
Advancements in radar, radio frequency, electro-optical sensors, and directed energy systems enhance Counter-UAS performance. Integration with AI and IoT enables automated threat detection, predictive analytics, and coordinated neutralization of rogue drones. AI-powered systems can classify threats, reduce false alarms, and optimize response time, increasing operational efficiency. Portable and networked solutions allow rapid deployment across urban, military, and industrial sites. These technological innovations attract defense, commercial, and critical infrastructure clients, promoting widespread adoption. Continuous R&D, collaboration between tech startups and defense contractors, and innovations in detection, tracking, and mitigation systems significantly propel the growth of the global Counter-UAS market.
Market Restraints:
- High Cost of Implementation and Maintenance
A major restraint in the Counter-UAS market is the high cost of deploying and maintaining advanced detection and neutralization systems. Sophisticated radar, RF jamming, directed energy, and multi-sensor platforms require substantial capital investment, limiting adoption among small-scale commercial users. Operational and maintenance expenses, including software updates, training, and system calibration, further increase costs. Budget constraints in developing regions restrict widespread implementation. Additionally, integrating these systems into existing security infrastructure can be complex and expensive. High initial and operational costs may slow market growth, especially for non-defense sectors, despite increasing demand for drone threat mitigation solutions.
Socioeconomic Impact on Counter-UAS Technology Market
Counter-UAS technologies enhance public safety and security, protecting critical infrastructure, defense installations, and urban airspace from malicious drone activity. They prevent economic losses caused by unauthorized drone operations, mitigate potential accidents, and safeguard high-value assets. Employment opportunities are created in R&D, manufacturing, and system integration. Commercial adoption in sectors like energy, logistics, and aviation improves operational reliability and reduces insurance risks. Public confidence in airspace safety is strengthened, supporting broader drone integration for commercial applications. Overall, counter-UAS deployment ensures national security, promotes technological advancement, and contributes to societal protection while enabling the responsible growth of drone-based services.
Segmental Analysis:
- Detection Systems segment is expected to witness highest growth over the forecast period
The Detection Systems segment is expected to witness the highest growth over the forecast period due to the increasing need for early and accurate identification of unauthorized drones. Advanced radar, RF-based, EO/IR, and multi-sensor fusion technologies allow real-time monitoring and precise threat classification, minimizing false alarms. Rising drone-related security incidents across airports, urban areas, and critical infrastructure have accelerated investments in detection solutions. The integration of AI and machine learning for automated threat analysis further enhances system efficiency. Consequently, detection systems remain a critical first line of defense, driving strong demand and market growth globally.
- Defense & Military segment is expected to witness highest growth over the forecast period
The Defense & Military segment is projected to experience the highest growth as armed forces globally increasingly deploy Counter-UAS technologies to safeguard borders, military bases, and operational theaters. Rising threats from hostile drones, espionage, and unmanned aerial attacks necessitate real-time detection and neutralization capabilities. Governments are investing in integrated multi-layered systems combining detection, jamming, and kinetic solutions for battlefield and strategic defense. Additionally, the adoption of AI-driven threat analytics and autonomous mitigation enhances operational efficiency. Continuous modernization programs and procurement of advanced Counter-UAS platforms by militaries worldwide are major factors propelling growth in this segment.
- Government & Defense Agencies segment is expected to witness highest growth over the forecast period
Government and defense agencies are expected to witness the highest growth in the Counter-UAS market due to their increasing responsibility for national security and critical infrastructure protection. Agencies are investing heavily in multi-sensor detection systems, RF and GPS jammers, and directed energy solutions to counter unauthorized drone activity over sensitive sites like airports, power plants, and government facilities. Policy mandates, regulatory compliance, and public safety concerns drive large-scale adoption. Strategic collaborations between government bodies and technology providers ensure rapid deployment and continuous system upgrades. These factors collectively position government and defense agencies as the primary end users driving market expansion.
- North America region is expected to witness highest growth over the forecast period
North America is anticipated to witness the highest growth over the forecast period owing to advanced technological capabilities, strong defense budgets, and proactive government regulations. The region faces significant drone-related threats, including border security, critical infrastructure, and public event monitoring, prompting widespread Counter-UAS adoption.
The presence of leading technology providers, R&D investments, and collaborations between defense agencies and private sector companies accelerate innovation in detection and neutralization systems. For instance, in September 2025, Honeywell bolstered North America’s Counter-UAS Technology Market by successfully demonstrating its Stationary and Mobile UAS Reveal and Intercept system, including swarm-drone counter capabilities. Tested from ground vehicles and aerostats over 1,000 feet, the demonstrations highlighted advanced defense readiness, driving regional adoption of innovative, high-performance C-UAS solutions.
Similarly, in October 2025, VisionWave Holdings strengthened North America’s Counter-UAS Technology Market by showcasing and installing its C-UAS solutions on a Tier-1 U.S. defense contractor’s platform at the AUSA 2025 Expo. This high-profile demonstration enhanced visibility, validated technological capabilities, and reinforced adoption of advanced counter-drone systems across U.S. defense applications.
Additionally, regulatory frameworks from the FAA and Department of Defense support integration of Counter-UAS solutions. High awareness of security risks, coupled with technological advancements, positions North America as the fastest-growing regional market globally.
| Report Matrics |
Details |
| Market Size Value |
USD 8.24 billion |
| Growth Rate |
CAGR of 12.32 % |
| Forecast |
2026-2033 |
| Historical data |
2021-2024 |
| Base Year |
2025 |
| Report Coverage |
Forecasted revenue, company rating, competitive environment, growth drivers, and trends |
| Segment Coverage |
Type, Application, End-User, Geography |
| Regional Scope |
North America, Europe, Asia Pacific, Middle East |
| Customized scope |
Free customization of reports (With 3 months' analysis support) |
| To Learn More About This Report |
Request a Free Sample Copy |
Counter-UAS Technology Market Competitive Landscape:
The competitive landscape of the Counter-UAS market includes defense contractors, technology startups, and integrated security solution providers. Major players differentiate through advanced detection systems, modular solutions, and AI-powered threat analytics. Companies focus on geographic expansion, strategic partnerships, and collaborations with government agencies. Technological innovation, including directed energy weapons, RF jamming, and automated neutralization systems, drives competition. Key market participants include Raytheon Technologies, Lockheed Martin, Northrop Grumman, Boeing, Dedrone, Anduril Industries, and Israel Aerospace Industries. Providers emphasize customization, service contracts, and post-deployment support. Market dynamics are shaped by regulatory compliance, reliability, detection range, and the integration of multi-sensor technologies.
The major players for above market:
- Raytheon Technologies Corporation (USA)
- Lockheed Martin Corporation (USA)
- Northrop Grumman Corporation (USA)
- Boeing Defense, Space & Security (USA)
- Israel Aerospace Industries (IAI) (Israel)
- Dedrone (USA/Germany)
- Anduril Industries (USA)
- Thales Group (France)
- Leonardo S.p.A. (Italy)
- Rheinmetall AG (Germany)
- Saab AB (Sweden)
- DroneShield Ltd. (Australia)
- Liteye Systems, Inc. (USA)
- QinetiQ Group PLC (UK)
- Hensoldt AG (Germany)
- Rafael Advanced Defense Systems Ltd. (Israel)
- Epirus Inc. (USA)
- Blighter Surveillance Systems Ltd. (UK)
- SRC, Inc. (USA)
- DroneDefender (US-based, Battelle-developed technology)
Recent Development
- In October 2025, Fortem Technologies significantly impacted the Global Counter-UAS Technology Market by securing orders for twelve systems from U.S. allies in Europe and the Middle East in Q3 2025. The AI-enabled SkyDome systems, featuring autonomous DroneHunter interceptors and high-precision TrueView sensors, enhanced detection, tracking, and neutralization of unauthorized drones. Surging demand for scalable, reliable counter-drone solutions amid increasing rogue drone threats highlighted market growth potential and accelerated adoption of advanced C-UAS technologies globally.
- In August 2025, L3Harris Technologies strengthened the Global Counter-UAS Technology Market by launching its Counter-Unmanned Systems initiative, leveraging decades of expertise to deliver affordable, reliable solutions. The initiative addressed the rising global threats from unmanned systems, accelerating adoption of advanced C-UAS technologies and enhancing defense and security capabilities worldwide.
Frequently Asked Questions (FAQ) :
Q1. What are the main growth-driving factors for this market?
The primary driver is the growing threat posed by unauthorized and hostile Unmanned Aerial Systems (UAS), including those used for espionage and terrorism. The need to protect critical national assets like airports, military bases, and government buildings strongly fuels demand for robust counter-UAS (C-UAS) technology globally.
Q2. What are the main restraining factors for this market?
Market growth is hindered by the rapid evolution of drone technology, making it challenging for C-UAS systems to keep pace with new threats and swarm attacks. Also, legal restrictions on the use of electromagnetic jamming or kinetic defeat methods, especially in civilian airspace, pose significant challenges for widespread deployment.
Q3. Which segment is expected to witness high growth?
The Electronic Warfare (EW)/Jamming segment is anticipated to show the highest growth. These non-kinetic systems offer immediate disruption of a drone's control signals and navigation, making them ideal for protecting sensitive areas like airports and critical infrastructure without causing physical debris or collateral damage.
Q4. Who are the top major players for this market?
Major players are primarily large defense and aerospace companies. Key names include Lockheed Martin, Raytheon Technologies (RTX), and Thales Group. These companies leverage their expertise in radar, electronic warfare, and sensor systems to develop sophisticated, multi-layered C-UAS solutions for government and military clients worldwide.
Q5. Which country is the largest player?
The United States is the largest and most influential player in the C-UAS market. This dominance stems from its extensive defense budget, the urgent need for border and military base security, and the presence of major defense contractors pioneering next-generation detection and mitigation technologies.
List of Figures
Figure 1: Global Counter-UAS Technology Market Revenue Breakdown (USD Billion, %) by Region, 2022 & 2029
Figure 2: Global Counter-UAS Technology Market Value Share (%), By Segment 1, 2022 & 2029
Figure 3: Global Counter-UAS Technology Market Forecast (USD Billion), by Sub-Segment 1, 2018-2029
Figure 4: Global Counter-UAS Technology Market Forecast (USD Billion), by Sub-Segment 2, 2018-2029
Figure 5: Global Counter-UAS Technology Market Value Share (%), By Segment 2, 2022 & 2029
Figure 6: Global Counter-UAS Technology Market Forecast (USD Billion), by Sub-Segment 1, 2018-2029
Figure 7: Global Counter-UAS Technology Market Forecast (USD Billion), by Sub-Segment 2, 2018-2029
Figure 8: Global Counter-UAS Technology Market Forecast (USD Billion), by Sub-Segment 3, 2018-2029
Figure 9: Global Counter-UAS Technology Market Forecast (USD Billion), by Others, 2018-2029
Figure 10: Global Counter-UAS Technology Market Value Share (%), By Segment 3, 2022 & 2029
Figure 11: Global Counter-UAS Technology Market Forecast (USD Billion), by Sub-Segment 1, 2018-2029
Figure 12: Global Counter-UAS Technology Market Forecast (USD Billion), by Sub-Segment 2, 2018-2029
Figure 13: Global Counter-UAS Technology Market Forecast (USD Billion), by Sub-Segment 3, 2018-2029
Figure 14: Global Counter-UAS Technology Market Forecast (USD Billion), by Others, 2018-2029
Figure 15: Global Counter-UAS Technology Market Value (USD Billion), by Region, 2022 & 2029
Figure 16: North America Counter-UAS Technology Market Value Share (%), By Segment 1, 2022 & 2029
Figure 17: North America Counter-UAS Technology Market Forecast (USD Billion), by Sub-Segment 1, 2018-2029
Figure 18: North America Counter-UAS Technology Market Forecast (USD Billion), by Sub-Segment 2, 2018-2029
Figure 19: North America Counter-UAS Technology Market Value Share (%), By Segment 2, 2022 & 2029
Figure 20: North America Counter-UAS Technology Market Forecast (USD Billion), by Sub-Segment 1, 2018-2029
Figure 21: North America Counter-UAS Technology Market Forecast (USD Billion), by Sub-Segment 2, 2018-2029
Figure 22: North America Counter-UAS Technology Market Forecast (USD Billion), by Sub-Segment 3, 2018-2029
Figure 23: North America Counter-UAS Technology Market Forecast (USD Billion), by Others, 2018-2029
Figure 24: North America Counter-UAS Technology Market Value Share (%), By Segment 3, 2022 & 2029
Figure 25: North America Counter-UAS Technology Market Forecast (USD Billion), by Sub-Segment 1, 2018-2029
Figure 26: North America Counter-UAS Technology Market Forecast (USD Billion), by Sub-Segment 2, 2018-2029
Figure 27: North America Counter-UAS Technology Market Forecast (USD Billion), by Sub-Segment 3, 2018-2029
Figure 28: North America Counter-UAS Technology Market Forecast (USD Billion), by Others, 2018-2029
Figure 29: North America Counter-UAS Technology Market Forecast (USD Billion), by U.S., 2018-2029
Figure 30: North America Counter-UAS Technology Market Forecast (USD Billion), by Canada, 2018-2029
Figure 31: Latin America Counter-UAS Technology Market Value Share (%), By Segment 1, 2022 & 2029
Figure 32: Latin America Counter-UAS Technology Market Forecast (USD Billion), by Sub-Segment 1, 2018-2029
Figure 33: Latin America Counter-UAS Technology Market Forecast (USD Billion), by Sub-Segment 2, 2018-2029
Figure 34: Latin America Counter-UAS Technology Market Value Share (%), By Segment 2, 2022 & 2029
Figure 35: Latin America Counter-UAS Technology Market Forecast (USD Billion), by Sub-Segment 1, 2018-2029
Figure 36: Latin America Counter-UAS Technology Market Forecast (USD Billion), by Sub-Segment 2, 2018-2029
Figure 37: Latin America Counter-UAS Technology Market Forecast (USD Billion), by Sub-Segment 3, 2018-2029
Figure 38: Latin America Counter-UAS Technology Market Forecast (USD Billion), by Others, 2018-2029
Figure 39: Latin America Counter-UAS Technology Market Value Share (%), By Segment 3, 2022 & 2029
Figure 40: Latin America Counter-UAS Technology Market Forecast (USD Billion), by Sub-Segment 1, 2018-2029
Figure 41: Latin America Counter-UAS Technology Market Forecast (USD Billion), by Sub-Segment 2, 2018-2029
Figure 42: Latin America Counter-UAS Technology Market Forecast (USD Billion), by Sub-Segment 3, 2018-2029
Figure 43: Latin America Counter-UAS Technology Market Forecast (USD Billion), by Others, 2018-2029
Figure 44: Latin America Counter-UAS Technology Market Forecast (USD Billion), by Brazil, 2018-2029
Figure 45: Latin America Counter-UAS Technology Market Forecast (USD Billion), by Mexico, 2018-2029
Figure 46: Latin America Counter-UAS Technology Market Forecast (USD Billion), by Rest of Latin America, 2018-2029
Figure 47: Europe Counter-UAS Technology Market Value Share (%), By Segment 1, 2022 & 2029
Figure 48: Europe Counter-UAS Technology Market Forecast (USD Billion), by Sub-Segment 1, 2018-2029
Figure 49: Europe Counter-UAS Technology Market Forecast (USD Billion), by Sub-Segment 2, 2018-2029
Figure 50: Europe Counter-UAS Technology Market Value Share (%), By Segment 2, 2022 & 2029
Figure 51: Europe Counter-UAS Technology Market Forecast (USD Billion), by Sub-Segment 1, 2018-2029
Figure 52: Europe Counter-UAS Technology Market Forecast (USD Billion), by Sub-Segment 2, 2018-2029
Figure 53: Europe Counter-UAS Technology Market Forecast (USD Billion), by Sub-Segment 3, 2018-2029
Figure 54: Europe Counter-UAS Technology Market Forecast (USD Billion), by Others, 2018-2029
Figure 55: Europe Counter-UAS Technology Market Value Share (%), By Segment 3, 2022 & 2029
Figure 56: Europe Counter-UAS Technology Market Forecast (USD Billion), by Sub-Segment 1, 2018-2029
Figure 57: Europe Counter-UAS Technology Market Forecast (USD Billion), by Sub-Segment 2, 2018-2029
Figure 58: Europe Counter-UAS Technology Market Forecast (USD Billion), by Sub-Segment 3, 2018-2029
Figure 59: Europe Counter-UAS Technology Market Forecast (USD Billion), by Others, 2018-2029
Figure 60: Europe Counter-UAS Technology Market Forecast (USD Billion), by U.K., 2018-2029
Figure 61: Europe Counter-UAS Technology Market Forecast (USD Billion), by Germany, 2018-2029
Figure 62: Europe Counter-UAS Technology Market Forecast (USD Billion), by France, 2018-2029
Figure 63: Europe Counter-UAS Technology Market Forecast (USD Billion), by Italy, 2018-2029
Figure 64: Europe Counter-UAS Technology Market Forecast (USD Billion), by Spain, 2018-2029
Figure 65: Europe Counter-UAS Technology Market Forecast (USD Billion), by Russia, 2018-2029
Figure 66: Europe Counter-UAS Technology Market Forecast (USD Billion), by Rest of Europe, 2018-2029
Figure 67: Asia Pacific Counter-UAS Technology Market Value Share (%), By Segment 1, 2022 & 2029
Figure 68: Asia Pacific Counter-UAS Technology Market Forecast (USD Billion), by Sub-Segment 1, 2018-2029
Figure 69: Asia Pacific Counter-UAS Technology Market Forecast (USD Billion), by Sub-Segment 2, 2018-2029
Figure 70: Asia Pacific Counter-UAS Technology Market Value Share (%), By Segment 2, 2022 & 2029
Figure 71: Asia Pacific Counter-UAS Technology Market Forecast (USD Billion), by Sub-Segment 1, 2018-2029
Figure 72: Asia Pacific Counter-UAS Technology Market Forecast (USD Billion), by Sub-Segment 2, 2018-2029
Figure 73: Asia Pacific Counter-UAS Technology Market Forecast (USD Billion), by Sub-Segment 3, 2018-2029
Figure 74: Asia Pacific Counter-UAS Technology Market Forecast (USD Billion), by Others, 2018-2029
Figure 75: Asia Pacific Counter-UAS Technology Market Value Share (%), By Segment 3, 2022 & 2029
Figure 76: Asia Pacific Counter-UAS Technology Market Forecast (USD Billion), by Sub-Segment 1, 2018-2029
Figure 77: Asia Pacific Counter-UAS Technology Market Forecast (USD Billion), by Sub-Segment 2, 2018-2029
Figure 78: Asia Pacific Counter-UAS Technology Market Forecast (USD Billion), by Sub-Segment 3, 2018-2029
Figure 79: Asia Pacific Counter-UAS Technology Market Forecast (USD Billion), by Others, 2018-2029
Figure 80: Asia Pacific Counter-UAS Technology Market Forecast (USD Billion), by China, 2018-2029
Figure 81: Asia Pacific Counter-UAS Technology Market Forecast (USD Billion), by India, 2018-2029
Figure 82: Asia Pacific Counter-UAS Technology Market Forecast (USD Billion), by Japan, 2018-2029
Figure 83: Asia Pacific Counter-UAS Technology Market Forecast (USD Billion), by Australia, 2018-2029
Figure 84: Asia Pacific Counter-UAS Technology Market Forecast (USD Billion), by Southeast Asia, 2018-2029
Figure 85: Asia Pacific Counter-UAS Technology Market Forecast (USD Billion), by Rest of Asia Pacific, 2018-2029
Figure 86: Middle East & Africa Counter-UAS Technology Market Value Share (%), By Segment 1, 2022 & 2029
Figure 87: Middle East & Africa Counter-UAS Technology Market Forecast (USD Billion), by Sub-Segment 1, 2018-2029
Figure 88: Middle East & Africa Counter-UAS Technology Market Forecast (USD Billion), by Sub-Segment 2, 2018-2029
Figure 89: Middle East & Africa Counter-UAS Technology Market Value Share (%), By Segment 2, 2022 & 2029
Figure 90: Middle East & Africa Counter-UAS Technology Market Forecast (USD Billion), by Sub-Segment 1, 2018-2029
Figure 91: Middle East & Africa Counter-UAS Technology Market Forecast (USD Billion), by Sub-Segment 2, 2018-2029
Figure 92: Middle East & Africa Counter-UAS Technology Market Forecast (USD Billion), by Sub-Segment 3, 2018-2029
Figure 93: Middle East & Africa Counter-UAS Technology Market Forecast (USD Billion), by Others, 2018-2029
Figure 94: Middle East & Africa Counter-UAS Technology Market Value Share (%), By Segment 3, 2022 & 2029
Figure 95: Middle East & Africa Counter-UAS Technology Market Forecast (USD Billion), by Sub-Segment 1, 2018-2029
Figure 96: Middle East & Africa Counter-UAS Technology Market Forecast (USD Billion), by Sub-Segment 2, 2018-2029
Figure 97: Middle East & Africa Counter-UAS Technology Market Forecast (USD Billion), by Sub-Segment 3, 2018-2029
Figure 98: Middle East & Africa Counter-UAS Technology Market Forecast (USD Billion), by Others, 2018-2029
Figure 99: Middle East & Africa Counter-UAS Technology Market Forecast (USD Billion), by GCC, 2018-2029
Figure 100: Middle East & Africa Counter-UAS Technology Market Forecast (USD Billion), by South Africa, 2018-2029
Figure 101: Middle East & Africa Counter-UAS Technology Market Forecast (USD Billion), by Rest of Middle East & Africa, 2018-2029
List of Tables
Table 1: Global Counter-UAS Technology Market Revenue (USD Billion) Forecast, by Segment 1, 2018-2029
Table 2: Global Counter-UAS Technology Market Revenue (USD Billion) Forecast, by Segment 2, 2018-2029
Table 3: Global Counter-UAS Technology Market Revenue (USD Billion) Forecast, by Segment 3, 2018-2029
Table 4: Global Counter-UAS Technology Market Revenue (USD Billion) Forecast, by Region, 2018-2029
Table 5: North America Counter-UAS Technology Market Revenue (USD Billion) Forecast, by Segment 1, 2018-2029
Table 6: North America Counter-UAS Technology Market Revenue (USD Billion) Forecast, by Segment 2, 2018-2029
Table 7: North America Counter-UAS Technology Market Revenue (USD Billion) Forecast, by Segment 3, 2018-2029
Table 8: North America Counter-UAS Technology Market Revenue (USD Billion) Forecast, by Country, 2018-2029
Table 9: Europe Counter-UAS Technology Market Revenue (USD Billion) Forecast, by Segment 1, 2018-2029
Table 10: Europe Counter-UAS Technology Market Revenue (USD Billion) Forecast, by Segment 2, 2018-2029
Table 11: Europe Counter-UAS Technology Market Revenue (USD Billion) Forecast, by Segment 3, 2018-2029
Table 12: Europe Counter-UAS Technology Market Revenue (USD Billion) Forecast, by Country, 2018-2029
Table 13: Latin America Counter-UAS Technology Market Revenue (USD Billion) Forecast, by Segment 1, 2018-2029
Table 14: Latin America Counter-UAS Technology Market Revenue (USD Billion) Forecast, by Segment 2, 2018-2029
Table 15: Latin America Counter-UAS Technology Market Revenue (USD Billion) Forecast, by Segment 3, 2018-2029
Table 16: Latin America Counter-UAS Technology Market Revenue (USD Billion) Forecast, by Country, 2018-2029
Table 17: Asia Pacific Counter-UAS Technology Market Revenue (USD Billion) Forecast, by Segment 1, 2018-2029
Table 18: Asia Pacific Counter-UAS Technology Market Revenue (USD Billion) Forecast, by Segment 2, 2018-2029
Table 19: Asia Pacific Counter-UAS Technology Market Revenue (USD Billion) Forecast, by Segment 3, 2018-2029
Table 20: Asia Pacific Counter-UAS Technology Market Revenue (USD Billion) Forecast, by Country, 2018-2029
Table 21: Middle East & Africa Counter-UAS Technology Market Revenue (USD Billion) Forecast, by Segment 1, 2018-2029
Table 22: Middle East & Africa Counter-UAS Technology Market Revenue (USD Billion) Forecast, by Segment 2, 2018-2029
Table 23: Middle East & Africa Counter-UAS Technology Market Revenue (USD Billion) Forecast, by Segment 3, 2018-2029
Table 24: Middle East & Africa Counter-UAS Technology Market Revenue (USD Billion) Forecast, by Country, 2018-2029
Research Process
Data Library Research are conducted by industry experts who offer insight on
industry structure, market segmentations technology assessment and competitive landscape (CL), and penetration, as well as on emerging trends. Their analysis is based on primary interviews (~ 80%) and secondary research (~ 20%) as well as years of professional expertise in their respective industries. Adding to this, by analysing historical trends and current market positions, our analysts predict where the market will be headed for the next five years. Furthermore, the varying trends of segment & categories geographically presented are also studied and the estimated based on the primary & secondary research.
In this particular report from the supply side Data Library Research has conducted primary surveys (interviews) with the key level executives (VP, CEO’s, Marketing Director, Business Development Manager
and SOFT) of the companies that active & prominent as well as the midsized organization
FIGURE 1: DLR RESEARH PROCESS
![research-methodology1]()
Primary Research
Extensive primary research was conducted to gain a deeper insight of the market and industry performance. The analysis is based on both primary and secondary research as well as years of professional expertise in the respective industries.
In addition to analysing current and historical trends, our analysts predict where the market is headed over the next five years.
It varies by segment for these categories geographically presented in the list of market tables. Speaking about this particular report we have conducted primary surveys (interviews) with the key level executives (VP, CEO’s, Marketing Director, Business Development Manager and many more) of the major players active in the market.
Secondary Research
Secondary research was mainly used to collect and identify information useful for the extensive, technical, market-oriented, and Friend’s study of the Global Extra Neutral Alcohol. It was also used to obtain key information about major players, market classification and segmentation according to the industry trends, geographical markets, and developments related to the market and technology perspectives. For this study, analysts have gathered information from various credible sources, such as annual reports, sec filings, journals, white papers, SOFT presentations, and company web sites.
Market Size Estimation
Both, top-down and bottom-up approaches were used to estimate and validate the size of the Global market and to estimate the size of various other dependent submarkets in the overall Extra Neutral Alcohol. The key players in the market were identified through secondary research and their market contributions in the respective geographies were determined through primary and secondary research.
Forecast Model
![research-methodology2]()