Artificial Liver Technology Market Overview and Analysis

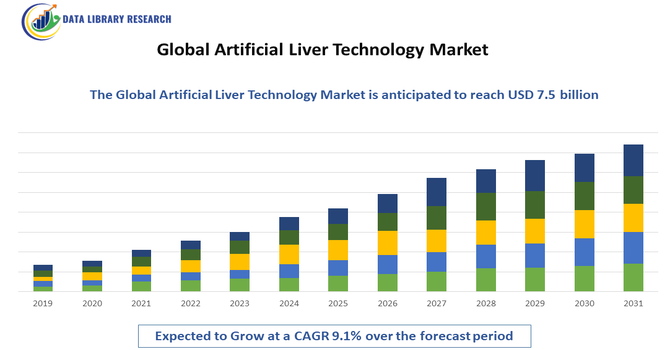
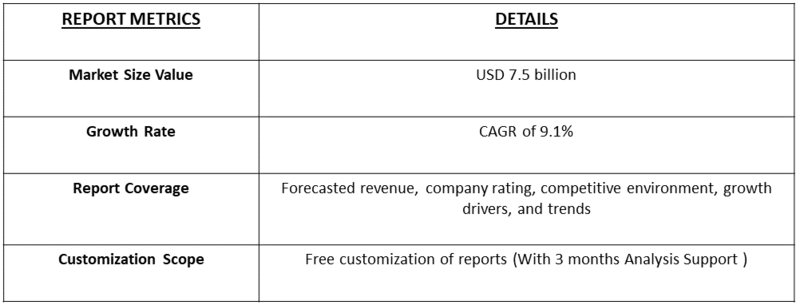
The Global Artificial Liver Technology Market size was valued at approximately $3.2 billion in 2023 and is projected to reach around $7.5 billion by 2032,

The Global Artificial Liver Technology Market involves medical devices and bioengineered systems designed to support or replace liver functions in patients with liver failure. These technologies, including bioartificial liver devices, extracorporeal liver support systems, and cell-based therapies, help detoxify blood, maintain metabolic balance, and improve patient outcomes. Rising liver disease prevalence and technological advancements are driving market growth globally.

The Global Artificial Liver Technology Market is driven by the increasing prevalence of liver diseases, including hepatitis, cirrhosis, and liver failure, which have created a growing demand for effective treatment solutions. Technological advancements in bioartificial liver devices, cell-based therapies, and extracorporeal liver support systems have improved patient outcomes and expanded clinical applications. Additionally, rising healthcare awareness, government initiatives supporting organ failure treatments, and increased research and development investments have further fueled the adoption and growth of artificial liver technologies worldwide.

Artificial Liver Technology Market Trends

The Artificial Liver Technology market has witnessed significant trends, including the development of advanced bioartificial liver systems integrating hepatocyte-based therapies and biomaterials for improved liver function support. Increasing adoption of extracorporeal liver support systems in critical care settings and the integration of AI and sensor-based monitoring for real-time patient management are shaping the market. Additionally, collaborations between research institutes and biotech companies are accelerating innovation and commercialization globally.

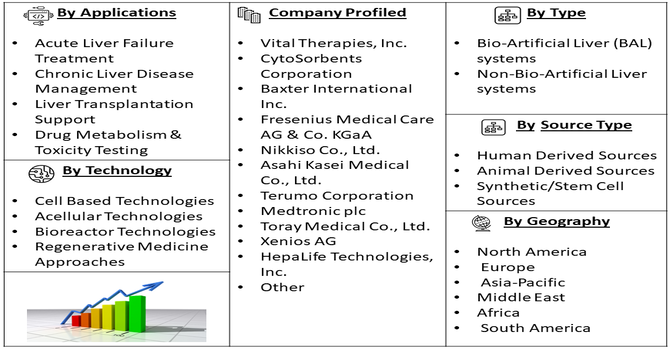
Segmentation: The Global Artificial Liver Technology Market is segmented primarily by the Type of System (Bio-Artificial Liver (BAL) systems, and Non-Bio-Artificial Liver systems), Technology Type (Cell Based Technologies, Acellular Technologies, Bioreactor Technologies, and Regenerative Medicine Approaches), Source Type (Human Derived Sources, Animal Derived Sources, and Synthetic/Stem Cell Sources), Application (Acute Liver Failure Treatment, Chronic Liver Disease Management, Liver Transplantation Support, And Drug Metabolism & Toxicity Testing) and Geography (North America, Europe, Asia-Pacific, Middle East and Africa, and South America). The report provides the value (in USD million) for the above segments.

Market Drivers:

  • Critical Shortage of Donor Livers and Rising Disease Burden

The most significant factor driving the market is the severe and growing worldwide shortage of compatible donor livers for transplantation. While liver failure cases are rising rapidly, primarily due to an escalating prevalence of conditions like non-alcoholic fatty liver disease (NAFLD), Hepatitis B and C, and alcohol-related liver damage, the supply of organs remains critically low. This disparity between the massive patient pool and the scarce availability of life-saving transplants creates an enormous unmet clinical need. Artificial liver support systems—both non-biological and bio-artificial—provide a critical, temporary lifeline to stabilize patients experiencing acute liver failure or acute-on-chronic failure, buying them precious time. This essential function in sustaining critically ill patients, when no other options exist, is compelling hospitals and healthcare systems globally to invest in these advanced supportive technologies.

  • Rapid Technological Advancement in Bio-Artificial Systems

Accelerating technological innovation, especially in Bio-Artificial Liver (BAL) systems, is a key market accelerator. Early systems focused primarily on detoxification, but newer generations are integrating living liver cells (hepatocytes) within advanced bioreactors. This allows the systems to not only filter toxins but also perform the liver's vital metabolic and synthetic functions, mimicking the human organ more closely. This enhanced functionality offers better patient outcomes, enabling the devices to serve as a reliable "bridge-to-recovery," giving the patient's native liver a chance to regenerate and avoid the need for a full transplant altogether. Continuous R&D into more efficient cell sources, improved bioreactor designs, and integrated diagnostics is consistently pushing the market forward by improving efficacy and reducing device size.

Market Restraint

  • High Cost and Complex Regulatory Pathways

The primary factor restraining the market growth is the prohibitively high cost associated with the development, manufacturing, and clinical deployment of artificial liver systems. Creating complex, functional bio-artificial systems requires expensive, specialized materials, sophisticated bioreactor technology, and extensive, highly specialized infrastructure. This results in substantial initial costs and high recurring operational expenses, limiting accessibility for many healthcare providers, especially in emerging economies. Furthermore, the technology is subject to extremely rigorous and lengthy regulatory approval processes (e.g., by the FDA and EMA) due to the use of biological components and its role as a life-support device, delaying market entry and commercial scaling.

Socio Economic Impact on Artificial Liver Technology Market

Artificial liver technologies have positively impacted society by improving survival rates for patients with acute and chronic liver failure, reducing dependence on donor organs, and lowering healthcare costs associated with prolonged hospitalizations. These innovations enhance quality of life for patients and reduce the socioeconomic burden of liver diseases, particularly in regions with high prevalence and limited access to liver transplantation.

Artificial liver technologies have also contributed to broader socioeconomic benefits by enabling faster patient recovery and reducing the strain on intensive care units and transplant waiting lists. By offering alternative or bridging therapies, these technologies minimize long-term disability and associated productivity losses, allowing patients to return to work and normal life sooner. This, in turn, reduces the economic burden on families, healthcare systems, and national economies, particularly in regions with high liver disease prevalence.

Segmental Analysis:

  • Bio-Artificial Liver (BAL) systems Segment is Expected to Witness Significant Growth Over the Forecast Period

The Bio-Artificial Liver (BAL) systems segment is expected to experience significant growth due to the rising prevalence of liver diseases, including acute and chronic liver failure. BAL systems combine biological components, such as hepatocytes, with mechanical devices to perform key liver functions, bridging patients to recovery or transplantation. Technological advancements in cell viability, scaffold materials, and biocompatible membranes have improved efficacy and patient outcomes. Increasing awareness among clinicians and patients, along with supportive regulatory frameworks and ongoing clinical trials demonstrating safety and effectiveness, are further driving adoption of BAL systems globally, positioning this segment as a crucial component in the artificial liver technology market.

  • Bioreactor Technologies Segment is Expected to Witness Significant Growth Over the Forecast Period

The bioreactor technologies segment is projected to witness substantial growth due to their critical role in maintaining functional hepatocytes for artificial liver applications. Bioreactors provide controlled environments for cell culture, ensuring optimal oxygenation, nutrient supply, and waste removal, which are essential for sustaining liver-specific functions. Advancements in microfluidics, 3D scaffolding, and sensor integration have enhanced performance and reproducibility. Rising investments in research and development, growing demand for organ support devices, and increasing clinical applications in drug testing and transplantation support have further fueled market growth. The versatility of bioreactor systems across pharmaceutical, clinical, and research settings continues to drive their adoption globally.

  • Synthetic/Stem Cell Sources Segment is Expected to Witness Significant Growth Over the Forecast Period

The Synthetic/Stem-Cell Sources Segment is poised for significant growth during the forecast period due to its immense potential to create Bio-Artificial Liver (BAL) systems that truly mimic human liver functionality. Unlike systems relying on animal cells or simple mechanical filters, this segment leverages induced pluripotent stem cells (iPSCs) or other engineered cellular lines. These cells can be cultivated and differentiated into functional hepatocytes in vitro, offering a reproducible, scalable, and ethically sound cell source for BAL devices. This capability overcomes the traditional limitations of donor scarcity and immune rejection risks associated with using primary cells. As research successfully addresses challenges related to cell viability and functional maturity within bioreactors, the market will rapidly shift toward these advanced, synthetic cellular components to provide more effective and durable liver support solutions.

  • Chronic Liver Disease Management Segment is Expected to Witness Significant Growth Over the Forecast Period

The chronic liver disease management segment is expected to experience notable growth owing to the increasing global burden of liver disorders such as cirrhosis, hepatitis, and non-alcoholic fatty liver disease. Artificial liver technologies, including BAL systems and extracorporeal liver support devices, provide critical therapeutic support for patients awaiting transplantation or ineligible for surgery. Growing awareness among healthcare providers about early intervention strategies and improved clinical outcomes has accelerated adoption. Additionally, the rise in healthcare expenditure, availability of advanced liver monitoring tools, and ongoing government initiatives to address liver disease management contribute to the expansion of this market segment worldwide.

  • North American Region is Expected to Witness Significant Growth Over the Forecast Period

The North American artificial liver technology market is expected to witness significant growth due to the high prevalence of liver diseases, advanced healthcare infrastructure, and strong adoption of innovative medical technologies. The presence of leading market players, substantial investments in research and development, and supportive regulatory frameworks have facilitated rapid commercialization of artificial liver devices. For instance, in June 2025, United Therapeutics Corporation and Intermountain Health conducted the world’s first clinical trial using miroliverELAP, a bioengineered external liver assist device, on a liver failure patient ineligible for transplantation. Developed by Miromatrix Medical Inc., the system used a decellularized porcine liver scaffold infused with human cells. This milestone demonstrated significant progress in organ bioengineering, enhancing North America’s leadership and innovation in the bioartificial liver therapeutic technology market.

Additionally, growing awareness about liver health, increasing liver transplantation rates, and the rising geriatric population have fueled demand for artificial liver systems. Collaborations between biotech firms, research institutes, and hospitals continue to advance technology development, making North America a dominant region in the global artificial liver technology market.

Artificial Liver Technology Market Competitive Analysis

The competitive landscape of the artificial liver technology market is characterized by strategic collaborations, mergers, and acquisitions among key players to expand product portfolios and global reach. Companies focus on innovation, regulatory approvals, and partnerships with hospitals and research institutes to strengthen market positioning. Leading players compete on technological advancements, product efficacy, and clinical support services, driving rapid market growth and adoption worldwide.

The major players for above market are:

  • Vital Therapies, Inc.
  • CytoSorbents Corporation
  • Baxter International Inc.
  • Fresenius Medical Care AG & Co. KGaA
  • Nikkiso Co., Ltd.
  • Asahi Kasei Medical Co., Ltd.
  • Terumo Corporation
  • Medtronic plc
  • Toray Medical Co., Ltd.
  • Xenios AG
  • HepaLife Technologies, Inc.
  • OrganOx Ltd.
  • HepaWash GmbH
  • Mayo Clinic
  • Guangdong Qianhui Biotechnology Co., Ltd.
  • Shanghai CELLIVER Biotechnology Co., Ltd.
  • Shandong Yiruite Biotechnology Co., Ltd.
  • Guanhao Biotech Co., Ltd.
  • ALung Technologies, Inc.
  • MediWitness Inc.

Recent Development

  • In October 2025, A Japan-based team, led by Takanori Takebe, MD, PhD, developed the UTOpiA device using engineered liver tissue technology. The bioartificial liver system, detailed in the Journal of Hepatology, aimed to support patients with advanced liver failure. This innovation demonstrated significant potential to improve survival and bridge patients to transplantation, driving interest and adoption in the global bioartificial liver therapeutic technology market.


  • ​In August 2025, Researchers at the Wake Forest Institute for Regenerative Medicine (WFIRM) sent 3D bioprinted liver tissue constructs with vascular channels to the International Space Station via SpaceX’s 33rd CRS mission to study their behavior in microgravity. The investigation aimed to overcome Earth-based limitations in vascularization, maintaining tissue viability and function for longer periods. This advancement demonstrated potential for improved bioartificial liver systems, boosting innovation and growth in the global bioartificial liver therapeutic technology market.


Frequently Asked Questions (FAQ) :

Q1. What the main growth driving factors for this market?

The most significant driver is the alarming shortage of healthy donor livers available for transplantation, even as the global rate of acute and chronic liver failure continues to climb. Conditions like Hepatitis, non-alcoholic fatty liver disease (NAFLD), and alcohol-induced cirrhosis are increasing, creating a large patient pool in urgent need of temporary life support. Artificial liver technologies offer a crucial bridge-to-transplant solution, stabilizing patients until an organ becomes available, or even allowing the native liver time to recover, which is a massive demand driver.

Q2. What are the main restraining factors for this market?

The major hurdle is the extremely high cost associated with developing and manufacturing these complex systems, particularly Bio-Artificial Liver (BAL) devices. The technology itself is complex, demanding specialized infrastructure and highly trained personnel for operation. Additionally, the need for stringent regulatory approvals from bodies like the FDA, combined with the difficulty of conducting large-scale, definitive clinical trials for these life-saving, specialized devices, significantly slows down market entry and widespread adoption.

Q3. Which segment is expected to witness high growth?

The Bio-Artificial Liver (BAL) Systems segment is anticipated to witness the highest growth. Unlike purely mechanical detoxification systems, BAL systems incorporate living hepatocytes (liver cells), often derived from stem cells. This allows them to mimic the liver's crucial metabolic and synthetic functions, not just its clearance functions. Ongoing advancements in cell encapsulation and bioreactor design are rapidly improving the efficacy and lifespan of these functional models, attracting heavy research and commercial investment as the ultimate, most comprehensive solution.

Q4. Who are the top major players for this market?

The market is highly competitive and includes a mix of major medical device manufacturers and highly specialized biotech startups collaborating with academic research centers. Key commercial players include companies that specialize in blood purification and adsorption technologies, such as Asahi Kasei Medical Co., Ltd. (with its related products) and firms focused on liver dialysis like Baxter International Inc. through certain devices. Innovation is also heavily driven by institutions like Y-mAbs Therapeutics and numerous universities pioneering next-generation bio-artificial liver technology.

Q5. Which country is the largest player?

The United States is the largest country market for artificial liver technology. This dominance is due to a very high prevalence of end-stage liver disease, a substantial healthcare budget, and a robust environment for biotech research and development. The country benefits from extensive funding from organizations like the National Institutes of Health (NIH) and a strong venture capital ecosystem that rapidly supports the commercialization and clinical testing of cutting-edge liver support systems and bio-artificial liver devices.

Artificial Liver Technology MARKET STUDY GLOBAL MARKET ANALYSIS, INSIGHTS AND FORECAST, 2022-2029

    1. Introduction

    • 1.1. Research Scope
    • 1.2. Market Segmentation
    • 1.3. Research Methodology
    • 1.4. Definitions and Assumptions

    2. Executive Summary

      3. Market Dynamics

      • 3.1. Market Drivers
      • 3.2. Market Restraints
      • 3.3. Market Opportunities

      4. Key Insights

      • 4.1. Key Emerging Trends – For Major Countries
      • 4.2. Latest Technological Advancement
      • 4.3. Regulatory Landscape
      • 4.4. Industry SWOT Analysis
      • 4.5. Porters Five Forces Analysis

      5. Global Artificial Liver Technology Market Analysis (USD Billion), Insights and Forecast, 2018-2029

      • 5.1. Key Findings / Summary
      • 5.2. Market Analysis, Insights and Forecast – By Segment 1
        • 5.2.1. Sub-Segment 1
        • 5.2.2. Sub-Segment 2
      • 5.3. Market Analysis, Insights and Forecast – By Segment 2
        • 5.3.1. Sub-Segment 1
        • 5.3.2. Sub-Segment 2
        • 5.3.3. Sub-Segment 3
        • 5.3.4. Others
      • 5.4. Market Analysis, Insights and Forecast – By Segment 3
        • 5.4.1. Sub-Segment 1
        • 5.4.2. Sub-Segment 2
        • 5.4.3. Sub-Segment 3
        • 5.4.4. Others
      • 5.5. Market Analysis, Insights and Forecast – By Region
        • 5.5.1. North America
        • 5.5.2. Latin America
        • 5.5.3. Europe
        • 5.5.4. Asia Pacific
        • 5.5.5. Middle East and Africa

      6. North America Artificial Liver Technology Market Analysis (USD Billion), Insights and Forecast, 2018-2029

      • 6.1. Key Findings / Summary
      • 6.2. Market Analysis, Insights and Forecast – By Segment 1
        • 6.2.1. Sub-Segment 1
        • 6.2.2. Sub-Segment 2
      • 6.3. Market Analysis, Insights and Forecast – By Segment 2
        • 6.3.1. Sub-Segment 1
        • 6.3.2. Sub-Segment 2
        • 6.3.3. Sub-Segment 3
        • 6.3.4. Others
      • 6.4. Market Analysis, Insights and Forecast – By Segment 3
        • 6.4.1. Sub-Segment 1
        • 6.4.2. Sub-Segment 2
        • 6.4.3. Sub-Segment 3
        • 6.4.4. Others
      • 6.5. Market Analysis, Insights and Forecast – By Country
        • 6.5.1. U.S.
        • 6.5.2. Canada

      7. Latin America Artificial Liver Technology Market Analysis (USD Billion), Insights and Forecast, 2018-2029

      • 7.1. Key Findings / Summary
      • 7.2. Market Analysis, Insights and Forecast – By Segment 1
        • 7.2.1. Sub-Segment 1
        • 7.2.2. Sub-Segment 2
      • 7.3. Market Analysis, Insights and Forecast – By Segment 2
        • 7.3.1. Sub-Segment 1
        • 7.3.2. Sub-Segment 2
        • 7.3.3. Sub-Segment 3
        • 7.3.4. Others
      • 7.4. Market Analysis, Insights and Forecast – By Segment 3
        • 7.4.1. Sub-Segment 1
        • 7.4.2. Sub-Segment 2
        • 7.4.3. Sub-Segment 3
        • 7.4.4. Others
      • 7.5. Insights and Forecast – By Country
        • 7.5.1. Brazil
        • 7.5.2. Mexico
        • 7.5.3. Rest of Latin America

      8. Europe Artificial Liver Technology Market Analysis (USD Billion), Insights and Forecast, 2018-2029

      • 8.1. Key Findings / Summary
      • 8.2. Market Analysis, Insights and Forecast – By Segment 1
        • 8.2.1. Sub-Segment 1
        • 8.2.2. Sub-Segment 2
      • 8.3. Market Analysis, Insights and Forecast – By Segment 2
        • 8.3.1. Sub-Segment 1
        • 8.3.2. Sub-Segment 2
        • 8.3.3. Sub-Segment 3
        • 8.3.4. Others
      • 8.4. Market Analysis, Insights and Forecast – By Segment 3
        • 8.4.1. Sub-Segment 1
        • 8.4.2. Sub-Segment 2
        • 8.4.3. Sub-Segment 3
        • 8.4.4. Others
      • 8.5. Market Analysis, Insights and Forecast – By Country
        • 8.5.1. UK
        • 8.5.2. Germany
        • 8.5.3. France
        • 8.5.4. Italy
        • 8.5.5. Spain
        • 8.5.6. Russia
        • 8.5.7. Rest of Europe

      9. Asia Pacific Artificial Liver Technology Market Analysis (USD Billion), Insights and Forecast, 2018-2029

      • 9.1. Key Findings / Summary
      • 9.2. Market Analysis, Insights and Forecast – By Segment 1
        • 9.2.1. Sub-Segment 1
        • 9.2.2. Sub-Segment 2
      • 9.3. Market Analysis, Insights and Forecast – By Segment 2
        • 9.3.1. Sub-Segment 1
        • 9.3.2. Sub-Segment 2
        • 9.3.3. Sub-Segment 3
        • 9.3.4. Others
      • 9.4. Market Analysis, Insights and Forecast – By Segment 3
        • 9.4.1. Sub-Segment 1
        • 9.4.2. Sub-Segment 2
        • 9.4.3. Sub-Segment 3
        • 9.4.4. Others
      • 9.5. Market Analysis, Insights and Forecast – By Country
        • 9.5.1. China
        • 9.5.2. India
        • 9.5.3. Japan
        • 9.5.4. Australia
        • 9.5.5. South East Asia
        • 9.5.6. Rest of Asia Pacific

      10. Middle East & Africa Artificial Liver Technology Market Analysis (USD Billion), Insights and Forecast, 2018-2029

      • 10.1. Key Findings / Summary
      • 10.2. Market Analysis, Insights and Forecast – By Segment 1
        • 10.2.1. Sub-Segment 1
        • 10.2.2. Sub-Segment 2
      • 10.3. Market Analysis, Insights and Forecast – By Segment 2
        • 10.3.1. Sub-Segment 1
        • 10.3.2. Sub-Segment 2
        • 10.3.3. Sub-Segment 3
        • 10.3.4. Others
      • 10.4. Market Analysis, Insights and Forecast – By Segment 3
        • 10.4.1. Sub-Segment 1
        • 10.4.2. Sub-Segment 2
        • 10.4.3. Sub-Segment 3
        • 10.4.4. Others
      • 10.5. Market Analysis, Insights and Forecast – By Country
        • 10.5.1. GCC
        • 10.5.2. South Africa
        • 10.5.3. Rest of Middle East & Africa

      11. Competitive Analysis

      • 11.1. Company Market Share Analysis, 2018
      • 11.2. Key Industry Developments
      • 11.3. Company Profile
        • 11.3.1. Company 1
          • 11.3.1.1. Business Overview
          • 11.3.1.2. Segment 1 & Service Offering
          • 11.3.1.3. Overall Revenue
          • 11.3.1.4. Geographic Presence
          • 11.3.1.5. Recent Development
        *Similar details will be provided for the following companies
        • 11.3.2. Company 2
        • 11.3.3. Company 3
        • 11.3.4. Company 4
        • 11.3.5. Company 5
        • 11.3.6. Company 6
        • 11.3.7. Company 7
        • 11.3.8. Company 8
        • 11.3.9. Company 9
        • 11.3.10. Company 10
        • 11.3.11. Company 11
        • 11.3.12. Company 12
      List of Figures

      Figure 1: Global Artificial Liver Technology Market Revenue Breakdown (USD Billion, %) by Region, 2022 & 2029
      Figure 2: Global Artificial Liver Technology Market Value Share (%), By Segment 1, 2022 & 2029
      Figure 3: Global Artificial Liver Technology Market Forecast (USD Billion), by Sub-Segment 1, 2018-2029
      Figure 4: Global Artificial Liver Technology Market Forecast (USD Billion), by Sub-Segment 2, 2018-2029
      Figure 5: Global Artificial Liver Technology Market Value Share (%), By Segment 2, 2022 & 2029
      Figure 6: Global Artificial Liver Technology Market Forecast (USD Billion), by Sub-Segment 1, 2018-2029
      Figure 7: Global Artificial Liver Technology Market Forecast (USD Billion), by Sub-Segment 2, 2018-2029
      Figure 8: Global Artificial Liver Technology Market Forecast (USD Billion), by Sub-Segment 3, 2018-2029
      Figure 9: Global Artificial Liver Technology Market Forecast (USD Billion), by Others, 2018-2029
      Figure 10: Global Artificial Liver Technology Market Value Share (%), By Segment 3, 2022 & 2029
      Figure 11: Global Artificial Liver Technology Market Forecast (USD Billion), by Sub-Segment 1, 2018-2029
      Figure 12: Global Artificial Liver Technology Market Forecast (USD Billion), by Sub-Segment 2, 2018-2029
      Figure 13: Global Artificial Liver Technology Market Forecast (USD Billion), by Sub-Segment 3, 2018-2029
      Figure 14: Global Artificial Liver Technology Market Forecast (USD Billion), by Others, 2018-2029
      Figure 15: Global Artificial Liver Technology Market Value (USD Billion), by Region, 2022 & 2029
      Figure 16: North America Artificial Liver Technology Market Value Share (%), By Segment 1, 2022 & 2029
      Figure 17: North America Artificial Liver Technology Market Forecast (USD Billion), by Sub-Segment 1, 2018-2029
      Figure 18: North America Artificial Liver Technology Market Forecast (USD Billion), by Sub-Segment 2, 2018-2029
      Figure 19: North America Artificial Liver Technology Market Value Share (%), By Segment 2, 2022 & 2029
      Figure 20: North America Artificial Liver Technology Market Forecast (USD Billion), by Sub-Segment 1, 2018-2029
      Figure 21: North America Artificial Liver Technology Market Forecast (USD Billion), by Sub-Segment 2, 2018-2029
      Figure 22: North America Artificial Liver Technology Market Forecast (USD Billion), by Sub-Segment 3, 2018-2029
      Figure 23: North America Artificial Liver Technology Market Forecast (USD Billion), by Others, 2018-2029
      Figure 24: North America Artificial Liver Technology Market Value Share (%), By Segment 3, 2022 & 2029
      Figure 25: North America Artificial Liver Technology Market Forecast (USD Billion), by Sub-Segment 1, 2018-2029
      Figure 26: North America Artificial Liver Technology Market Forecast (USD Billion), by Sub-Segment 2, 2018-2029
      Figure 27: North America Artificial Liver Technology Market Forecast (USD Billion), by Sub-Segment 3, 2018-2029
      Figure 28: North America Artificial Liver Technology Market Forecast (USD Billion), by Others, 2018-2029
      Figure 29: North America Artificial Liver Technology Market Forecast (USD Billion), by U.S., 2018-2029
      Figure 30: North America Artificial Liver Technology Market Forecast (USD Billion), by Canada, 2018-2029
      Figure 31: Latin America Artificial Liver Technology Market Value Share (%), By Segment 1, 2022 & 2029
      Figure 32: Latin America Artificial Liver Technology Market Forecast (USD Billion), by Sub-Segment 1, 2018-2029
      Figure 33: Latin America Artificial Liver Technology Market Forecast (USD Billion), by Sub-Segment 2, 2018-2029
      Figure 34: Latin America Artificial Liver Technology Market Value Share (%), By Segment 2, 2022 & 2029
      Figure 35: Latin America Artificial Liver Technology Market Forecast (USD Billion), by Sub-Segment 1, 2018-2029
      Figure 36: Latin America Artificial Liver Technology Market Forecast (USD Billion), by Sub-Segment 2, 2018-2029
      Figure 37: Latin America Artificial Liver Technology Market Forecast (USD Billion), by Sub-Segment 3, 2018-2029
      Figure 38: Latin America Artificial Liver Technology Market Forecast (USD Billion), by Others, 2018-2029
      Figure 39: Latin America Artificial Liver Technology Market Value Share (%), By Segment 3, 2022 & 2029
      Figure 40: Latin America Artificial Liver Technology Market Forecast (USD Billion), by Sub-Segment 1, 2018-2029
      Figure 41: Latin America Artificial Liver Technology Market Forecast (USD Billion), by Sub-Segment 2, 2018-2029
      Figure 42: Latin America Artificial Liver Technology Market Forecast (USD Billion), by Sub-Segment 3, 2018-2029
      Figure 43: Latin America Artificial Liver Technology Market Forecast (USD Billion), by Others, 2018-2029
      Figure 44: Latin America Artificial Liver Technology Market Forecast (USD Billion), by Brazil, 2018-2029
      Figure 45: Latin America Artificial Liver Technology Market Forecast (USD Billion), by Mexico, 2018-2029
      Figure 46: Latin America Artificial Liver Technology Market Forecast (USD Billion), by Rest of Latin America, 2018-2029
      Figure 47: Europe Artificial Liver Technology Market Value Share (%), By Segment 1, 2022 & 2029
      Figure 48: Europe Artificial Liver Technology Market Forecast (USD Billion), by Sub-Segment 1, 2018-2029
      Figure 49: Europe Artificial Liver Technology Market Forecast (USD Billion), by Sub-Segment 2, 2018-2029
      Figure 50: Europe Artificial Liver Technology Market Value Share (%), By Segment 2, 2022 & 2029
      Figure 51: Europe Artificial Liver Technology Market Forecast (USD Billion), by Sub-Segment 1, 2018-2029
      Figure 52: Europe Artificial Liver Technology Market Forecast (USD Billion), by Sub-Segment 2, 2018-2029
      Figure 53: Europe Artificial Liver Technology Market Forecast (USD Billion), by Sub-Segment 3, 2018-2029
      Figure 54: Europe Artificial Liver Technology Market Forecast (USD Billion), by Others, 2018-2029
      Figure 55: Europe Artificial Liver Technology Market Value Share (%), By Segment 3, 2022 & 2029
      Figure 56: Europe Artificial Liver Technology Market Forecast (USD Billion), by Sub-Segment 1, 2018-2029
      Figure 57: Europe Artificial Liver Technology Market Forecast (USD Billion), by Sub-Segment 2, 2018-2029
      Figure 58: Europe Artificial Liver Technology Market Forecast (USD Billion), by Sub-Segment 3, 2018-2029
      Figure 59: Europe Artificial Liver Technology Market Forecast (USD Billion), by Others, 2018-2029
      Figure 60: Europe Artificial Liver Technology Market Forecast (USD Billion), by U.K., 2018-2029
      Figure 61: Europe Artificial Liver Technology Market Forecast (USD Billion), by Germany, 2018-2029
      Figure 62: Europe Artificial Liver Technology Market Forecast (USD Billion), by France, 2018-2029
      Figure 63: Europe Artificial Liver Technology Market Forecast (USD Billion), by Italy, 2018-2029
      Figure 64: Europe Artificial Liver Technology Market Forecast (USD Billion), by Spain, 2018-2029
      Figure 65: Europe Artificial Liver Technology Market Forecast (USD Billion), by Russia, 2018-2029
      Figure 66: Europe Artificial Liver Technology Market Forecast (USD Billion), by Rest of Europe, 2018-2029
      Figure 67: Asia Pacific Artificial Liver Technology Market Value Share (%), By Segment 1, 2022 & 2029
      Figure 68: Asia Pacific Artificial Liver Technology Market Forecast (USD Billion), by Sub-Segment 1, 2018-2029
      Figure 69: Asia Pacific Artificial Liver Technology Market Forecast (USD Billion), by Sub-Segment 2, 2018-2029
      Figure 70: Asia Pacific Artificial Liver Technology Market Value Share (%), By Segment 2, 2022 & 2029
      Figure 71: Asia Pacific Artificial Liver Technology Market Forecast (USD Billion), by Sub-Segment 1, 2018-2029
      Figure 72: Asia Pacific Artificial Liver Technology Market Forecast (USD Billion), by Sub-Segment 2, 2018-2029
      Figure 73: Asia Pacific Artificial Liver Technology Market Forecast (USD Billion), by Sub-Segment 3, 2018-2029
      Figure 74: Asia Pacific Artificial Liver Technology Market Forecast (USD Billion), by Others, 2018-2029
      Figure 75: Asia Pacific Artificial Liver Technology Market Value Share (%), By Segment 3, 2022 & 2029
      Figure 76: Asia Pacific Artificial Liver Technology Market Forecast (USD Billion), by Sub-Segment 1, 2018-2029
      Figure 77: Asia Pacific Artificial Liver Technology Market Forecast (USD Billion), by Sub-Segment 2, 2018-2029
      Figure 78: Asia Pacific Artificial Liver Technology Market Forecast (USD Billion), by Sub-Segment 3, 2018-2029
      Figure 79: Asia Pacific Artificial Liver Technology Market Forecast (USD Billion), by Others, 2018-2029
      Figure 80: Asia Pacific Artificial Liver Technology Market Forecast (USD Billion), by China, 2018-2029
      Figure 81: Asia Pacific Artificial Liver Technology Market Forecast (USD Billion), by India, 2018-2029
      Figure 82: Asia Pacific Artificial Liver Technology Market Forecast (USD Billion), by Japan, 2018-2029
      Figure 83: Asia Pacific Artificial Liver Technology Market Forecast (USD Billion), by Australia, 2018-2029
      Figure 84: Asia Pacific Artificial Liver Technology Market Forecast (USD Billion), by Southeast Asia, 2018-2029
      Figure 85: Asia Pacific Artificial Liver Technology Market Forecast (USD Billion), by Rest of Asia Pacific, 2018-2029
      Figure 86: Middle East & Africa Artificial Liver Technology Market Value Share (%), By Segment 1, 2022 & 2029
      Figure 87: Middle East & Africa Artificial Liver Technology Market Forecast (USD Billion), by Sub-Segment 1, 2018-2029
      Figure 88: Middle East & Africa Artificial Liver Technology Market Forecast (USD Billion), by Sub-Segment 2, 2018-2029
      Figure 89: Middle East & Africa Artificial Liver Technology Market Value Share (%), By Segment 2, 2022 & 2029
      Figure 90: Middle East & Africa Artificial Liver Technology Market Forecast (USD Billion), by Sub-Segment 1, 2018-2029
      Figure 91: Middle East & Africa Artificial Liver Technology Market Forecast (USD Billion), by Sub-Segment 2, 2018-2029
      Figure 92: Middle East & Africa Artificial Liver Technology Market Forecast (USD Billion), by Sub-Segment 3, 2018-2029
      Figure 93: Middle East & Africa Artificial Liver Technology Market Forecast (USD Billion), by Others, 2018-2029
      Figure 94: Middle East & Africa Artificial Liver Technology Market Value Share (%), By Segment 3, 2022 & 2029
      Figure 95: Middle East & Africa Artificial Liver Technology Market Forecast (USD Billion), by Sub-Segment 1, 2018-2029
      Figure 96: Middle East & Africa Artificial Liver Technology Market Forecast (USD Billion), by Sub-Segment 2, 2018-2029
      Figure 97: Middle East & Africa Artificial Liver Technology Market Forecast (USD Billion), by Sub-Segment 3, 2018-2029
      Figure 98: Middle East & Africa Artificial Liver Technology Market Forecast (USD Billion), by Others, 2018-2029
      Figure 99: Middle East & Africa Artificial Liver Technology Market Forecast (USD Billion), by GCC, 2018-2029
      Figure 100: Middle East & Africa Artificial Liver Technology Market Forecast (USD Billion), by South Africa, 2018-2029
      Figure 101: Middle East & Africa Artificial Liver Technology Market Forecast (USD Billion), by Rest of Middle East & Africa, 2018-2029 
      List of Tables
      Table 1: Global Artificial Liver Technology Market Revenue (USD Billion) Forecast, by Segment 1, 2018-2029
      Table 2: Global Artificial Liver Technology Market Revenue (USD Billion) Forecast, by Segment 2, 2018-2029
      Table 3: Global Artificial Liver Technology Market Revenue (USD Billion) Forecast, by Segment 3, 2018-2029
      Table 4: Global Artificial Liver Technology Market Revenue (USD Billion) Forecast, by Region, 2018-2029
      Table 5: North America Artificial Liver Technology Market Revenue (USD Billion) Forecast, by Segment 1, 2018-2029
      Table 6: North America Artificial Liver Technology Market Revenue (USD Billion) Forecast, by Segment 2, 2018-2029
      Table 7: North America Artificial Liver Technology Market Revenue (USD Billion) Forecast, by Segment 3, 2018-2029
      Table 8: North America Artificial Liver Technology Market Revenue (USD Billion) Forecast, by Country, 2018-2029
      Table 9: Europe Artificial Liver Technology Market Revenue (USD Billion) Forecast, by Segment 1, 2018-2029
      Table 10: Europe Artificial Liver Technology Market Revenue (USD Billion) Forecast, by Segment 2, 2018-2029
      Table 11: Europe Artificial Liver Technology Market Revenue (USD Billion) Forecast, by Segment 3, 2018-2029
      Table 12: Europe Artificial Liver Technology Market Revenue (USD Billion) Forecast, by Country, 2018-2029
      Table 13: Latin America Artificial Liver Technology Market Revenue (USD Billion) Forecast, by Segment 1, 2018-2029
      Table 14: Latin America Artificial Liver Technology Market Revenue (USD Billion) Forecast, by Segment 2, 2018-2029
      Table 15: Latin America Artificial Liver Technology Market Revenue (USD Billion) Forecast, by Segment 3, 2018-2029
      Table 16: Latin America Artificial Liver Technology Market Revenue (USD Billion) Forecast, by Country, 2018-2029
      Table 17: Asia Pacific Artificial Liver Technology Market Revenue (USD Billion) Forecast, by Segment 1, 2018-2029
      Table 18: Asia Pacific Artificial Liver Technology Market Revenue (USD Billion) Forecast, by Segment 2, 2018-2029
      Table 19: Asia Pacific Artificial Liver Technology Market Revenue (USD Billion) Forecast, by Segment 3, 2018-2029
      Table 20: Asia Pacific Artificial Liver Technology Market Revenue (USD Billion) Forecast, by Country, 2018-2029
      Table 21: Middle East & Africa Artificial Liver Technology Market Revenue (USD Billion) Forecast, by Segment 1, 2018-2029
      Table 22: Middle East & Africa Artificial Liver Technology Market Revenue (USD Billion) Forecast, by Segment 2, 2018-2029
      Table 23: Middle East & Africa Artificial Liver Technology Market Revenue (USD Billion) Forecast, by Segment 3, 2018-2029
      Table 24: Middle East & Africa Artificial Liver Technology Market Revenue (USD Billion) Forecast, by Country, 2018-2029
      Research Process

      Data Library Research are conducted by industry experts who offer insight on industry structure, market segmentations technology assessment and competitive landscape (CL), and penetration, as well as on emerging trends. Their analysis is based on primary interviews (~ 80%) and secondary research (~ 20%) as well as years of professional expertise in their respective industries. Adding to this, by analysing historical trends and current market positions, our analysts predict where the market will be headed for the next five years. Furthermore, the varying trends of segment & categories geographically presented are also studied and the estimated based on the primary & secondary research.

      In this particular report from the supply side Data Library Research has conducted primary surveys (interviews) with the key level executives (VP, CEO’s, Marketing Director, Business Development Manager and SOFT) of the companies that active & prominent as well as the midsized organization

      FIGURE 1: DLR RESEARH PROCESS

      research-methodology1

      Primary Research

      Extensive primary research was conducted to gain a deeper insight of the market and industry performance. The analysis is based on both primary and secondary research as well as years of professional expertise in the respective industries.

      In addition to analysing current and historical trends, our analysts predict where the market is headed over the next five years.

      It varies by segment for these categories geographically presented in the list of market tables. Speaking about this particular report we have conducted primary surveys (interviews) with the key level executives (VP, CEO’s, Marketing Director, Business Development Manager and many more) of the major players active in the market.

      Secondary Research

      Secondary research was mainly used to collect and identify information useful for the extensive, technical, market-oriented, and Friend’s study of the Global Extra Neutral Alcohol. It was also used to obtain key information about major players, market classification and segmentation according to the industry trends, geographical markets, and developments related to the market and technology perspectives. For this study, analysts have gathered information from various credible sources, such as annual reports, sec filings, journals, white papers, SOFT presentations, and company web sites.

      Market Size Estimation

      Both, top-down and bottom-up approaches were used to estimate and validate the size of the Global market and to estimate the size of various other dependent submarkets in the overall Extra Neutral Alcohol. The key players in the market were identified through secondary research and their market contributions in the respective geographies were determined through primary and secondary research.

      Forecast Model

      research-methodology2