Get Complete Analysis Of The Report - Download Updated Free Sample PDF
The global medical imaging market encompasses technologies and devices used to visualize the interior of the human body for diagnostic, monitoring, and treatment purposes. It includes modalities such as X-ray, MRI, CT, ultrasound, and nuclear imaging, enabling early disease detection, accurate diagnosis, and improved patient outcomes. The market is driven by rising prevalence of chronic diseases, technological advancements, increasing healthcare expenditure, and growing demand for non-invasive diagnostic solutions across hospitals, diagnostic centers, and research institutions worldwide.
The global medical imaging market has been witnessing rapid technological advancements, including AI integration, 3D imaging, and portable imaging devices, enhancing diagnostic accuracy and efficiency. There is a growing shift toward non-invasive, patient-friendly procedures and point-of-care imaging solutions. Additionally, cloud-based platforms and telemedicine adoption are enabling remote diagnostics, while rising demand for early disease detection, personalized treatment, and hybrid imaging systems, such as PET/CT and PET/MRI, continues to shape industry trends globally.
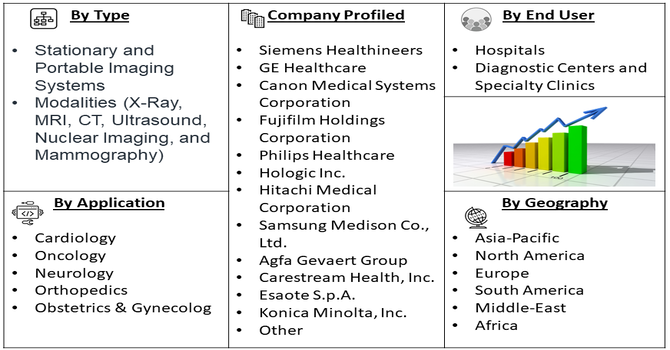
Segmentation: The Global Medical Imaging Market is Segmented by Product Type (Stationary and Portable Imaging Systems), Modalities (X-Ray, MRI, CT, Ultrasound, Nuclear Imaging, and Mammography), Applications (Cardiology, Oncology, Neurology, Orthopedics, and Obstetrics & Gynecology), End-Users (Hospitals, Diagnostic Centers, and Specialty Clinics) and Geography (North America, Europe, Asia-Pacific, Middle East and Africa, and South America). The report provides the value (in USD million) for the above segments.
For Detailed Market Segmentation - Get a Free Sample PDF
Market Drivers:
The global biomedical imaging technology market has been significantly driven by rapid technological advancements in imaging modalities such as MRI, CT, PET, and ultrasound systems. Innovations like 3D and 4D imaging, AI-powered image analysis, and hybrid imaging systems have enhanced diagnostic accuracy, reduced examination time, and improved patient outcomes. These advancements allow earlier disease detection, precise treatment planning, and personalized patient care, driving adoption in hospitals, diagnostic centers, and research institutions. Furthermore, integration with digital platforms and cloud-based solutions enables remote diagnostics and telemedicine applications. Continuous R&D investments by major companies further fuel innovation, creating a strong demand for advanced biomedical imaging technologies worldwide.
The increasing global prevalence of chronic diseases such as cancer, cardiovascular disorders, and neurological conditions has boosted the demand for biomedical imaging technologies. Early detection and monitoring of these diseases rely heavily on high-resolution imaging systems, driving hospitals and diagnostic centers to adopt state-of-the-art imaging equipment. Additionally, the aging global population contributes to higher incidences of age-related illnesses, further escalating demand. Preventive healthcare initiatives and government programs promoting early diagnosis have also supported the market. As patient awareness grows, healthcare providers increasingly utilize biomedical imaging for timely intervention, treatment planning, and follow-up, creating a steady and growing demand for advanced imaging solutions across the globe.
Market Restraints:
Despite the benefits, the high cost of biomedical imaging equipment remains a significant market restraint. Advanced imaging systems such as MRI, PET-CT, and hybrid modalities require substantial capital investment, making them less accessible for small clinics and developing regions. Additionally, recurring maintenance, software updates, and skilled personnel training add to operational expenses, limiting adoption. High costs can delay procurement and reduce the affordability of imaging services for patients, especially in low- and middle-income countries. Budget constraints in public hospitals and insufficient reimbursement policies further exacerbate the challenge, restraining the widespread deployment of biomedical imaging technologies and slowing market growth in certain regions.
The global biomedical imaging technology market has a significant socioeconomic impact by enhancing healthcare quality, accessibility, and efficiency. Advanced imaging systems enable early disease detection, precise diagnosis, and effective treatment planning, reducing morbidity and mortality rates, particularly for chronic and life-threatening conditions like cancer, cardiovascular, and neurological disorders. This improves workforce productivity and reduces long-term healthcare costs. The market also drives employment in manufacturing, R&D, healthcare services, and technical support sectors, fostering economic growth. Additionally, the adoption of imaging technologies in emerging economies enhances healthcare equity, bridging gaps in medical diagnostics. Thus, biomedical imaging contributes to improved public health, economic productivity, and technological development, positively influencing societies worldwide.
Segmental Analysis:
The portable imaging systems segment is expected to witness the highest growth over the forecast period due to rising demand for flexible, on-site diagnostic solutions in hospitals, clinics, and emergency care settings. These systems offer mobility, rapid deployment, and point-of-care imaging capabilities, which are particularly valuable during emergencies, remote medical missions, and home healthcare services. Technological advancements, including compact X-ray, ultrasound, and MRI devices, have enhanced image quality while reducing operational costs. The growing geriatric population and increasing prevalence of chronic diseases further drive adoption.
The mammography segment is projected to experience significant growth over the forecast period due to the rising prevalence of breast cancer and increasing awareness of early detection practices. Advancements in digital mammography, 3D tomosynthesis, and AI-assisted imaging have improved diagnostic accuracy and patient comfort, further boosting adoption. Screening programs and government initiatives aimed at early breast cancer detection have expanded access to mammography services worldwide. Moreover, growing female population demographics and increasing healthcare expenditure in both developed and emerging economies contribute to higher demand. Hospitals, diagnostic centers, and specialized oncology clinics are increasingly investing in advanced mammography systems to ensure timely diagnosis and treatment, positioning this segment as a critical component of the global biomedical imaging technology market.
The oncology segment is expected to witness substantial growth over the forecast period, driven by the rising incidence of cancer globally and the increasing need for precise diagnosis and treatment planning. Advanced imaging modalities such as PET, CT, and MRI play a vital role in detecting tumors, assessing disease progression, and monitoring treatment response. Integration of AI and machine learning enhances image interpretation, enabling personalized treatment strategies. Additionally, expanding cancer care infrastructure, government initiatives for early detection, and growing investments in oncology research further propel the segment.
North America is expected to witness the highest growth in the global biomedical imaging technology market due to the region’s well-established healthcare infrastructure, high adoption of advanced imaging systems, and substantial healthcare expenditure.
Technological innovations, including AI-assisted diagnostics, portable imaging, and minimally invasive imaging modalities, have improved the quality and efficiency of medical services. For instance, in 2025, Yale School of Medicine (YSM) established the Yale Biomedical Imaging Institute, uniting leading experts in imaging technology, clinical applications, and data science across the university. As one of the few such centers nationwide, the institute aimed to drive innovation in biomedical imaging, advancing both fundamental research and clinical translation. This initiative is expected to accelerate the development of cutting-edge imaging solutions in the U.S., enhancing diagnostic capabilities, fostering commercialization of advanced imaging technologies, and strengthening the country’s leadership in the biomedical imaging technology market.
The presence of major biomedical imaging manufacturers, strong R&D investments, and favorable reimbursement policies further support market growth. Additionally, increasing prevalence of chronic diseases, such as cancer and cardiovascular disorders, drives demand for accurate and timely imaging solutions. Collectively, these factors position North America as a leading regional market for biomedical imaging technologies worldwide.
| Report Matrics | Details |
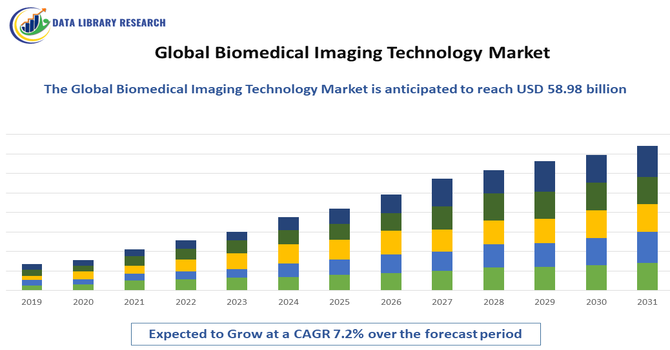
| Market Size Value | USD 58.98 billion |
| Growth Rate | CAGR of 7.2% |
| Forecast | 2026-2033 |
| Historical data | 2021-2024 |
| Base Year | 2025 |
| Report Coverage | Forecasted revenue, company rating, competitive environment, growth drivers, and trends |
| Segment Coverage | Type, Application, End-User, Geography |
| Regional Scope | North America, Europe, Asia Pacific, Middle East |
| Customized scope | Free customization of reports (With 3 months Analysis Support ) |
| To Learn More About This Report | Request a Free Sample Copy |
The global biomedical imaging technology market is highly competitive, characterized by the presence of several established multinational companies and emerging players focusing on innovation and strategic collaborations. Key companies compete through product launches, technological advancements, mergers and acquisitions, and expansion into emerging markets to strengthen their global footprint. Continuous investment in research and development has led to innovations such as AI-assisted imaging, portable diagnostic devices, and advanced modalities like 3D mammography and hybrid PET/MRI systems. Partnerships with hospitals, diagnostic centers, and research institutions further enhance market reach. This dynamic competitive landscape drives technological evolution, improves diagnostic accuracy, and intensifies market rivalry, benefiting healthcare providers and patients worldwide.
The 20 major players for above market are:
Recent Development
Q1. What are the main growth-driving factors for this market?
The market is strongly driven by the accelerating demand for precision medicine and the push to integrate Artificial Intelligence (AI) into image analysis for faster, more accurate diagnostics. Advanced imaging is now essential in clinical trials to monitor drug efficacy and accelerate regulatory approvals, especially in complex therapeutic areas like oncology and neurology. The adoption of multi-modal imaging (e.g., PET/MRI) and cloud-based platforms also increases accessibility and scalability across different clinical settings globally.
Q2. What are the main restraining factors for this market?
A chief restraint is the high cost associated with advanced imaging modalities and their subsequent implementation and maintenance. Furthermore, the market faces significant challenges related to data governance, privacy, and standardization. Ensuring data integrity, maintaining compliance with regulations like HIPAA and GDPR, and overcoming issues with fragmented, unstructured data stored across disparate systems remain substantial hurdles that complicate data integration and limit the effective use of AI for analysis.
Q3. Which segment is expected to witness high growth?
The AI-enabled Image Analysis and Software segment is projected to witness the highest growth. This software, which uses machine learning to enhance image interpretation, offers benefits like faster review times and reduced variability between readers, driving research sponsors toward these platforms. By modality, Computed Tomography (CT) currently holds the largest revenue share due to its high speed, widespread availability, and versatility across numerous therapeutic areas, including trauma and oncology.
Q4. Who are the top major players for this market?
The global market is dominated by major medical technology and imaging equipment manufacturers. Key players include industry giants like GE HealthCare, Siemens Healthineers, and Koninklijke Philips N.V. Additionally, technology companies providing the analytical backbone, such as Optum (UnitedHealth Group), IQVIA, and Oracle, are crucial. These firms drive market competition through continuous R&D investment in hybrid systems, quantum-assisted reconstruction, and FDA-cleared AI tools.
Q5. Which country is the largest player?
North America, with the United States as the primary driver, consistently holds the largest market share by revenue. This dominance is a result of robust investment in pharmaceutical and biotechnology research, a mature healthcare infrastructure, and the early, widespread adoption of advanced imaging modalities in clinical trials and diagnostic practice. The strong regulatory support for quantitative imaging endpoints further reinforces the U.S.'s position as a global leader in clinical trial imaging innovation.
Data Library Research are conducted by industry experts who offer insight on industry structure, market segmentations technology assessment and competitive landscape (CL), and penetration, as well as on emerging trends. Their analysis is based on primary interviews (~ 80%) and secondary research (~ 20%) as well as years of professional expertise in their respective industries. Adding to this, by analysing historical trends and current market positions, our analysts predict where the market will be headed for the next five years. Furthermore, the varying trends of segment & categories geographically presented are also studied and the estimated based on the primary & secondary research.
In this particular report from the supply side Data Library Research has conducted primary surveys (interviews) with the key level executives (VP, CEO’s, Marketing Director, Business Development Manager and SOFT) of the companies that active & prominent as well as the midsized organization
FIGURE 1: DLR RESEARH PROCESS
Extensive primary research was conducted to gain a deeper insight of the market and industry performance. The analysis is based on both primary and secondary research as well as years of professional expertise in the respective industries.
In addition to analysing current and historical trends, our analysts predict where the market is headed over the next five years.
It varies by segment for these categories geographically presented in the list of market tables. Speaking about this particular report we have conducted primary surveys (interviews) with the key level executives (VP, CEO’s, Marketing Director, Business Development Manager and many more) of the major players active in the market.
Secondary ResearchSecondary research was mainly used to collect and identify information useful for the extensive, technical, market-oriented, and Friend’s study of the Global Extra Neutral Alcohol. It was also used to obtain key information about major players, market classification and segmentation according to the industry trends, geographical markets, and developments related to the market and technology perspectives. For this study, analysts have gathered information from various credible sources, such as annual reports, sec filings, journals, white papers, SOFT presentations, and company web sites.
Market Size EstimationBoth, top-down and bottom-up approaches were used to estimate and validate the size of the Global market and to estimate the size of various other dependent submarkets in the overall Extra Neutral Alcohol. The key players in the market were identified through secondary research and their market contributions in the respective geographies were determined through primary and secondary research.
Forecast Model