Building Integrated Photovoltaic Module Market Overview and Analysis:
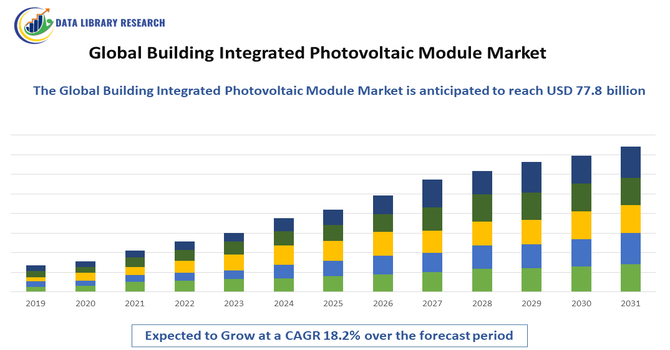
- The Global BIPV Module Market, valued at approximately USD 22.8 billion in 2025, is forecasted to grow rapidly to over USD 77.8 billion by 2032. This expansion is driven by a Compound Annual Growth Rate (CAGR) of around 18.2% during the forecast period,2025-2032, reflecting the global demand for sustainable, net-zero energy buildings.
Get Complete Analysis Of The Report - Download Updated Free Sample PDF
The Global Building Integrated Photovoltaic (BIPV) Module Market is experiencing strong growth driven by increasing adoption of renewable energy solutions within the construction sector and rising demand for energy-efficient building materials. Growing emphasis on sustainable architecture, government incentives promoting solar integration, and the need to reduce electricity costs are accelerating market expansion. Additionally, advancements in photovoltaic technologies, aesthetic solar designs, and the growing trend of net-zero energy buildings are further propelling the widespread use of BIPV modules across commercial, residential, and industrial structures.
Building Integrated Photovoltaic Module Market Latest Trends:
The Global Building Integrated Photovoltaic (BIPV) Module Market is witnessing several emerging trends, including a strong shift toward aesthetically appealing solar solutions such as colored, semi-transparent, and flexible PV modules designed to blend seamlessly with modern architecture. There is growing adoption of next-generation technologies like perovskite and thin-film BIPV, which offer higher efficiency, lightweight design, and improved performance in low-light conditions. Integration of smart energy management systems, IoT-enabled monitoring, and advanced façade engineering is also becoming more prevalent.
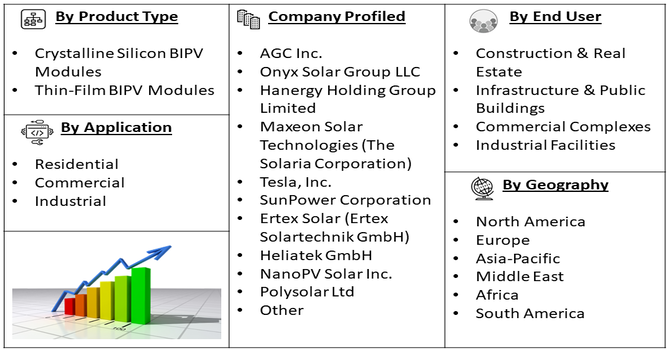
Segmentation: Global Building Integrated Photovoltaic Module Market is segmented By Module Type (Crystalline Silicon BIPV Modules, and Thin-Film BIPV Modules), Application (Residential, Commercial, and Industrial), Installation Type (Rooftop BIPV, Façade BIPV, Skylight & Window BIPV), End-Use Industry (Construction & Real Estate, Infrastructure & Public Buildings, Commercial Complexes, Industrial Facilities), and Geography (North America, Europe, Asia-Pacific, Middle East and Africa, and South America). The report provides the value (in USD million) for the above segments.
For Detailed Market Segmentation - Get a Free Sample PDF
Market Drivers:
- Growing Demand for Energy-Efficient and Sustainable Buildings
A major driver of the Global Building Integrated Photovoltaic (BIPV) Module Market is the increasing focus on energy-efficient and sustainable construction. Governments and regulatory bodies worldwide are promoting green building initiatives and setting stringent energy consumption standards, encouraging the integration of renewable energy technologies into building designs.
In July 2025, Mitrex’s SunRise Residential project, featuring the world’s largest solar panel mural, highlights the growing impact of BIPV on the global market. Showcasing innovative solar integration and sustainable design, it underscores rising demand for energy-efficient buildings, accelerating adoption of Building-Integrated Photovoltaic modules worldwide. This dual functionality—energy generation and construction material—makes BIPV an attractive solution for both new constructions and retrofits, driving market adoption across residential, commercial, and industrial sectors.
- Government Incentives and Support for Solar Energy Adoption
Another key driver is the supportive policy environment and financial incentives provided by governments to encourage solar energy deployment. Subsidies, tax credits, feed-in tariffs, and renewable energy mandates make BIPV modules more economically viable for developers, architects, and building owners. These incentives reduce the payback period for solar investments and accelerate adoption in both developed and emerging markets. Additionally, rising awareness about environmental sustainability and carbon footprint reduction further encourages the use of BIPV systems, contributing to consistent growth in the market over the forecast period.
Market Restraints:
- High Initial Installation Costs
A significant restraint for the Global Building Integrated Photovoltaic (BIPV) Module Market is the high upfront cost associated with these systems. Unlike conventional construction materials or standard rooftop solar panels, BIPV modules require specialized design, manufacturing, and integration into the building envelope. This includes costs related to customized module fabrication, structural engineering, installation expertise, and electrical integration. The higher initial investment can be a barrier, particularly for residential projects and small-scale developers, limiting widespread adoption despite the long-term energy savings and environmental benefits offered by BIPV systems.
Socioeconomic Impact on Building Integrated Photovoltaic Module Market
The global Building Integrated Photovoltaic (BIPV) module market has meaningful socioeconomic impact worldwide. By enabling buildings to generate their own electricity, BIPV reduces dependence on external power supply—lowering energy bills for homeowners, businesses, and institutions. This energy self sufficiency promotes resilience in areas with unreliable grids or rising electricity costs, improving living standards and business viability. Widespread BIPV adoption also contributes to reduced greenhouse gas emissions and environmental pollution, advancing sustainability and public health.
Moreover, integrating photovoltaic modules into building construction stimulates green jobs in manufacturing, installation, and maintenance, and raises property values — offering long term economic growth and encouraging investment in renewable infrastructure.
Segmental Analysis:
- Crystalline Silicon BIPV Modules segment is expected to witness the highest growth over the forecast period
Crystalline silicon BIPV modules are widely used due to their high energy conversion efficiency, durability, and proven reliability. These modules are preferred in applications where maximum electricity generation is required, making them suitable for large-scale commercial and residential buildings that aim to optimize energy production while integrating solar technology into the building envelope.
- Façade BIPV segment is expected to witness the highest growth over the forecast period
Façade-integrated BIPV is gaining traction due to its dual functionality of energy generation and architectural enhancement. These systems allow buildings to utilize vertical surfaces for solar power without compromising design aesthetics, making them particularly popular in urban environments with limited rooftop space.
- Commercial segment is expected to witness the highest growth over the forecast period
The commercial segment is anticipated to witness the highest growth in the global Building Integrated Photovoltaic (BIPV) Module Market over the forecast period. Increasing demand for sustainable and energy-efficient infrastructure in offices, retail spaces, and industrial complexes is driving adoption. Businesses are focusing on reducing operational energy costs while meeting green building standards and corporate sustainability goals.
BIPV modules offer an attractive solution by integrating seamlessly into building facades, rooftops, and skylights without compromising aesthetics. Moreover, government incentives, favorable policies, and rising awareness of renewable energy benefits further encourage commercial developers to invest in BIPV technology. As a result, the commercial sector is expected to lead market growth, shaping the future of solar-integrated architecture globally.
- Construction & Real Estate segment is expected to witness the highest growth over the forecast period
The construction and real estate industry is adopting BIPV solutions to meet increasing demand for green buildings and energy-efficient construction. Incorporating BIPV modules during the design and construction phase adds value to buildings by reducing energy costs, improving sustainability credentials, and complying with regulatory standards.
- Asia-Pacific region is expected to witness the highest growth over the forecast period
The Asia-Pacific region is projected to experience the highest growth in the Global Building Integrated Photovoltaic (BIPV) Module Market over the forecast period. Rapid urbanization, increasing government initiatives promoting renewable energy, and rising awareness about sustainable building practices are driving this growth.
Countries such as China, Japan, and India are investing heavily in green infrastructure, integrating photovoltaic technologies into residential, commercial, and industrial buildings. For instance, in 2025, Japanese startup Monochrome Co., Ltd.’s launch of a silver-colored BIPV panel enhances design versatility in the Roof-1 series, catering to architects’ aesthetic demands. This innovation is expected to boost the Asia-Pacific BIPV market by promoting wider adoption in commercial and residential projects, combining energy efficiency with visually appealing, customizable building facades.
Additionally, declining costs of solar modules and advancements in BIPV technologies are making adoption more feasible for developers and architects. The region’s strong focus on reducing carbon emissions and achieving energy efficiency targets further supports market expansion, positioning Asia-Pacific as a key hub for the adoption of innovative solar-integrated building solutions.
| Report Matrics |
Details |
| Market Size Value |
USD 77.8 billion |
| Growth Rate |
CAGR of 18.2% |
| Forecast |
2026-2033 |
| Historical data |
2021-2024 |
| Base Year |
2025 |
| Report Coverage |
Forecasted revenue, company rating, competitive environment, growth drivers, and trends |
| Segment Coverage |
Type, Application, End-User, Geography |
| Regional Scope |
North America, Europe, Asia Pacific, Middle East |
| Customized scope |
Free customization of reports (With 3 months' analysis support) |
| To Learn More About This Report |
Request a Free Sample Copy |
Building Integrated Photovoltaic Module Market Competitive Landscape:
The Global Building Integrated Photovoltaic (BIPV) Module Market features a diverse set of players ranging from legacy solar module manufacturers to specialized firms focused on building integrated solutions all competing on technology, product design, efficiency, aesthetics, and global footprint. As demand for sustainable construction materials and renewable energy integration rises, these companies are intensifying efforts in R&D, forming strategic partnerships, launching new BIPV lines, and scaling manufacturing capacity to capture market share. Innovation in thin film technologies, solar glass façades, semi transparent modules, and integration with architectural design is increasingly a differentiator. Competitive pressure is high, with leading firms constantly vying to deliver more efficient, durable, and design friendly BIPV solutions while also expanding geographically.
The major players for above market are:
- AGC Inc.
- Onyx Solar Group LLC
- Hanergy Holding Group Limited
- Maxeon Solar Technologies (The Solaria Corporation)
- Tesla, Inc.
- SunPower Corporation
- Ertex Solar (Ertex Solartechnik GmbH)
- Heliatek GmbH
- NanoPV Solar Inc.
- Polysolar Ltd
- Canadian Solar Inc.
- First Solar, Inc.
- Trina Solar Co., Ltd.
- JA Solar Technology Co., Ltd.
- LONGi Green Energy Technology Co., Ltd.
- Yingli Green Energy Holding Company
- Sharp Corporation
- Wuxi Suntech Power Co., Ltd.
- Carmanah Technologies Corporation
- ViaSolis
Recent Development
- In November 2025, ChasingLight Technology launched its lightweight, flexible iLux OPV module for indoor applications, including sensors, asset trackers, and smart office devices. Optimized for low-light environments, the mass-produced modules enable seamless integration into electronics, expanding practical applications and driving innovation, thereby boosting adoption and growth in the global building-integrated photovoltaic module market.
- In October 2023, SP Group completed and integrated its first 4 MWp BIPV project at Guangdong Lingxiao Pump Industry Co., demonstrating how energy-intensive commercial and industrial users can enhance energy efficiency and reduce costs. This successful deployment highlights BIPV’s practical benefits, driving adoption and contributing to growth in the global building-integrated photovoltaic module market.
Frequently Asked Questions (FAQ) :
Q1. What are the main growth-driving factors for this market?
Growth is primarily driven by strict government regulations in regions like Europe, which mandate energy efficiency and renewable energy use in new buildings. The appeal of BIPV also comes from its aesthetic integration, as it replaces traditional materials like glass and roofing, making buildings self-sufficient power producers.
Q2. What are the main restraining factors for this market?
The biggest obstacle is the high initial installation cost compared to conventional building materials or standard rooftop solar panels. This increased upfront investment, coupled with the complexity of integrating the technology into various architectural designs, often slows down the adoption rate for many developers.
Q3. Which segment is expected to witness high growth?
The Commercial segment (offices, institutions, large complexes) is expected to witness the highest growth. These large buildings offer vast surface areas for BIPV integration, allowing businesses to maximize energy savings and meet corporate sustainability goals, making the long-term investment financially attractive.
Q4. Who are the top major players for this market?
Leading companies often include established solar manufacturers and specialized construction material firms. Top players in this competitive space are generally LONGi, Canadian Solar, JinkoSolar, AGC Inc., and tech companies like Tesla, which focus on integrated roofing solutions.
Q5. Which country is the largest player?
China and the broader Asia-Pacific region dominate the BIPV market in terms of production and installation volume. This is due to massive government support for PV, rapid urbanization, and the region's immense manufacturing capabilities, although Europe currently leads in strict regulatory mandates.
List of Figures
Figure 1: Global Building Integrated Photovoltaic Module Market Revenue Breakdown (USD Billion, %) by Region, 2022 & 2029
Figure 2: Global Building Integrated Photovoltaic Module Market Value Share (%), By Segment 1, 2022 & 2029
Figure 3: Global Building Integrated Photovoltaic Module Market Forecast (USD Billion), by Sub-Segment 1, 2018-2029
Figure 4: Global Building Integrated Photovoltaic Module Market Forecast (USD Billion), by Sub-Segment 2, 2018-2029
Figure 5: Global Building Integrated Photovoltaic Module Market Value Share (%), By Segment 2, 2022 & 2029
Figure 6: Global Building Integrated Photovoltaic Module Market Forecast (USD Billion), by Sub-Segment 1, 2018-2029
Figure 7: Global Building Integrated Photovoltaic Module Market Forecast (USD Billion), by Sub-Segment 2, 2018-2029
Figure 8: Global Building Integrated Photovoltaic Module Market Forecast (USD Billion), by Sub-Segment 3, 2018-2029
Figure 9: Global Building Integrated Photovoltaic Module Market Forecast (USD Billion), by Others, 2018-2029
Figure 10: Global Building Integrated Photovoltaic Module Market Value Share (%), By Segment 3, 2022 & 2029
Figure 11: Global Building Integrated Photovoltaic Module Market Forecast (USD Billion), by Sub-Segment 1, 2018-2029
Figure 12: Global Building Integrated Photovoltaic Module Market Forecast (USD Billion), by Sub-Segment 2, 2018-2029
Figure 13: Global Building Integrated Photovoltaic Module Market Forecast (USD Billion), by Sub-Segment 3, 2018-2029
Figure 14: Global Building Integrated Photovoltaic Module Market Forecast (USD Billion), by Others, 2018-2029
Figure 15: Global Building Integrated Photovoltaic Module Market Value (USD Billion), by Region, 2022 & 2029
Figure 16: North America Building Integrated Photovoltaic Module Market Value Share (%), By Segment 1, 2022 & 2029
Figure 17: North America Building Integrated Photovoltaic Module Market Forecast (USD Billion), by Sub-Segment 1, 2018-2029
Figure 18: North America Building Integrated Photovoltaic Module Market Forecast (USD Billion), by Sub-Segment 2, 2018-2029
Figure 19: North America Building Integrated Photovoltaic Module Market Value Share (%), By Segment 2, 2022 & 2029
Figure 20: North America Building Integrated Photovoltaic Module Market Forecast (USD Billion), by Sub-Segment 1, 2018-2029
Figure 21: North America Building Integrated Photovoltaic Module Market Forecast (USD Billion), by Sub-Segment 2, 2018-2029
Figure 22: North America Building Integrated Photovoltaic Module Market Forecast (USD Billion), by Sub-Segment 3, 2018-2029
Figure 23: North America Building Integrated Photovoltaic Module Market Forecast (USD Billion), by Others, 2018-2029
Figure 24: North America Building Integrated Photovoltaic Module Market Value Share (%), By Segment 3, 2022 & 2029
Figure 25: North America Building Integrated Photovoltaic Module Market Forecast (USD Billion), by Sub-Segment 1, 2018-2029
Figure 26: North America Building Integrated Photovoltaic Module Market Forecast (USD Billion), by Sub-Segment 2, 2018-2029
Figure 27: North America Building Integrated Photovoltaic Module Market Forecast (USD Billion), by Sub-Segment 3, 2018-2029
Figure 28: North America Building Integrated Photovoltaic Module Market Forecast (USD Billion), by Others, 2018-2029
Figure 29: North America Building Integrated Photovoltaic Module Market Forecast (USD Billion), by U.S., 2018-2029
Figure 30: North America Building Integrated Photovoltaic Module Market Forecast (USD Billion), by Canada, 2018-2029
Figure 31: Latin America Building Integrated Photovoltaic Module Market Value Share (%), By Segment 1, 2022 & 2029
Figure 32: Latin America Building Integrated Photovoltaic Module Market Forecast (USD Billion), by Sub-Segment 1, 2018-2029
Figure 33: Latin America Building Integrated Photovoltaic Module Market Forecast (USD Billion), by Sub-Segment 2, 2018-2029
Figure 34: Latin America Building Integrated Photovoltaic Module Market Value Share (%), By Segment 2, 2022 & 2029
Figure 35: Latin America Building Integrated Photovoltaic Module Market Forecast (USD Billion), by Sub-Segment 1, 2018-2029
Figure 36: Latin America Building Integrated Photovoltaic Module Market Forecast (USD Billion), by Sub-Segment 2, 2018-2029
Figure 37: Latin America Building Integrated Photovoltaic Module Market Forecast (USD Billion), by Sub-Segment 3, 2018-2029
Figure 38: Latin America Building Integrated Photovoltaic Module Market Forecast (USD Billion), by Others, 2018-2029
Figure 39: Latin America Building Integrated Photovoltaic Module Market Value Share (%), By Segment 3, 2022 & 2029
Figure 40: Latin America Building Integrated Photovoltaic Module Market Forecast (USD Billion), by Sub-Segment 1, 2018-2029
Figure 41: Latin America Building Integrated Photovoltaic Module Market Forecast (USD Billion), by Sub-Segment 2, 2018-2029
Figure 42: Latin America Building Integrated Photovoltaic Module Market Forecast (USD Billion), by Sub-Segment 3, 2018-2029
Figure 43: Latin America Building Integrated Photovoltaic Module Market Forecast (USD Billion), by Others, 2018-2029
Figure 44: Latin America Building Integrated Photovoltaic Module Market Forecast (USD Billion), by Brazil, 2018-2029
Figure 45: Latin America Building Integrated Photovoltaic Module Market Forecast (USD Billion), by Mexico, 2018-2029
Figure 46: Latin America Building Integrated Photovoltaic Module Market Forecast (USD Billion), by Rest of Latin America, 2018-2029
Figure 47: Europe Building Integrated Photovoltaic Module Market Value Share (%), By Segment 1, 2022 & 2029
Figure 48: Europe Building Integrated Photovoltaic Module Market Forecast (USD Billion), by Sub-Segment 1, 2018-2029
Figure 49: Europe Building Integrated Photovoltaic Module Market Forecast (USD Billion), by Sub-Segment 2, 2018-2029
Figure 50: Europe Building Integrated Photovoltaic Module Market Value Share (%), By Segment 2, 2022 & 2029
Figure 51: Europe Building Integrated Photovoltaic Module Market Forecast (USD Billion), by Sub-Segment 1, 2018-2029
Figure 52: Europe Building Integrated Photovoltaic Module Market Forecast (USD Billion), by Sub-Segment 2, 2018-2029
Figure 53: Europe Building Integrated Photovoltaic Module Market Forecast (USD Billion), by Sub-Segment 3, 2018-2029
Figure 54: Europe Building Integrated Photovoltaic Module Market Forecast (USD Billion), by Others, 2018-2029
Figure 55: Europe Building Integrated Photovoltaic Module Market Value Share (%), By Segment 3, 2022 & 2029
Figure 56: Europe Building Integrated Photovoltaic Module Market Forecast (USD Billion), by Sub-Segment 1, 2018-2029
Figure 57: Europe Building Integrated Photovoltaic Module Market Forecast (USD Billion), by Sub-Segment 2, 2018-2029
Figure 58: Europe Building Integrated Photovoltaic Module Market Forecast (USD Billion), by Sub-Segment 3, 2018-2029
Figure 59: Europe Building Integrated Photovoltaic Module Market Forecast (USD Billion), by Others, 2018-2029
Figure 60: Europe Building Integrated Photovoltaic Module Market Forecast (USD Billion), by U.K., 2018-2029
Figure 61: Europe Building Integrated Photovoltaic Module Market Forecast (USD Billion), by Germany, 2018-2029
Figure 62: Europe Building Integrated Photovoltaic Module Market Forecast (USD Billion), by France, 2018-2029
Figure 63: Europe Building Integrated Photovoltaic Module Market Forecast (USD Billion), by Italy, 2018-2029
Figure 64: Europe Building Integrated Photovoltaic Module Market Forecast (USD Billion), by Spain, 2018-2029
Figure 65: Europe Building Integrated Photovoltaic Module Market Forecast (USD Billion), by Russia, 2018-2029
Figure 66: Europe Building Integrated Photovoltaic Module Market Forecast (USD Billion), by Rest of Europe, 2018-2029
Figure 67: Asia Pacific Building Integrated Photovoltaic Module Market Value Share (%), By Segment 1, 2022 & 2029
Figure 68: Asia Pacific Building Integrated Photovoltaic Module Market Forecast (USD Billion), by Sub-Segment 1, 2018-2029
Figure 69: Asia Pacific Building Integrated Photovoltaic Module Market Forecast (USD Billion), by Sub-Segment 2, 2018-2029
Figure 70: Asia Pacific Building Integrated Photovoltaic Module Market Value Share (%), By Segment 2, 2022 & 2029
Figure 71: Asia Pacific Building Integrated Photovoltaic Module Market Forecast (USD Billion), by Sub-Segment 1, 2018-2029
Figure 72: Asia Pacific Building Integrated Photovoltaic Module Market Forecast (USD Billion), by Sub-Segment 2, 2018-2029
Figure 73: Asia Pacific Building Integrated Photovoltaic Module Market Forecast (USD Billion), by Sub-Segment 3, 2018-2029
Figure 74: Asia Pacific Building Integrated Photovoltaic Module Market Forecast (USD Billion), by Others, 2018-2029
Figure 75: Asia Pacific Building Integrated Photovoltaic Module Market Value Share (%), By Segment 3, 2022 & 2029
Figure 76: Asia Pacific Building Integrated Photovoltaic Module Market Forecast (USD Billion), by Sub-Segment 1, 2018-2029
Figure 77: Asia Pacific Building Integrated Photovoltaic Module Market Forecast (USD Billion), by Sub-Segment 2, 2018-2029
Figure 78: Asia Pacific Building Integrated Photovoltaic Module Market Forecast (USD Billion), by Sub-Segment 3, 2018-2029
Figure 79: Asia Pacific Building Integrated Photovoltaic Module Market Forecast (USD Billion), by Others, 2018-2029
Figure 80: Asia Pacific Building Integrated Photovoltaic Module Market Forecast (USD Billion), by China, 2018-2029
Figure 81: Asia Pacific Building Integrated Photovoltaic Module Market Forecast (USD Billion), by India, 2018-2029
Figure 82: Asia Pacific Building Integrated Photovoltaic Module Market Forecast (USD Billion), by Japan, 2018-2029
Figure 83: Asia Pacific Building Integrated Photovoltaic Module Market Forecast (USD Billion), by Australia, 2018-2029
Figure 84: Asia Pacific Building Integrated Photovoltaic Module Market Forecast (USD Billion), by Southeast Asia, 2018-2029
Figure 85: Asia Pacific Building Integrated Photovoltaic Module Market Forecast (USD Billion), by Rest of Asia Pacific, 2018-2029
Figure 86: Middle East & Africa Building Integrated Photovoltaic Module Market Value Share (%), By Segment 1, 2022 & 2029
Figure 87: Middle East & Africa Building Integrated Photovoltaic Module Market Forecast (USD Billion), by Sub-Segment 1, 2018-2029
Figure 88: Middle East & Africa Building Integrated Photovoltaic Module Market Forecast (USD Billion), by Sub-Segment 2, 2018-2029
Figure 89: Middle East & Africa Building Integrated Photovoltaic Module Market Value Share (%), By Segment 2, 2022 & 2029
Figure 90: Middle East & Africa Building Integrated Photovoltaic Module Market Forecast (USD Billion), by Sub-Segment 1, 2018-2029
Figure 91: Middle East & Africa Building Integrated Photovoltaic Module Market Forecast (USD Billion), by Sub-Segment 2, 2018-2029
Figure 92: Middle East & Africa Building Integrated Photovoltaic Module Market Forecast (USD Billion), by Sub-Segment 3, 2018-2029
Figure 93: Middle East & Africa Building Integrated Photovoltaic Module Market Forecast (USD Billion), by Others, 2018-2029
Figure 94: Middle East & Africa Building Integrated Photovoltaic Module Market Value Share (%), By Segment 3, 2022 & 2029
Figure 95: Middle East & Africa Building Integrated Photovoltaic Module Market Forecast (USD Billion), by Sub-Segment 1, 2018-2029
Figure 96: Middle East & Africa Building Integrated Photovoltaic Module Market Forecast (USD Billion), by Sub-Segment 2, 2018-2029
Figure 97: Middle East & Africa Building Integrated Photovoltaic Module Market Forecast (USD Billion), by Sub-Segment 3, 2018-2029
Figure 98: Middle East & Africa Building Integrated Photovoltaic Module Market Forecast (USD Billion), by Others, 2018-2029
Figure 99: Middle East & Africa Building Integrated Photovoltaic Module Market Forecast (USD Billion), by GCC, 2018-2029
Figure 100: Middle East & Africa Building Integrated Photovoltaic Module Market Forecast (USD Billion), by South Africa, 2018-2029
Figure 101: Middle East & Africa Building Integrated Photovoltaic Module Market Forecast (USD Billion), by Rest of Middle East & Africa, 2018-2029
List of Tables
Table 1: Global Building Integrated Photovoltaic Module Market Revenue (USD Billion) Forecast, by Segment 1, 2018-2029
Table 2: Global Building Integrated Photovoltaic Module Market Revenue (USD Billion) Forecast, by Segment 2, 2018-2029
Table 3: Global Building Integrated Photovoltaic Module Market Revenue (USD Billion) Forecast, by Segment 3, 2018-2029
Table 4: Global Building Integrated Photovoltaic Module Market Revenue (USD Billion) Forecast, by Region, 2018-2029
Table 5: North America Building Integrated Photovoltaic Module Market Revenue (USD Billion) Forecast, by Segment 1, 2018-2029
Table 6: North America Building Integrated Photovoltaic Module Market Revenue (USD Billion) Forecast, by Segment 2, 2018-2029
Table 7: North America Building Integrated Photovoltaic Module Market Revenue (USD Billion) Forecast, by Segment 3, 2018-2029
Table 8: North America Building Integrated Photovoltaic Module Market Revenue (USD Billion) Forecast, by Country, 2018-2029
Table 9: Europe Building Integrated Photovoltaic Module Market Revenue (USD Billion) Forecast, by Segment 1, 2018-2029
Table 10: Europe Building Integrated Photovoltaic Module Market Revenue (USD Billion) Forecast, by Segment 2, 2018-2029
Table 11: Europe Building Integrated Photovoltaic Module Market Revenue (USD Billion) Forecast, by Segment 3, 2018-2029
Table 12: Europe Building Integrated Photovoltaic Module Market Revenue (USD Billion) Forecast, by Country, 2018-2029
Table 13: Latin America Building Integrated Photovoltaic Module Market Revenue (USD Billion) Forecast, by Segment 1, 2018-2029
Table 14: Latin America Building Integrated Photovoltaic Module Market Revenue (USD Billion) Forecast, by Segment 2, 2018-2029
Table 15: Latin America Building Integrated Photovoltaic Module Market Revenue (USD Billion) Forecast, by Segment 3, 2018-2029
Table 16: Latin America Building Integrated Photovoltaic Module Market Revenue (USD Billion) Forecast, by Country, 2018-2029
Table 17: Asia Pacific Building Integrated Photovoltaic Module Market Revenue (USD Billion) Forecast, by Segment 1, 2018-2029
Table 18: Asia Pacific Building Integrated Photovoltaic Module Market Revenue (USD Billion) Forecast, by Segment 2, 2018-2029
Table 19: Asia Pacific Building Integrated Photovoltaic Module Market Revenue (USD Billion) Forecast, by Segment 3, 2018-2029
Table 20: Asia Pacific Building Integrated Photovoltaic Module Market Revenue (USD Billion) Forecast, by Country, 2018-2029
Table 21: Middle East & Africa Building Integrated Photovoltaic Module Market Revenue (USD Billion) Forecast, by Segment 1, 2018-2029
Table 22: Middle East & Africa Building Integrated Photovoltaic Module Market Revenue (USD Billion) Forecast, by Segment 2, 2018-2029
Table 23: Middle East & Africa Building Integrated Photovoltaic Module Market Revenue (USD Billion) Forecast, by Segment 3, 2018-2029
Table 24: Middle East & Africa Building Integrated Photovoltaic Module Market Revenue (USD Billion) Forecast, by Country, 2018-2029
Research Process
Data Library Research are conducted by industry experts who offer insight on
industry structure, market segmentations technology assessment and competitive landscape (CL), and penetration, as well as on emerging trends. Their analysis is based on primary interviews (~ 80%) and secondary research (~ 20%) as well as years of professional expertise in their respective industries. Adding to this, by analysing historical trends and current market positions, our analysts predict where the market will be headed for the next five years. Furthermore, the varying trends of segment & categories geographically presented are also studied and the estimated based on the primary & secondary research.
In this particular report from the supply side Data Library Research has conducted primary surveys (interviews) with the key level executives (VP, CEO’s, Marketing Director, Business Development Manager
and SOFT) of the companies that active & prominent as well as the midsized organization
FIGURE 1: DLR RESEARH PROCESS
![research-methodology1]()
Primary Research
Extensive primary research was conducted to gain a deeper insight of the market and industry performance. The analysis is based on both primary and secondary research as well as years of professional expertise in the respective industries.
In addition to analysing current and historical trends, our analysts predict where the market is headed over the next five years.
It varies by segment for these categories geographically presented in the list of market tables. Speaking about this particular report we have conducted primary surveys (interviews) with the key level executives (VP, CEO’s, Marketing Director, Business Development Manager and many more) of the major players active in the market.
Secondary Research
Secondary research was mainly used to collect and identify information useful for the extensive, technical, market-oriented, and Friend’s study of the Global Extra Neutral Alcohol. It was also used to obtain key information about major players, market classification and segmentation according to the industry trends, geographical markets, and developments related to the market and technology perspectives. For this study, analysts have gathered information from various credible sources, such as annual reports, sec filings, journals, white papers, SOFT presentations, and company web sites.
Market Size Estimation
Both, top-down and bottom-up approaches were used to estimate and validate the size of the Global market and to estimate the size of various other dependent submarkets in the overall Extra Neutral Alcohol. The key players in the market were identified through secondary research and their market contributions in the respective geographies were determined through primary and secondary research.
Forecast Model
![research-methodology2]()