Capillary Blood Collection Devices Market Overview
The global capillary blood collection devices market has seen a significant increase in demand due to the rise in chronic diseases and infectious diseases. Furthermore, the growing availability of point-of-care diagnostics and increased awareness of newly developed capillary blood collection products are propelling this market forward.
The global capillary blood collection devices market is growing due to a growing elderly population, rising food-borne disease prevalence, and fast urbanization. Noncommunicable diseases such as cancer, cardiovascular disorders, chronic respiratory disorders, and diabetes accounted for 71.0 percent of all deaths in 2017, according to WHO data. As a result, the global capillary blood collection devices market has a better chance of growing in the approaching years.
On the other hand, the risk associated with the approach utilized for capillary blood collection could hinder expansion in the global capillary blood collection devices market.
| Report Metric |
Details |
| Market size available for years |
2023–2030 |
| Base year considered |
2023 |
| Forecast period |
2024–2030 |
| Forecast unit |
Value (USD Million) |
| Segments covered |
Product Type, and Region. |
| Regions covered |
North America (the U.S. and Canada), Europe (UK, Germany, France, Italy, Spain, Russia, Rest of Europe), Asia-Pacific (China, India, Japan, Australia, South East Asia, Rest of Asia Pacific), Latin America and the Middle East and Africa (Brazil, Saudi Arabia, UAE, Rest of LAMEA) |
| Companies covered |
Kabe Labortechnik GmbH, Danaher, Improve Medical Technology Co., Thermo Fisher Scientific, Inc., BD, Sarstedt AG & Co., Medtronic, Terumo Medical Corporation, and Greiner Bio-One International GmbH. |
COVID-19 Impact on Capillary Blood Collection Devices Market
In addition, the current Capillary Blood Collection Devices Market study offers a detailed analysis of the current COVID-19 pandemic impact on the market growth and its influence on the future growth of the Capillary Blood Collection Devices Market. The recently published report demonstrates the elevation in the demand for the healthcare sector. The healthcare manufacturers have experienced long term as well as short term effect which includes supply shortages, panic buying, and stocking, regulation changes as short-term whereas approval delays and possible trend variations in consumption could be perceived as long-term impacts of COVID-19 on the health and pharmaceutical market.
The increasing need for a cure has pushed vaccine research and manufacturers to the limit. In addition to this, panic conditions have already spurred the demand for many healthcare products and services which are discussed in detail in this report. Moreover, the impact of COVID-19 on overall market revenue for the base year 2020 and its projection up to 2027 is provided in detail in this report.
Capillary Blood Collection Devices Market Segment Overview
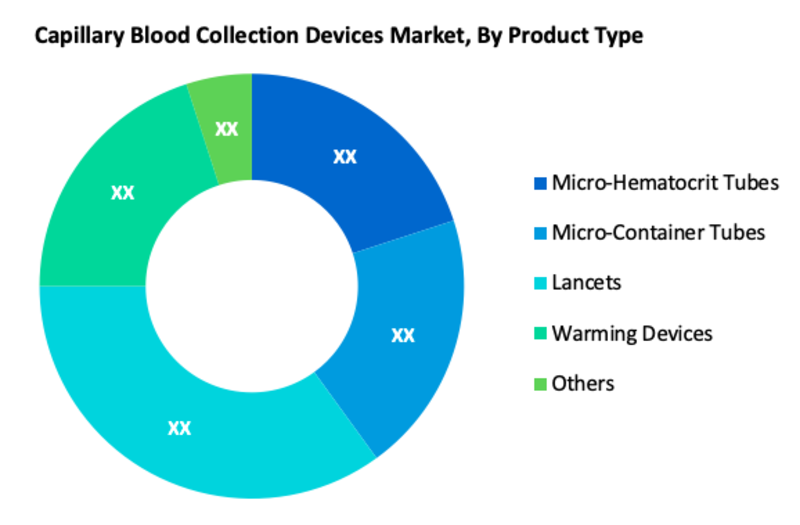
According to product types, Lancets is one of the major segments in the global Capillary Blood Collection Devices Market. The demand for lancets is expected to increase significantly in the forthcoming years. The rising trend for minimum invasiveness during blood collection is the key factor that boosted demand for lancets.
Capillary Blood Collection Devices Market, By Product Type
· Micro-Hematocrit Tubes
· Micro-Container Tubes
· Lancets
· Warming Devices
· Others
Capillary Blood Collection Devices Market Regional Overview
The global Capillary Blood Collection Devices market is divided into North America, Europe, Asia Pacific, Latin America, and the Middle East & Africa. Over the forecast period, North America is expected to have the largest share of the global capillary blood collection devices market. This region has become a prominent market for capillary blood collection devices due to its extensive usage of innovative technologies and increased investment in the healthcare sector. Furthermore, favourable reimbursement policies and widespread public knowledge of the benefits of capillary blood collection will propel the capillary blood collection devices market in North America forward. Demand for these devices grows when novel equipment and surgical techniques are adopted more quickly and early.
On the other hand, Asia Pacific is expected to contribute to the global capillary blood collection devices market's growth. The key nations with significant demand for capillary blood collection equipment are China and India, where governments are investing heavily in the healthcare sector. Furthermore, technical advancements and increased medical research in Japan boosted the market for capillary blood collection devices in the Asia Pacific.
Capillary Blood Collection Devices Market, By Geography
· North America (US & Canada)
· Europe (UK, Germany, France, Italy, Spain, Russia & Rest of Europe)
· Asia-Pacific (Japan, China, India, Australia, & South Korea, & Rest of Asia-Pacific)
· LAMEA (Brazil, Saudi Arabia, UAE & Rest of LAMEA)
Capillary Blood Collection Devices Market, Key Players
· Kabe Labortechnik GmbH
· Danaher
· Improve Medical Technology Co.
· Thermo Fisher Scientific, Inc.
· BD
· Sarstedt AG & Co.
· Medtronic
· Terumo Medical Corporation
· Greiner Bio-One International GmbH.
Frequently Asked Questions (FAQ) :
Q1. What are the driving factors for the global Capillary Blood Collection Devices market?
The global capillary blood collection devices market is growing due to a growing elderly population, rising food-borne disease prevalence, and fast urbanization
Q2. What are the restraining factors for the global Capillary Blood Collection Devices market?
The risk associated with the approach utilized for capillary blood collection could hinder expansion in the global capillary blood collection devices market
Q3. Which segment is projected to hold the largest share in the global Capillary Blood Collection Devices market?
Lancets segment is projected to hold the largest share in the global Capillary Blood Collection Devices market
Q4. Which region holds the largest share in the global Capillary Blood Collection Devices market?
North America holds the largest share in the global Capillary Blood Collection Devices market
Q5. Which are the prominent players in the global Capillary Blood Collection Devices market?
Kabe Labortechnik GmbH, Danaher, Improve Medical Technology Co., Thermo Fisher Scientific, Inc., BD, Sarstedt AG & Co., Medtronic, Terumo Medical Corporation, and Greiner Bio-One International GmbH. are some key players in the global Capillary Blood Collection Devices market
List of Figures
Figure 1: Global Capillary Blood Collection Devices Market Revenue Breakdown (USD Billion, %) by Region, 2019 & 2027
Figure 2: Global Capillary Blood Collection Devices Market Value Share (%), By Segment 1, 2019 & 2027
Figure 3: Global Capillary Blood Collection Devices Market Forecast (USD Billion), by Sub-Segment 1, 2016-2027
Figure 4: Global Capillary Blood Collection Devices Market Forecast (USD Billion), by Sub-Segment 2, 2016-2027
Figure 5: Global Capillary Blood Collection Devices Market Value Share (%), By Segment 2, 2019 & 2027
Figure 6: Global Capillary Blood Collection Devices Market Forecast (USD Billion), by Sub-Segment 1, 2016-2027
Figure 7: Global Capillary Blood Collection Devices Market Forecast (USD Billion), by Sub-Segment 2, 2016-2027
Figure 8: Global Capillary Blood Collection Devices Market Forecast (USD Billion), by Sub-Segment 3, 2016-2027
Figure 9: Global Capillary Blood Collection Devices Market Forecast (USD Billion), by Others, 2016-2027
Figure 10: Global Capillary Blood Collection Devices Market Value Share (%), By Segment 3, 2019 & 2027
Figure 11: Global Capillary Blood Collection Devices Market Forecast (USD Billion), by Sub-Segment 1, 2016-2027
Figure 12: Global Capillary Blood Collection Devices Market Forecast (USD Billion), by Sub-Segment 2, 2016-2027
Figure 13: Global Capillary Blood Collection Devices Market Forecast (USD Billion), by Sub-Segment 3, 2016-2027
Figure 14: Global Capillary Blood Collection Devices Market Forecast (USD Billion), by Others, 2016-2027
Figure 15: Global Capillary Blood Collection Devices Market Value (USD Billion), by Region, 2019 & 2027
Figure 16: North America Capillary Blood Collection Devices Market Value Share (%), By Segment 1, 2019 & 2027
Figure 17: North America Capillary Blood Collection Devices Market Forecast (USD Billion), by Sub-Segment 1, 2016-2027
Figure 18: North America Capillary Blood Collection Devices Market Forecast (USD Billion), by Sub-Segment 2, 2016-2027
Figure 19: North America Capillary Blood Collection Devices Market Value Share (%), By Segment 2, 2019 & 2027
Figure 20: North America Capillary Blood Collection Devices Market Forecast (USD Billion), by Sub-Segment 1, 2016-2027
Figure 21: North America Capillary Blood Collection Devices Market Forecast (USD Billion), by Sub-Segment 2, 2016-2027
Figure 22: North America Capillary Blood Collection Devices Market Forecast (USD Billion), by Sub-Segment 3, 2016-2027
Figure 23: North America Capillary Blood Collection Devices Market Forecast (USD Billion), by Others, 2016-2027
Figure 24: North America Capillary Blood Collection Devices Market Value Share (%), By Segment 3, 2019 & 2027
Figure 25: North America Capillary Blood Collection Devices Market Forecast (USD Billion), by Sub-Segment 1, 2016-2027
Figure 26: North America Capillary Blood Collection Devices Market Forecast (USD Billion), by Sub-Segment 2, 2016-2027
Figure 27: North America Capillary Blood Collection Devices Market Forecast (USD Billion), by Sub-Segment 3, 2016-2027
Figure 28: North America Capillary Blood Collection Devices Market Forecast (USD Billion), by Others, 2016-2027
Figure 29: North America Capillary Blood Collection Devices Market Forecast (USD Billion), by U.S., 2016-2027
Figure 30: North America Capillary Blood Collection Devices Market Forecast (USD Billion), by Canada, 2016-2027
Figure 31: Latin America Capillary Blood Collection Devices Market Value Share (%), By Segment 1, 2019 & 2027
Figure 32: Latin America Capillary Blood Collection Devices Market Forecast (USD Billion), by Sub-Segment 1, 2016-2027
Figure 33: Latin America Capillary Blood Collection Devices Market Forecast (USD Billion), by Sub-Segment 2, 2016-2027
Figure 34: Latin America Capillary Blood Collection Devices Market Value Share (%), By Segment 2, 2019 & 2027
Figure 35: Latin America Capillary Blood Collection Devices Market Forecast (USD Billion), by Sub-Segment 1, 2016-2027
Figure 36: Latin America Capillary Blood Collection Devices Market Forecast (USD Billion), by Sub-Segment 2, 2016-2027
Figure 37: Latin America Capillary Blood Collection Devices Market Forecast (USD Billion), by Sub-Segment 3, 2016-2027
Figure 38: Latin America Capillary Blood Collection Devices Market Forecast (USD Billion), by Others, 2016-2027
Figure 39: Latin America Capillary Blood Collection Devices Market Value Share (%), By Segment 3, 2019 & 2027
Figure 40: Latin America Capillary Blood Collection Devices Market Forecast (USD Billion), by Sub-Segment 1, 2016-2027
Figure 41: Latin America Capillary Blood Collection Devices Market Forecast (USD Billion), by Sub-Segment 2, 2016-2027
Figure 42: Latin America Capillary Blood Collection Devices Market Forecast (USD Billion), by Sub-Segment 3, 2016-2027
Figure 43: Latin America Capillary Blood Collection Devices Market Forecast (USD Billion), by Others, 2016-2027
Figure 44: Latin America Capillary Blood Collection Devices Market Forecast (USD Billion), by Brazil, 2016-2027
Figure 45: Latin America Capillary Blood Collection Devices Market Forecast (USD Billion), by Mexico, 2016-2027
Figure 46: Latin America Capillary Blood Collection Devices Market Forecast (USD Billion), by Rest of Latin America, 2016-2027
Figure 47: Europe Capillary Blood Collection Devices Market Value Share (%), By Segment 1, 2019 & 2027
Figure 48: Europe Capillary Blood Collection Devices Market Forecast (USD Billion), by Sub-Segment 1, 2016-2027
Figure 49: Europe Capillary Blood Collection Devices Market Forecast (USD Billion), by Sub-Segment 2, 2016-2027
Figure 50: Europe Capillary Blood Collection Devices Market Value Share (%), By Segment 2, 2019 & 2027
Figure 51: Europe Capillary Blood Collection Devices Market Forecast (USD Billion), by Sub-Segment 1, 2016-2027
Figure 52: Europe Capillary Blood Collection Devices Market Forecast (USD Billion), by Sub-Segment 2, 2016-2027
Figure 53: Europe Capillary Blood Collection Devices Market Forecast (USD Billion), by Sub-Segment 3, 2016-2027
Figure 54: Europe Capillary Blood Collection Devices Market Forecast (USD Billion), by Others, 2016-2027
Figure 55: Europe Capillary Blood Collection Devices Market Value Share (%), By Segment 3, 2019 & 2027
Figure 56: Europe Capillary Blood Collection Devices Market Forecast (USD Billion), by Sub-Segment 1, 2016-2027
Figure 57: Europe Capillary Blood Collection Devices Market Forecast (USD Billion), by Sub-Segment 2, 2016-2027
Figure 58: Europe Capillary Blood Collection Devices Market Forecast (USD Billion), by Sub-Segment 3, 2016-2027
Figure 59: Europe Capillary Blood Collection Devices Market Forecast (USD Billion), by Others, 2016-2027
Figure 60: Europe Capillary Blood Collection Devices Market Forecast (USD Billion), by U.K., 2016-2027
Figure 61: Europe Capillary Blood Collection Devices Market Forecast (USD Billion), by Germany, 2016-2027
Figure 62: Europe Capillary Blood Collection Devices Market Forecast (USD Billion), by France, 2016-2027
Figure 63: Europe Capillary Blood Collection Devices Market Forecast (USD Billion), by Italy, 2016-2027
Figure 64: Europe Capillary Blood Collection Devices Market Forecast (USD Billion), by Spain, 2016-2027
Figure 65: Europe Capillary Blood Collection Devices Market Forecast (USD Billion), by Russia, 2016-2027
Figure 66: Europe Capillary Blood Collection Devices Market Forecast (USD Billion), by Rest of Europe, 2016-2027
Figure 67: Asia Pacific Capillary Blood Collection Devices Market Value Share (%), By Segment 1, 2019 & 2027
Figure 68: Asia Pacific Capillary Blood Collection Devices Market Forecast (USD Billion), by Sub-Segment 1, 2016-2027
Figure 69: Asia Pacific Capillary Blood Collection Devices Market Forecast (USD Billion), by Sub-Segment 2, 2016-2027
Figure 70: Asia Pacific Capillary Blood Collection Devices Market Value Share (%), By Segment 2, 2019 & 2027
Figure 71: Asia Pacific Capillary Blood Collection Devices Market Forecast (USD Billion), by Sub-Segment 1, 2016-2027
Figure 72: Asia Pacific Capillary Blood Collection Devices Market Forecast (USD Billion), by Sub-Segment 2, 2016-2027
Figure 73: Asia Pacific Capillary Blood Collection Devices Market Forecast (USD Billion), by Sub-Segment 3, 2016-2027
Figure 74: Asia Pacific Capillary Blood Collection Devices Market Forecast (USD Billion), by Others, 2016-2027
Figure 75: Asia Pacific Capillary Blood Collection Devices Market Value Share (%), By Segment 3, 2019 & 2027
Figure 76: Asia Pacific Capillary Blood Collection Devices Market Forecast (USD Billion), by Sub-Segment 1, 2016-2027
Figure 77: Asia Pacific Capillary Blood Collection Devices Market Forecast (USD Billion), by Sub-Segment 2, 2016-2027
Figure 78: Asia Pacific Capillary Blood Collection Devices Market Forecast (USD Billion), by Sub-Segment 3, 2016-2027
Figure 79: Asia Pacific Capillary Blood Collection Devices Market Forecast (USD Billion), by Others, 2016-2027
Figure 80: Asia Pacific Capillary Blood Collection Devices Market Forecast (USD Billion), by China, 2016-2027
Figure 81: Asia Pacific Capillary Blood Collection Devices Market Forecast (USD Billion), by India, 2016-2027
Figure 82: Asia Pacific Capillary Blood Collection Devices Market Forecast (USD Billion), by Japan, 2016-2027
Figure 83: Asia Pacific Capillary Blood Collection Devices Market Forecast (USD Billion), by Australia, 2016-2027
Figure 84: Asia Pacific Capillary Blood Collection Devices Market Forecast (USD Billion), by Southeast Asia, 2016-2027
Figure 85: Asia Pacific Capillary Blood Collection Devices Market Forecast (USD Billion), by Rest of Asia Pacific, 2016-2027
Figure 86: Middle East & Africa Capillary Blood Collection Devices Market Value Share (%), By Segment 1, 2019 & 2027
Figure 87: Middle East & Africa Capillary Blood Collection Devices Market Forecast (USD Billion), by Sub-Segment 1, 2016-2027
Figure 88: Middle East & Africa Capillary Blood Collection Devices Market Forecast (USD Billion), by Sub-Segment 2, 2016-2027
Figure 89: Middle East & Africa Capillary Blood Collection Devices Market Value Share (%), By Segment 2, 2019 & 2027
Figure 90: Middle East & Africa Capillary Blood Collection Devices Market Forecast (USD Billion), by Sub-Segment 1, 2016-2027
Figure 91: Middle East & Africa Capillary Blood Collection Devices Market Forecast (USD Billion), by Sub-Segment 2, 2016-2027
Figure 92: Middle East & Africa Capillary Blood Collection Devices Market Forecast (USD Billion), by Sub-Segment 3, 2016-2027
Figure 93: Middle East & Africa Capillary Blood Collection Devices Market Forecast (USD Billion), by Others, 2016-2027
Figure 94: Middle East & Africa Capillary Blood Collection Devices Market Value Share (%), By Segment 3, 2019 & 2027
Figure 95: Middle East & Africa Capillary Blood Collection Devices Market Forecast (USD Billion), by Sub-Segment 1, 2016-2027
Figure 96: Middle East & Africa Capillary Blood Collection Devices Market Forecast (USD Billion), by Sub-Segment 2, 2016-2027
Figure 97: Middle East & Africa Capillary Blood Collection Devices Market Forecast (USD Billion), by Sub-Segment 3, 2016-2027
Figure 98: Middle East & Africa Capillary Blood Collection Devices Market Forecast (USD Billion), by Others, 2016-2027
Figure 99: Middle East & Africa Capillary Blood Collection Devices Market Forecast (USD Billion), by GCC, 2016-2027
Figure 100: Middle East & Africa Capillary Blood Collection Devices Market Forecast (USD Billion), by South Africa, 2016-2027
Figure 101: Middle East & Africa Capillary Blood Collection Devices Market Forecast (USD Billion), by Rest of Middle East & Africa, 2016-2027
List of Tables
Table 1: Global Capillary Blood Collection Devices Market Revenue (USD Billion) Forecast, by Segment 1, 2016-2027
Table 2: Global Capillary Blood Collection Devices Market Revenue (USD Billion) Forecast, by Segment 2, 2016-2027
Table 3: Global Capillary Blood Collection Devices Market Revenue (USD Billion) Forecast, by Segment 3, 2016-2027
Table 4: Global Capillary Blood Collection Devices Market Revenue (USD Billion) Forecast, by Region, 2016-2027
Table 5: North America Capillary Blood Collection Devices Market Revenue (USD Billion) Forecast, by Segment 1, 2016-2027
Table 6: North America Capillary Blood Collection Devices Market Revenue (USD Billion) Forecast, by Segment 2, 2016-2027
Table 7: North America Capillary Blood Collection Devices Market Revenue (USD Billion) Forecast, by Segment 3, 2016-2027
Table 8: North America Capillary Blood Collection Devices Market Revenue (USD Billion) Forecast, by Country, 2016-2027
Table 9: Europe Capillary Blood Collection Devices Market Revenue (USD Billion) Forecast, by Segment 1, 2016-2027
Table 10: Europe Capillary Blood Collection Devices Market Revenue (USD Billion) Forecast, by Segment 2, 2016-2027
Table 11: Europe Capillary Blood Collection Devices Market Revenue (USD Billion) Forecast, by Segment 3, 2016-2027
Table 12: Europe Capillary Blood Collection Devices Market Revenue (USD Billion) Forecast, by Country, 2016-2027
Table 13: Latin America Capillary Blood Collection Devices Market Revenue (USD Billion) Forecast, by Segment 1, 2016-2027
Table 14: Latin America Capillary Blood Collection Devices Market Revenue (USD Billion) Forecast, by Segment 2, 2016-2027
Table 15: Latin America Capillary Blood Collection Devices Market Revenue (USD Billion) Forecast, by Segment 3, 2016-2027
Table 16: Latin America Capillary Blood Collection Devices Market Revenue (USD Billion) Forecast, by Country, 2016-2027
Table 17: Asia Pacific Capillary Blood Collection Devices Market Revenue (USD Billion) Forecast, by Segment 1, 2016-2027
Table 18: Asia Pacific Capillary Blood Collection Devices Market Revenue (USD Billion) Forecast, by Segment 2, 2016-2027
Table 19: Asia Pacific Capillary Blood Collection Devices Market Revenue (USD Billion) Forecast, by Segment 3, 2016-2027
Table 20: Asia Pacific Capillary Blood Collection Devices Market Revenue (USD Billion) Forecast, by Country, 2016-2027
Table 21: Middle East & Africa Capillary Blood Collection Devices Market Revenue (USD Billion) Forecast, by Segment 1, 2016-2027
Table 22: Middle East & Africa Capillary Blood Collection Devices Market Revenue (USD Billion) Forecast, by Segment 2, 2016-2027
Table 23: Middle East & Africa Capillary Blood Collection Devices Market Revenue (USD Billion) Forecast, by Segment 3, 2016-2027
Table 24: Middle East & Africa Capillary Blood Collection Devices Market Revenue (USD Billion) Forecast, by Country, 2016-2027
Research Process
Data Library Research are conducted by industry experts who offer insight on
industry structure, market segmentations technology assessment and competitive landscape (CL), and penetration, as well as on emerging trends. Their analysis is based on primary interviews (~ 80%) and secondary research (~ 20%) as well as years of professional expertise in their respective industries. Adding to this, by analysing historical trends and current market positions, our analysts predict where the market will be headed for the next five years. Furthermore, the varying trends of segment & categories geographically presented are also studied and the estimated based on the primary & secondary research.
In this particular report from the supply side Data Library Research has conducted primary surveys (interviews) with the key level executives (VP, CEO’s, Marketing Director, Business Development Manager
and SOFT) of the companies that active & prominent as well as the midsized organization
FIGURE 1: DLR RESEARH PROCESS
![research-methodology1]()
Primary Research
Extensive primary research was conducted to gain a deeper insight of the market and industry performance. The analysis is based on both primary and secondary research as well as years of professional expertise in the respective industries.
In addition to analysing current and historical trends, our analysts predict where the market is headed over the next five years.
It varies by segment for these categories geographically presented in the list of market tables. Speaking about this particular report we have conducted primary surveys (interviews) with the key level executives (VP, CEO’s, Marketing Director, Business Development Manager and many more) of the major players active in the market.
Secondary Research
Secondary research was mainly used to collect and identify information useful for the extensive, technical, market-oriented, and Friend’s study of the Global Extra Neutral Alcohol. It was also used to obtain key information about major players, market classification and segmentation according to the industry trends, geographical markets, and developments related to the market and technology perspectives. For this study, analysts have gathered information from various credible sources, such as annual reports, sec filings, journals, white papers, SOFT presentations, and company web sites.
Market Size Estimation
Both, top-down and bottom-up approaches were used to estimate and validate the size of the Global market and to estimate the size of various other dependent submarkets in the overall Extra Neutral Alcohol. The key players in the market were identified through secondary research and their market contributions in the respective geographies were determined through primary and secondary research.
Forecast Model
![research-methodology2]()