Chronic Pain Topical Analgesics Market Overview and Analysis:
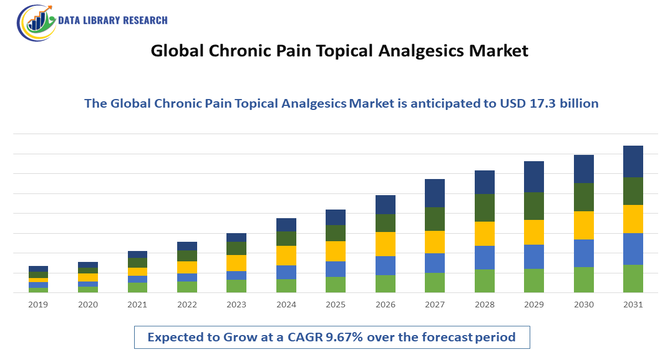
- The Topical Pain Relief Market was valued at approximately USD 11.0 billion in 2025 and is projected to reach around USD 17.3 billion by 2032, growing with a CAGR of 9.67% from 2025 to 2032.
Get Complete Analysis Of The Report - Download Updated Free Sample PDF
The Global Chronic Pain Topical Analgesics Market is experiencing steady growth driven by the rising prevalence of chronic pain conditions such as arthritis, neuropathy, musculoskeletal disorders, and post-surgical pain, particularly among aging populations. As patients increasingly seek non-invasive, localized, and safer alternatives to oral pain medications, topical analgesics—including creams, gels, patches, and sprays—are gaining strong market traction due to their targeted pain relief and reduced systemic side effects.
Chronic Pain Topical Analgesics Market Latest Trends:
The Global Chronic Pain Topical Analgesics Market is increasingly driven by evolving consumer preferences, technological innovation, and a growing emphasis on safer pain-relief alternatives. A prominent trend is the shift toward non-opioid, localized therapies such as NSAID-infused creams, lidocaine patches, and capsaicin gels, as patients and clinicians alike seek effective pain relief without systemic side effects or addiction risks. Concurrently, advancements in drug-delivery systems are enhancing product performance—transdermal patches with controlled dosing, nano-emulsion gels for improved skin penetration, and hydrogel formats offering sustained release and better skin adherence are gaining traction.
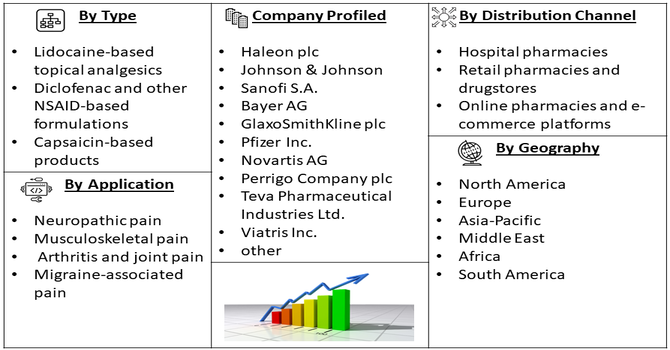
Segmentation: Global Chronic Pain Topical Analgesics Market is segmented By Product Type (Lidocaine-based topical analgesics, Diclofenac and other NSAID-based formulations, Capsaicin-based products), Formulation Type (Creams and gels, Sprays, Ointments and balms, Patches), Distribution Channel (Hospital pharmacies, Retail pharmacies and drugstores, Online pharmacies and e-commerce platforms), Application (Neuropathic pain, Musculoskeletal pain, Arthritis and joint pain, Migraine-associated pain), End User (Hospitals and clinics, Home care users, Long-term care facilities), and Geography (North America, Europe, Asia-Pacific, Middle East and Africa, and South America). The report provides the value (in USD million) for the above segments.
For Detailed Market Segmentation - Get a Free Sample PDF
Market Drivers:
- Rising Prevalence of Chronic Pain and Aging Population
A major driver of the Global Chronic Pain Topical Analgesics Market is the increasing global burden of chronic pain conditions such as osteoarthritis, neuropathic pain, lower back pain, and fibromyalgia. The prevalence of such conditions is strongly correlated with the growing elderly population, as aging leads to degenerative joint disorders, musculoskeletal wear, and nerve damage. For instance, A 2023 study in The Lancet Rheumatology estimated that osteoarthritis affected around 600 million people globally in 2020, representing nearly 8% of the world’s population. Projections indicated that cases could rise to almost 1 billion by 2050. This growing prevalence significantly influenced the global chronic pain topical analgesics market, driving increased demand for effective, non-systemic pain management options. As awareness grows regarding the benefits of non-invasive, easily applied topical formulations, their adoption continues to rise, supporting steady market expansion.
- Shift Toward Non-Opioid and Non-Systemic Pain Management Solutions
The global focus on reducing opioid dependence and misuse is another significant factor driving the market. Increasing regulatory restrictions, clinical guidelines promoting non-opioid therapies, and heightened public awareness of addiction risks have shifted treatment practices toward safer alternatives, including topical analgesics.
These products offer localized relief without the risks of gastrointestinal irritation, renal impairment, sedation, or addiction commonly linked to systemic medications. Innovations such as advanced drug delivery systems, long-acting medicated patches, penetration-enhancing formulations, and newer agents like capsaicin and lidocaine combinations are further improving therapeutic outcomes.
Market Restraints:
- Key Limitations is the Limited Efficacy for Severe or Deep-Tissue Pain
The key limitations is the limited efficacy for severe or deep-tissue pain, as topical applications primarily target surface-level or localized discomfort and may not provide adequate relief for chronic conditions requiring systemic treatment. Additionally, variability in patient response and inconsistent duration of relief can affect long-term adoption, as some users may experience temporary or insufficient therapeutic outcomes.
Socio-Economic Impact on Chronic Pain Topical Analgesics Market
The global chronic pain topical analgesics market has a notable socioeconomic impact, as chronic pain affects millions of people worldwide, reducing productivity and increasing healthcare costs. By providing accessible, non-systemic pain relief, these topical treatments help patients maintain daily activities and work, lowering disability and absenteeism. This not only improves quality of life but also eases the economic burden on healthcare systems and families.
Additionally, the growth of the chronic pain topical analgesics market stimulates economic activity by creating jobs in research, manufacturing, and retail sectors. Increased availability of effective, easy-to-use pain relief options can reduce dependence on oral medications, lowering the risk of side effects and long-term healthcare expenses. Overall, the market contributes to healthier, more productive communities while supporting broader economic stability.
Segmental Analysis:
- Diclofenac segment is expected to witness the highest growth over the forecast period
Diclofenac and other NSAID-based topical formulations represent the leading product category, driven by their proven anti-inflammatory effectiveness and strong clinical relevance in treating arthritis, joint stiffness, and musculoskeletal conditions. Their OTC availability and wide physician endorsement make them the most commonly used option for chronic pain relief.
- Creams and Gels segment is expected to witness the highest growth over the forecast period
Creams and gels dominate the formulation landscape due to their ease of use, fast absorption, and suitability for repeated daily application. These formats provide targeted pain relief without leaving residue or requiring specialized application methods, making them highly preferred among both patients and healthcare providers.
- Retail Pharmacies and Drugstores segment is expected to witness the highest growth over the forecast period
Retail pharmacies and drugstores hold the largest share of product distribution, supported by high OTC accessibility, strong consumer trust, and convenience. The presence of pharmacists for guidance and the ability to purchase products immediately without prescriptions significantly contributes to this channel’s dominance.
- Arthritis and Joint Pain segment is expected to witness the highest growth over the forecast period
Arthritis and joint pain represent the largest application area within the market as aging populations and rising osteoarthritis prevalence create sustained demand. Patients prefer topical analgesics in this category due to long-term usage suitability, reduced systemic effects, and enhanced safety over oral pain medications.
- Home Care Users segment is expected to witness the highest growth over the forecast period
Home care users form the dominant end-user group, driven by increasing self-management of chronic pain and the ease of applying topical analgesics without medical supervision. The shift toward non-invasive, convenient pain relief solutions supports ongoing adoption among elderly individuals, athletes, and chronic pain patients.
- North America segment is expected to witness the highest growth over the forecast period
North America remains the strongest regional market due to high awareness of non-opioid pain management options, a large aging population, established product availability, and increasing consumer preference for OTC chronic pain treatments.
In 2025, an article reported that approximately 10% of the U.S. population—tens of millions—experienced neuropathic pain, with cases rising as the population aged. Conditions such as diabetes, cancer treatments, and spinal cord injuries contributed to the condition. Despite its prevalence, physicians often overlooked neuropathic pain due to limited understanding of its biology. This unmet need influenced the growth and demand in North America’s chronic pain topical analgesics market.
Regulatory pressure to limit opioid prescriptions further accelerates demand for topical analgesics in the region. For instance, Nervonik, Inc. in March 2025, successfully closed a USD 13 million Series A funding round led by U.S. Venture Partners, with participation from Foothill Ventures, Correlation Ventures, and others, following prior $USD .4 million in SAFE and convertible note financings. This investment supported the development of its opioid-free peripheral nerve stimulation system, highlighting growing innovation in non-opioid pain management. It potentially influenced the chronic pain topical analgesics market in North America by expanding alternative, non-systemic treatment options for patients.
| Report Matrics |
Details |
| Market Size Value |
USD 17.3 billion |
| Growth Rate |
CAGR of 9.67% |
| Forecast |
2026-2033 |
| Historical data |
2021-2024 |
| Base Year |
2025 |
| Report Coverage |
Forecasted revenue, company rating, competitive environment, growth drivers, and trends |
| Segment Coverage |
Type, Application, End-User, Geography |
| Regional Scope |
North America, Europe, Asia Pacific, Middle East |
| Customized scope |
Free customization of reports (With 3 months' analysis support) |
| To Learn More About This Report |
Request a Free Sample Copy |
Chronic Pain Topical Analgesics Market Competitive Landscape:
The competitive landscape comprises large pharmaceutical and consumer-health companies, regional specialty players, and contract/generic manufacturers competing on formulation innovation, delivery technology, OTC access, and distribution reach.
Key Players:
- Hisamitsu Pharmaceutical Co., Ltd.
- Haleon plc
- Johnson & Johnson
- Sanofi S.A.
- Bayer AG
- GlaxoSmithKline plc
- Pfizer Inc.
- Novartis AG
- Perrigo Company plc
- Teva Pharmaceutical Industries Ltd.
- Viatris Inc.
- Sun Pharmaceutical Industries Ltd.
- Cipla Limited
- Reckitt Benckiser Group plc
- Rohto Pharmaceutical Co., Ltd.
- Haw Par Corporation Limited
- Endo International plc
- Amneal Pharmaceuticals, Inc.
- Performance Health Inc.
- Chattem, Inc.
Recent Development
- In January 2025, Vertex Pharmaceuticals Incorporated announced that the U.S. Food and Drug Administration had approved JOURNAVX (suzetrigine), an oral, non-opioid, highly selective NaV1.8 pain signal inhibitor, for treating adults with moderate-to-severe acute pain. The medicine was found to be effective and well-tolerated, with no evidence of addictive potential, and was indicated for use across all types of moderate-to-severe acute pain, offering a new non-opioid option for pain management.
- In January 2023, Yaral Pharma introduced an authorized generic version of IBSA Pharma’s Flector (diclofenac epolamine 1.3% topical system), a medicated patch designed to relieve acute pain from minor strains and sprains.
Frequently Asked Questions (FAQ) :
Q1. What are the main growth-driving factors for this market?
The market is primarily driven by the rapidly increasing global geriatric population, which suffers from a high prevalence of chronic conditions like arthritis and musculoskeletal disorders. Furthermore, there is a growing preference for non-opioid, localized treatments due to concerns about the side effects and dependency risks associated with oral pills and systemic opioids.
Q2. What are the main restraining factors for this market?
Key restraining factors include the potential for skin sensitization and contact allergies from prolonged use of topical ingredients, which can limit patient adherence. Also, the limited reimbursement coverage for many over-the-counter (OTC) topical products in healthcare systems outside of developed regions poses an economic constraint for consumers in emerging markets.
Q3. Which segment is expected to witness high growth?
The Transdermal Patches segment is expected to witness the fastest growth rate. Patches offer sustained, long-lasting relief and high patient compliance due to their clean, convenient, and easy-to-use application. Additionally, the Over-the-Counter (OTC) product type dominates the market due to its widespread availability and consumer preference for self-care options.
Q4. Who are the top major players for this market?
The market is fragmented but includes several key global pharmaceutical and consumer health companies. Major players include Johnson & Johnson, Sanofi, Haleon plc (formerly part of GSK), Reckitt Benckiser Group plc, and Pfizer Inc. These companies heavily invest in creating new formulations, such as patches and sprays, to improve product convenience and targeted delivery.
Q5. Which country is the largest player?
North America, primarily driven by the United States, holds the largest market share globally for topical analgesics. This dominance stems from the high rate of chronic pain conditions, an advanced healthcare system, high per capita healthcare spending, and strong consumer adoption of OTC pain relief products for joint and muscle soreness.
List of Figures
Figure 1: Global Chronic Pain Topical Analgesics Market Revenue Breakdown (USD Billion, %) by Region, 2022 & 2029
Figure 2: Global Chronic Pain Topical Analgesics Market Value Share (%), By Segment 1, 2022 & 2029
Figure 3: Global Chronic Pain Topical Analgesics Market Forecast (USD Billion), by Sub-Segment 1, 2018-2029
Figure 4: Global Chronic Pain Topical Analgesics Market Forecast (USD Billion), by Sub-Segment 2, 2018-2029
Figure 5: Global Chronic Pain Topical Analgesics Market Value Share (%), By Segment 2, 2022 & 2029
Figure 6: Global Chronic Pain Topical Analgesics Market Forecast (USD Billion), by Sub-Segment 1, 2018-2029
Figure 7: Global Chronic Pain Topical Analgesics Market Forecast (USD Billion), by Sub-Segment 2, 2018-2029
Figure 8: Global Chronic Pain Topical Analgesics Market Forecast (USD Billion), by Sub-Segment 3, 2018-2029
Figure 9: Global Chronic Pain Topical Analgesics Market Forecast (USD Billion), by Others, 2018-2029
Figure 10: Global Chronic Pain Topical Analgesics Market Value Share (%), By Segment 3, 2022 & 2029
Figure 11: Global Chronic Pain Topical Analgesics Market Forecast (USD Billion), by Sub-Segment 1, 2018-2029
Figure 12: Global Chronic Pain Topical Analgesics Market Forecast (USD Billion), by Sub-Segment 2, 2018-2029
Figure 13: Global Chronic Pain Topical Analgesics Market Forecast (USD Billion), by Sub-Segment 3, 2018-2029
Figure 14: Global Chronic Pain Topical Analgesics Market Forecast (USD Billion), by Others, 2018-2029
Figure 15: Global Chronic Pain Topical Analgesics Market Value (USD Billion), by Region, 2022 & 2029
Figure 16: North America Chronic Pain Topical Analgesics Market Value Share (%), By Segment 1, 2022 & 2029
Figure 17: North America Chronic Pain Topical Analgesics Market Forecast (USD Billion), by Sub-Segment 1, 2018-2029
Figure 18: North America Chronic Pain Topical Analgesics Market Forecast (USD Billion), by Sub-Segment 2, 2018-2029
Figure 19: North America Chronic Pain Topical Analgesics Market Value Share (%), By Segment 2, 2022 & 2029
Figure 20: North America Chronic Pain Topical Analgesics Market Forecast (USD Billion), by Sub-Segment 1, 2018-2029
Figure 21: North America Chronic Pain Topical Analgesics Market Forecast (USD Billion), by Sub-Segment 2, 2018-2029
Figure 22: North America Chronic Pain Topical Analgesics Market Forecast (USD Billion), by Sub-Segment 3, 2018-2029
Figure 23: North America Chronic Pain Topical Analgesics Market Forecast (USD Billion), by Others, 2018-2029
Figure 24: North America Chronic Pain Topical Analgesics Market Value Share (%), By Segment 3, 2022 & 2029
Figure 25: North America Chronic Pain Topical Analgesics Market Forecast (USD Billion), by Sub-Segment 1, 2018-2029
Figure 26: North America Chronic Pain Topical Analgesics Market Forecast (USD Billion), by Sub-Segment 2, 2018-2029
Figure 27: North America Chronic Pain Topical Analgesics Market Forecast (USD Billion), by Sub-Segment 3, 2018-2029
Figure 28: North America Chronic Pain Topical Analgesics Market Forecast (USD Billion), by Others, 2018-2029
Figure 29: North America Chronic Pain Topical Analgesics Market Forecast (USD Billion), by U.S., 2018-2029
Figure 30: North America Chronic Pain Topical Analgesics Market Forecast (USD Billion), by Canada, 2018-2029
Figure 31: Latin America Chronic Pain Topical Analgesics Market Value Share (%), By Segment 1, 2022 & 2029
Figure 32: Latin America Chronic Pain Topical Analgesics Market Forecast (USD Billion), by Sub-Segment 1, 2018-2029
Figure 33: Latin America Chronic Pain Topical Analgesics Market Forecast (USD Billion), by Sub-Segment 2, 2018-2029
Figure 34: Latin America Chronic Pain Topical Analgesics Market Value Share (%), By Segment 2, 2022 & 2029
Figure 35: Latin America Chronic Pain Topical Analgesics Market Forecast (USD Billion), by Sub-Segment 1, 2018-2029
Figure 36: Latin America Chronic Pain Topical Analgesics Market Forecast (USD Billion), by Sub-Segment 2, 2018-2029
Figure 37: Latin America Chronic Pain Topical Analgesics Market Forecast (USD Billion), by Sub-Segment 3, 2018-2029
Figure 38: Latin America Chronic Pain Topical Analgesics Market Forecast (USD Billion), by Others, 2018-2029
Figure 39: Latin America Chronic Pain Topical Analgesics Market Value Share (%), By Segment 3, 2022 & 2029
Figure 40: Latin America Chronic Pain Topical Analgesics Market Forecast (USD Billion), by Sub-Segment 1, 2018-2029
Figure 41: Latin America Chronic Pain Topical Analgesics Market Forecast (USD Billion), by Sub-Segment 2, 2018-2029
Figure 42: Latin America Chronic Pain Topical Analgesics Market Forecast (USD Billion), by Sub-Segment 3, 2018-2029
Figure 43: Latin America Chronic Pain Topical Analgesics Market Forecast (USD Billion), by Others, 2018-2029
Figure 44: Latin America Chronic Pain Topical Analgesics Market Forecast (USD Billion), by Brazil, 2018-2029
Figure 45: Latin America Chronic Pain Topical Analgesics Market Forecast (USD Billion), by Mexico, 2018-2029
Figure 46: Latin America Chronic Pain Topical Analgesics Market Forecast (USD Billion), by Rest of Latin America, 2018-2029
Figure 47: Europe Chronic Pain Topical Analgesics Market Value Share (%), By Segment 1, 2022 & 2029
Figure 48: Europe Chronic Pain Topical Analgesics Market Forecast (USD Billion), by Sub-Segment 1, 2018-2029
Figure 49: Europe Chronic Pain Topical Analgesics Market Forecast (USD Billion), by Sub-Segment 2, 2018-2029
Figure 50: Europe Chronic Pain Topical Analgesics Market Value Share (%), By Segment 2, 2022 & 2029
Figure 51: Europe Chronic Pain Topical Analgesics Market Forecast (USD Billion), by Sub-Segment 1, 2018-2029
Figure 52: Europe Chronic Pain Topical Analgesics Market Forecast (USD Billion), by Sub-Segment 2, 2018-2029
Figure 53: Europe Chronic Pain Topical Analgesics Market Forecast (USD Billion), by Sub-Segment 3, 2018-2029
Figure 54: Europe Chronic Pain Topical Analgesics Market Forecast (USD Billion), by Others, 2018-2029
Figure 55: Europe Chronic Pain Topical Analgesics Market Value Share (%), By Segment 3, 2022 & 2029
Figure 56: Europe Chronic Pain Topical Analgesics Market Forecast (USD Billion), by Sub-Segment 1, 2018-2029
Figure 57: Europe Chronic Pain Topical Analgesics Market Forecast (USD Billion), by Sub-Segment 2, 2018-2029
Figure 58: Europe Chronic Pain Topical Analgesics Market Forecast (USD Billion), by Sub-Segment 3, 2018-2029
Figure 59: Europe Chronic Pain Topical Analgesics Market Forecast (USD Billion), by Others, 2018-2029
Figure 60: Europe Chronic Pain Topical Analgesics Market Forecast (USD Billion), by U.K., 2018-2029
Figure 61: Europe Chronic Pain Topical Analgesics Market Forecast (USD Billion), by Germany, 2018-2029
Figure 62: Europe Chronic Pain Topical Analgesics Market Forecast (USD Billion), by France, 2018-2029
Figure 63: Europe Chronic Pain Topical Analgesics Market Forecast (USD Billion), by Italy, 2018-2029
Figure 64: Europe Chronic Pain Topical Analgesics Market Forecast (USD Billion), by Spain, 2018-2029
Figure 65: Europe Chronic Pain Topical Analgesics Market Forecast (USD Billion), by Russia, 2018-2029
Figure 66: Europe Chronic Pain Topical Analgesics Market Forecast (USD Billion), by Rest of Europe, 2018-2029
Figure 67: Asia Pacific Chronic Pain Topical Analgesics Market Value Share (%), By Segment 1, 2022 & 2029
Figure 68: Asia Pacific Chronic Pain Topical Analgesics Market Forecast (USD Billion), by Sub-Segment 1, 2018-2029
Figure 69: Asia Pacific Chronic Pain Topical Analgesics Market Forecast (USD Billion), by Sub-Segment 2, 2018-2029
Figure 70: Asia Pacific Chronic Pain Topical Analgesics Market Value Share (%), By Segment 2, 2022 & 2029
Figure 71: Asia Pacific Chronic Pain Topical Analgesics Market Forecast (USD Billion), by Sub-Segment 1, 2018-2029
Figure 72: Asia Pacific Chronic Pain Topical Analgesics Market Forecast (USD Billion), by Sub-Segment 2, 2018-2029
Figure 73: Asia Pacific Chronic Pain Topical Analgesics Market Forecast (USD Billion), by Sub-Segment 3, 2018-2029
Figure 74: Asia Pacific Chronic Pain Topical Analgesics Market Forecast (USD Billion), by Others, 2018-2029
Figure 75: Asia Pacific Chronic Pain Topical Analgesics Market Value Share (%), By Segment 3, 2022 & 2029
Figure 76: Asia Pacific Chronic Pain Topical Analgesics Market Forecast (USD Billion), by Sub-Segment 1, 2018-2029
Figure 77: Asia Pacific Chronic Pain Topical Analgesics Market Forecast (USD Billion), by Sub-Segment 2, 2018-2029
Figure 78: Asia Pacific Chronic Pain Topical Analgesics Market Forecast (USD Billion), by Sub-Segment 3, 2018-2029
Figure 79: Asia Pacific Chronic Pain Topical Analgesics Market Forecast (USD Billion), by Others, 2018-2029
Figure 80: Asia Pacific Chronic Pain Topical Analgesics Market Forecast (USD Billion), by China, 2018-2029
Figure 81: Asia Pacific Chronic Pain Topical Analgesics Market Forecast (USD Billion), by India, 2018-2029
Figure 82: Asia Pacific Chronic Pain Topical Analgesics Market Forecast (USD Billion), by Japan, 2018-2029
Figure 83: Asia Pacific Chronic Pain Topical Analgesics Market Forecast (USD Billion), by Australia, 2018-2029
Figure 84: Asia Pacific Chronic Pain Topical Analgesics Market Forecast (USD Billion), by Southeast Asia, 2018-2029
Figure 85: Asia Pacific Chronic Pain Topical Analgesics Market Forecast (USD Billion), by Rest of Asia Pacific, 2018-2029
Figure 86: Middle East & Africa Chronic Pain Topical Analgesics Market Value Share (%), By Segment 1, 2022 & 2029
Figure 87: Middle East & Africa Chronic Pain Topical Analgesics Market Forecast (USD Billion), by Sub-Segment 1, 2018-2029
Figure 88: Middle East & Africa Chronic Pain Topical Analgesics Market Forecast (USD Billion), by Sub-Segment 2, 2018-2029
Figure 89: Middle East & Africa Chronic Pain Topical Analgesics Market Value Share (%), By Segment 2, 2022 & 2029
Figure 90: Middle East & Africa Chronic Pain Topical Analgesics Market Forecast (USD Billion), by Sub-Segment 1, 2018-2029
Figure 91: Middle East & Africa Chronic Pain Topical Analgesics Market Forecast (USD Billion), by Sub-Segment 2, 2018-2029
Figure 92: Middle East & Africa Chronic Pain Topical Analgesics Market Forecast (USD Billion), by Sub-Segment 3, 2018-2029
Figure 93: Middle East & Africa Chronic Pain Topical Analgesics Market Forecast (USD Billion), by Others, 2018-2029
Figure 94: Middle East & Africa Chronic Pain Topical Analgesics Market Value Share (%), By Segment 3, 2022 & 2029
Figure 95: Middle East & Africa Chronic Pain Topical Analgesics Market Forecast (USD Billion), by Sub-Segment 1, 2018-2029
Figure 96: Middle East & Africa Chronic Pain Topical Analgesics Market Forecast (USD Billion), by Sub-Segment 2, 2018-2029
Figure 97: Middle East & Africa Chronic Pain Topical Analgesics Market Forecast (USD Billion), by Sub-Segment 3, 2018-2029
Figure 98: Middle East & Africa Chronic Pain Topical Analgesics Market Forecast (USD Billion), by Others, 2018-2029
Figure 99: Middle East & Africa Chronic Pain Topical Analgesics Market Forecast (USD Billion), by GCC, 2018-2029
Figure 100: Middle East & Africa Chronic Pain Topical Analgesics Market Forecast (USD Billion), by South Africa, 2018-2029
Figure 101: Middle East & Africa Chronic Pain Topical Analgesics Market Forecast (USD Billion), by Rest of Middle East & Africa, 2018-2029
List of Tables
Table 1: Global Chronic Pain Topical Analgesics Market Revenue (USD Billion) Forecast, by Segment 1, 2018-2029
Table 2: Global Chronic Pain Topical Analgesics Market Revenue (USD Billion) Forecast, by Segment 2, 2018-2029
Table 3: Global Chronic Pain Topical Analgesics Market Revenue (USD Billion) Forecast, by Segment 3, 2018-2029
Table 4: Global Chronic Pain Topical Analgesics Market Revenue (USD Billion) Forecast, by Region, 2018-2029
Table 5: North America Chronic Pain Topical Analgesics Market Revenue (USD Billion) Forecast, by Segment 1, 2018-2029
Table 6: North America Chronic Pain Topical Analgesics Market Revenue (USD Billion) Forecast, by Segment 2, 2018-2029
Table 7: North America Chronic Pain Topical Analgesics Market Revenue (USD Billion) Forecast, by Segment 3, 2018-2029
Table 8: North America Chronic Pain Topical Analgesics Market Revenue (USD Billion) Forecast, by Country, 2018-2029
Table 9: Europe Chronic Pain Topical Analgesics Market Revenue (USD Billion) Forecast, by Segment 1, 2018-2029
Table 10: Europe Chronic Pain Topical Analgesics Market Revenue (USD Billion) Forecast, by Segment 2, 2018-2029
Table 11: Europe Chronic Pain Topical Analgesics Market Revenue (USD Billion) Forecast, by Segment 3, 2018-2029
Table 12: Europe Chronic Pain Topical Analgesics Market Revenue (USD Billion) Forecast, by Country, 2018-2029
Table 13: Latin America Chronic Pain Topical Analgesics Market Revenue (USD Billion) Forecast, by Segment 1, 2018-2029
Table 14: Latin America Chronic Pain Topical Analgesics Market Revenue (USD Billion) Forecast, by Segment 2, 2018-2029
Table 15: Latin America Chronic Pain Topical Analgesics Market Revenue (USD Billion) Forecast, by Segment 3, 2018-2029
Table 16: Latin America Chronic Pain Topical Analgesics Market Revenue (USD Billion) Forecast, by Country, 2018-2029
Table 17: Asia Pacific Chronic Pain Topical Analgesics Market Revenue (USD Billion) Forecast, by Segment 1, 2018-2029
Table 18: Asia Pacific Chronic Pain Topical Analgesics Market Revenue (USD Billion) Forecast, by Segment 2, 2018-2029
Table 19: Asia Pacific Chronic Pain Topical Analgesics Market Revenue (USD Billion) Forecast, by Segment 3, 2018-2029
Table 20: Asia Pacific Chronic Pain Topical Analgesics Market Revenue (USD Billion) Forecast, by Country, 2018-2029
Table 21: Middle East & Africa Chronic Pain Topical Analgesics Market Revenue (USD Billion) Forecast, by Segment 1, 2018-2029
Table 22: Middle East & Africa Chronic Pain Topical Analgesics Market Revenue (USD Billion) Forecast, by Segment 2, 2018-2029
Table 23: Middle East & Africa Chronic Pain Topical Analgesics Market Revenue (USD Billion) Forecast, by Segment 3, 2018-2029
Table 24: Middle East & Africa Chronic Pain Topical Analgesics Market Revenue (USD Billion) Forecast, by Country, 2018-2029
Research Process
Data Library Research are conducted by industry experts who offer insight on
industry structure, market segmentations technology assessment and competitive landscape (CL), and penetration, as well as on emerging trends. Their analysis is based on primary interviews (~ 80%) and secondary research (~ 20%) as well as years of professional expertise in their respective industries. Adding to this, by analysing historical trends and current market positions, our analysts predict where the market will be headed for the next five years. Furthermore, the varying trends of segment & categories geographically presented are also studied and the estimated based on the primary & secondary research.
In this particular report from the supply side Data Library Research has conducted primary surveys (interviews) with the key level executives (VP, CEO’s, Marketing Director, Business Development Manager
and SOFT) of the companies that active & prominent as well as the midsized organization
FIGURE 1: DLR RESEARH PROCESS
![research-methodology1]()
Primary Research
Extensive primary research was conducted to gain a deeper insight of the market and industry performance. The analysis is based on both primary and secondary research as well as years of professional expertise in the respective industries.
In addition to analysing current and historical trends, our analysts predict where the market is headed over the next five years.
It varies by segment for these categories geographically presented in the list of market tables. Speaking about this particular report we have conducted primary surveys (interviews) with the key level executives (VP, CEO’s, Marketing Director, Business Development Manager and many more) of the major players active in the market.
Secondary Research
Secondary research was mainly used to collect and identify information useful for the extensive, technical, market-oriented, and Friend’s study of the Global Extra Neutral Alcohol. It was also used to obtain key information about major players, market classification and segmentation according to the industry trends, geographical markets, and developments related to the market and technology perspectives. For this study, analysts have gathered information from various credible sources, such as annual reports, sec filings, journals, white papers, SOFT presentations, and company web sites.
Market Size Estimation
Both, top-down and bottom-up approaches were used to estimate and validate the size of the Global market and to estimate the size of various other dependent submarkets in the overall Extra Neutral Alcohol. The key players in the market were identified through secondary research and their market contributions in the respective geographies were determined through primary and secondary research.
Forecast Model
![research-methodology2]()