Computing Platform for Automated Driving Market Overview and Analysis:
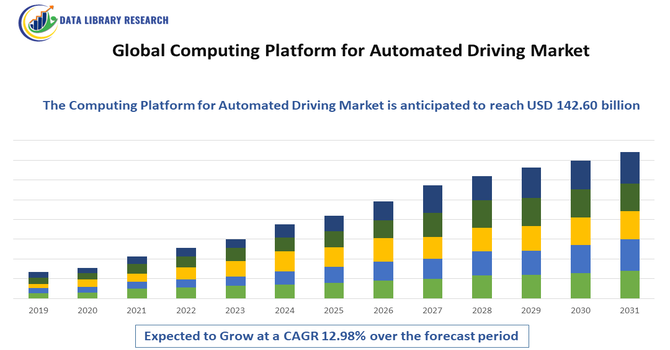
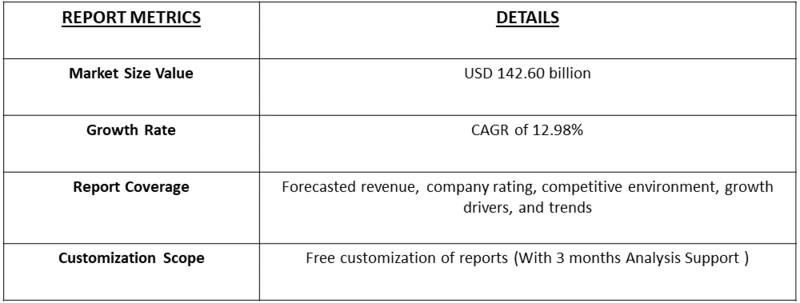
- The Global Computing Platform for Automated Driving Market size is projected to grow from USD 26.02 billion in 2025 to USD 142.60 billion by 2032, growing with a CAGR of 12.98% from 2025-2032.
Get Complete Analysis Of The Report - Download Updated Free Sample PDF
The Global Computing Platform for Automated Driving Market involves the hardware and software systems that support self-driving vehicles. These platforms process data from sensors and cameras to enable safe, efficient autonomous driving. They include powerful processors, artificial intelligence, and cloud connectivity. As automated driving technology advances, demand for reliable, high-performance computing platforms grows, driving innovation and adoption in the automotive and tech industries worldwide.
The growth of the Global Computing Platform for Automated Driving Market is driven by increasing demand for advanced driver assistance systems (ADAS) and fully autonomous vehicles. Rapid advancements in AI, machine learning, and sensor technologies enhance vehicle safety and efficiency, fueling adoption. Growing investments from automotive manufacturers and tech companies, coupled with government support for smart transportation and rising consumer interest in safer, convenient driving experiences, further accelerate market expansion worldwide.
Computing Platform for Automated Driving Market Latest Trends
The market is rapidly evolving with the integration of AI, edge computing, and 5G connectivity to enhance real-time data processing for autonomous vehicles. There is a strong shift toward scalable and modular computing platforms that support various levels of driving automation. Collaboration between automotive manufacturers, semiconductor firms, and software providers is increasing to develop more efficient, power-optimized platforms. The trend toward cloud-based computing and data sharing improves vehicle-to-everything (V2X) communication, boosting safety and navigation capabilities. Additionally, growing regulatory frameworks and standardization efforts globally are shaping market growth and technology adoption.
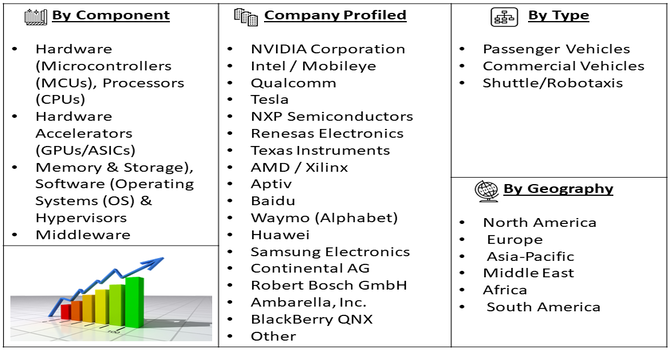
Segmentation: The Computing Platform for Automated Driving Market is Segmented by Component (Hardware (Microcontrollers (MCUs), Processors (CPUs), Hardware Accelerators (GPUs/ASICs), and Memory & Storage), Software (Operating Systems (OS) & Hypervisors, Middleware and Application Software & Algorithms), Autonomy Level (Level 2 (Partial Automation), Level 3 (Conditional Automation), Level 4 (High Automation), and Level 5 (Full Automation)), Vehicle Type (Passenger Vehicles, Commercial Vehicles and Shuttle/Robotaxis), and Geography (North America, Europe, Asia-Pacific, Middle East and Africa, and South America). The report provides the value (in USD million) for the above segments.
For Detailed Market Segmentation - Get a Free Sample PDF
Market Drivers:
- Increasing Adoption of Autonomous Vehicles
The Global Computing Platform for Automated Driving market is being driven by the rising adoption of autonomous and semi-autonomous vehicles worldwide. For instance, in September 2025, Valeo and Momenta signed a strategic partnership to jointly develop advanced mid- to high-level intelligent assisted and autonomous driving systems. The collaboration focused on creating products and solutions for both China and global markets. This partnership accelerated the adoption of autonomous vehicles and advanced computing platforms, strengthening the market for automated driving technologies and enhancing innovation in safety, navigation, and vehicle intelligence.
Consumers and fleet operators are increasingly demanding vehicles equipped with advanced driver assistance systems (ADAS) and self-driving capabilities to enhance safety, reduce accidents, and improve convenience. Automotive manufacturers are integrating high-performance computing platforms capable of processing real-time data from cameras, LiDAR, radar, and other sensors.
- Technological Advancements in AI and Edge Computing
Advancements in artificial intelligence, machine learning, and edge computing have significantly accelerated the growth of computing platforms for automated driving. For instance, in October 2025, NVIDIA collaborated with the U.S. Department of Energy and leading companies to build advanced AI infrastructure supporting scientific discovery and economic growth.
Thus, such initiatives accelerated technological advancements in AI and edge computing, enabling high-performance computing platforms crucial for autonomous driving. By scaling AI capabilities, the effort strengthened the development of computing platforms for automated vehicles, enhancing real-time data processing, vehicle intelligence, and the overall adoption of autonomous driving technologies. These technologies enable higher levels of vehicle automation, reduce latency, and support robust decision-making in complex driving scenarios.
Market Restraints
- High Cost and Integration Complexity
A major restraint for the market is the high cost of advanced computing platforms and the complexity of integrating them into vehicles. High-performance processors, AI accelerators, and sensor fusion systems significantly increase production expenses, which can make autonomous vehicles less accessible to the general consumer. Moreover, designing and integrating these platforms requires substantial R&D, software-hardware compatibility checks, and safety certifications. Variations in automotive architectures and regulatory compliance across regions further complicate deployment.
Socio-Economic Impact on Computing Platform for Automated Driving Market
Automated driving platforms have the potential to drastically reduce road accidents and fatalities, improving public safety. This technology could also enhance mobility for elderly and disabled populations, promoting inclusivity. Economically, it drives innovation and creates jobs in software development, hardware manufacturing, and data analytics sectors. However, automation may disrupt traditional driving-related jobs, requiring workforce reskilling. Reduced traffic congestion and emissions from optimized driving could benefit urban environments. Overall, these platforms promise improved quality of life, but governments and industries must address challenges around employment shifts and equitable technology access.
Segmental Analysis:
- Hardware Accelerators (GPUs/ASICs) segment is expected to witness the highest growth over the forecast period
The Hardware Accelerators segment, primarily comprising Graphics Processing Units (GPUs) and Application-Specific Integrated Circuits (ASICs), is poised for the strongest growth due to the non-negotiable need for massive, real-time computational power. Autonomous driving requires processing petabytes of data from cameras, LiDAR, and radar instantaneously to ensure safety. Only these specialized chips can execute the deep learning and neural network models necessary for precise object detection and path planning with the required low latency. As the industry advances from Level 2 to Level 3 and above, the demand for redundant, energy-efficient, and fail-operational compute units will escalate dramatically, making this hardware the central bottleneck and, consequently, the primary growth driver.
- Operating Systems (OS) & Hypervisors segment is expected to witness the highest growth over the forecast period
The OS and Hypervisors segment is critical for providing the necessary functional safety and reliability in autonomous platforms. The shift toward higher autonomy levels (L3 and L4) mandates that the software environment must be safe-by-design to prevent catastrophic failures. Hypervisors allow multiple critical and non-critical applications (like infotainment and driving control) to run on a single chip while remaining completely isolated from each other. This consolidation reduces hardware complexity and cost, while the safety-certified Real-Time Operating Systems (RTOS) ensure deterministic performance. This necessity for software-defined redundancy and system isolation drives the growth of robust, certified OS and hypervisor solutions.
- Level 3 (Conditional Automation) segment is expected to witness the highest growth over the forecast period
The Level 3 segment is anticipated to witness the highest near-term growth because it represents the first commercially viable threshold for true "hands-off" driving on highways and in congested traffic. Automakers are aggressively introducing L3 features to differentiate their high-end models, promising a significant increase in driver convenience and productivity. The L3 platform requires complex, specialized "fallback" systems that manage the transition of control between the vehicle and the human driver, which are computationally demanding. The introduction of these initial autonomous functions in consumer vehicles will rapidly scale volume, driving the platform market expansion.
- Commercial Vehicles segment is expected to witness the highest growth over the forecast period
The Commercial Vehicles segment, including long-haul trucks, logistics fleets, and robotaxis, is expected to see the highest growth due to a clear and compelling Return on Investment (ROI). Unlike passenger cars, autonomous commercial transport directly addresses operational pain points like driver shortage, fuel efficiency, and continuous operation time. Level 4 autonomous trucks, operating on fixed highway routes, offer significant cost savings, justifying the expensive high-end computing platforms. Furthermore, the contained Operational Design Domains (ODDs) for these fleets make L4 deployment technologically easier and safer to implement initially than in general consumer cars.
- North America Region is expected to witness the highest growth over the forecast period
The North America region is projected to lead market growth, underpinned by its technological leadership and significant financial investment. The United States is home to key industry giants such as NVIDIA, Intel (Mobileye), and Waymo, who are setting global standards for autonomous computing hardware and software.
Furthermore, the region benefits from a relatively favorable regulatory environment in states like California and Arizona, enabling extensive real-world testing and large-scale deployment of Level 4 robotaxi and trucking services. For instance, in 2022, NVIDIA introduced DRIVE Thor, a next-generation centralized computer for autonomous vehicles, delivering up to 2,000 teraflops of performance. It unified automated driving, assisted driving, infotainment, and occupant monitoring into a single architecture. Leveraging AI capabilities from Hopper GPU, Grace CPU, and Ada Lovelace GPU, DRIVE Thor enhanced domain isolation, enabling concurrent processes. This advancement accelerated AI, edge computing, and computing platforms for automated driving. This combination of deep R&D funding and early commercialization drives platform adoption at an unparalleled rate.
To Learn More About This Report - Request a Free Sample Copy
Computing Platform for Automated Driving Market Competitive Landscape
The market features intense competition among semiconductor companies, automotive OEMs, and tech giants developing comprehensive computing solutions. Leading players focus on innovations in AI chips, sensor fusion, and real-time processing capabilities to deliver high-performance platforms. Partnerships and alliances between hardware manufacturers and software developers are common to accelerate product development and deployment. Companies compete on reliability, power efficiency, scalability, and integration capabilities. Market leaders also invest heavily in R&D to stay ahead, while new entrants explore niche solutions such as specialized AI accelerators. This dynamic fosters rapid technological advancements and continuous market expansion.
The major players for this market are:
- NVIDIA Corporation
- Intel / Mobileye
- Qualcomm
- Tesla
- NXP Semiconductors
- Renesas Electronics
- Texas Instruments
- AMD / Xilinx
- Aptiv
- Baidu
- Waymo (Alphabet)
- Huawei
- Samsung Electronics
- Continental AG
- Robert Bosch GmbH
- Ambarella, Inc.
- BlackBerry QNX
- Infineon Technologies
- ZF Friedrichshafen
- Horizon Robotics
Recent Development
- In October 2025, NVIDIA partnered with Uber to scale the world’s largest Level 4-ready mobility network, leveraging its next-generation robotaxi and autonomous delivery fleets. The collaboration utilized NVIDIA’s DRIVE AGX Hyperion 10 autonomous vehicle development platform and DRIVE AV software, purpose-built for L4 autonomy, enabling advanced self-driving capabilities and supporting the deployment of highly automated transport solutions at scale.
- In September 2025, Qualcomm Technologies and BMW Group introduced the Snapdragon Ride Pilot, an automated driving system developed over three years. Built on Qualcomm’s Snapdragon Ride SoCs and co-developed software, it supported AD levels from entry-level NCAP to Level 2+ navigation. The system debuted in the BMW iX3, validated in over 60 countries, and was made available to global automakers and Tier-1 suppliers for expansion.
Frequently Asked Questions (FAQ) :
Q1. What are the main growth-driving factors for this market?
The primary driver is the intense, multi-billion dollar race among automakers and tech firms to achieve higher levels of vehicle autonomy (Level 3, 4, and 5). Growth is also fueled by falling costs of key hardware, such as LiDAR and specialized chips, making advanced systems more feasible. Furthermore, increasing consumer acceptance of driver assistance systems establishes a foundation for fully automated capabilities.
Q2. What are the main restraining factors for this market?
A key constraint is the huge investment required for validation and testing to ensure safety under all weather and road conditions. The market also struggles with the lack of standardized global regulations regarding vehicle liability in autonomous accidents, creating legal uncertainty. Additionally, the high processing power demands require specialized, costly, and energy-intensive computing platforms.
Q3. Which segment is expected to witness high growth?
The Hardware Accelerators (GPUs/ASICs) Segment is projected to witness the highest growth. These specialized chips are necessary to handle the massive, real-time data processing required by sensors like cameras and LiDAR. Driven by the shift from Level 2 to Level 3/4 autonomy, the need for instantaneous, fail-safe decision-making power ensures demand for powerful, dedicated processing units will rapidly increase.
Q4. Who are the top major players for this market?
The market is dominated by semiconductor and specialized computing companies supplying automakers. Top major players include NVIDIA Corporation (Drive Platform), Intel Corporation (Mobileye), Qualcomm (Snapdragon Ride), and Tesla (with its custom FSD Chip). Competition centers on offering the most powerful and energy-efficient system-on-chips (SoCs), along with comprehensive software stacks and tools to help automakers rapidly develop and deploy their algorithms.
Q5. Which country is the largest player?
The United States is the largest country player. This dominance stems from the country's leading position in AI and semiconductor technology, with companies like NVIDIA and Intel driving innovation. The U.S. also has the largest number of autonomous vehicle testing and R&D deployments, supported by huge investments from technology giants and a regulatory environment (in certain states) that favors pilot programs.
List of Figures
Figure 1: Global Computing Platform for Automated Driving Market Revenue Breakdown (USD Billion, %) by Region, 2022 & 2029
Figure 2: Global Computing Platform for Automated Driving Market Value Share (%), By Segment 1, 2022 & 2029
Figure 3: Global Computing Platform for Automated Driving Market Forecast (USD Billion), by Sub-Segment 1, 2018-2029
Figure 4: Global Computing Platform for Automated Driving Market Forecast (USD Billion), by Sub-Segment 2, 2018-2029
Figure 5: Global Computing Platform for Automated Driving Market Value Share (%), By Segment 2, 2022 & 2029
Figure 6: Global Computing Platform for Automated Driving Market Forecast (USD Billion), by Sub-Segment 1, 2018-2029
Figure 7: Global Computing Platform for Automated Driving Market Forecast (USD Billion), by Sub-Segment 2, 2018-2029
Figure 8: Global Computing Platform for Automated Driving Market Forecast (USD Billion), by Sub-Segment 3, 2018-2029
Figure 9: Global Computing Platform for Automated Driving Market Forecast (USD Billion), by Others, 2018-2029
Figure 10: Global Computing Platform for Automated Driving Market Value Share (%), By Segment 3, 2022 & 2029
Figure 11: Global Computing Platform for Automated Driving Market Forecast (USD Billion), by Sub-Segment 1, 2018-2029
Figure 12: Global Computing Platform for Automated Driving Market Forecast (USD Billion), by Sub-Segment 2, 2018-2029
Figure 13: Global Computing Platform for Automated Driving Market Forecast (USD Billion), by Sub-Segment 3, 2018-2029
Figure 14: Global Computing Platform for Automated Driving Market Forecast (USD Billion), by Others, 2018-2029
Figure 15: Global Computing Platform for Automated Driving Market Value (USD Billion), by Region, 2022 & 2029
Figure 16: North America Computing Platform for Automated Driving Market Value Share (%), By Segment 1, 2022 & 2029
Figure 17: North America Computing Platform for Automated Driving Market Forecast (USD Billion), by Sub-Segment 1, 2018-2029
Figure 18: North America Computing Platform for Automated Driving Market Forecast (USD Billion), by Sub-Segment 2, 2018-2029
Figure 19: North America Computing Platform for Automated Driving Market Value Share (%), By Segment 2, 2022 & 2029
Figure 20: North America Computing Platform for Automated Driving Market Forecast (USD Billion), by Sub-Segment 1, 2018-2029
Figure 21: North America Computing Platform for Automated Driving Market Forecast (USD Billion), by Sub-Segment 2, 2018-2029
Figure 22: North America Computing Platform for Automated Driving Market Forecast (USD Billion), by Sub-Segment 3, 2018-2029
Figure 23: North America Computing Platform for Automated Driving Market Forecast (USD Billion), by Others, 2018-2029
Figure 24: North America Computing Platform for Automated Driving Market Value Share (%), By Segment 3, 2022 & 2029
Figure 25: North America Computing Platform for Automated Driving Market Forecast (USD Billion), by Sub-Segment 1, 2018-2029
Figure 26: North America Computing Platform for Automated Driving Market Forecast (USD Billion), by Sub-Segment 2, 2018-2029
Figure 27: North America Computing Platform for Automated Driving Market Forecast (USD Billion), by Sub-Segment 3, 2018-2029
Figure 28: North America Computing Platform for Automated Driving Market Forecast (USD Billion), by Others, 2018-2029
Figure 29: North America Computing Platform for Automated Driving Market Forecast (USD Billion), by U.S., 2018-2029
Figure 30: North America Computing Platform for Automated Driving Market Forecast (USD Billion), by Canada, 2018-2029
Figure 31: Latin America Computing Platform for Automated Driving Market Value Share (%), By Segment 1, 2022 & 2029
Figure 32: Latin America Computing Platform for Automated Driving Market Forecast (USD Billion), by Sub-Segment 1, 2018-2029
Figure 33: Latin America Computing Platform for Automated Driving Market Forecast (USD Billion), by Sub-Segment 2, 2018-2029
Figure 34: Latin America Computing Platform for Automated Driving Market Value Share (%), By Segment 2, 2022 & 2029
Figure 35: Latin America Computing Platform for Automated Driving Market Forecast (USD Billion), by Sub-Segment 1, 2018-2029
Figure 36: Latin America Computing Platform for Automated Driving Market Forecast (USD Billion), by Sub-Segment 2, 2018-2029
Figure 37: Latin America Computing Platform for Automated Driving Market Forecast (USD Billion), by Sub-Segment 3, 2018-2029
Figure 38: Latin America Computing Platform for Automated Driving Market Forecast (USD Billion), by Others, 2018-2029
Figure 39: Latin America Computing Platform for Automated Driving Market Value Share (%), By Segment 3, 2022 & 2029
Figure 40: Latin America Computing Platform for Automated Driving Market Forecast (USD Billion), by Sub-Segment 1, 2018-2029
Figure 41: Latin America Computing Platform for Automated Driving Market Forecast (USD Billion), by Sub-Segment 2, 2018-2029
Figure 42: Latin America Computing Platform for Automated Driving Market Forecast (USD Billion), by Sub-Segment 3, 2018-2029
Figure 43: Latin America Computing Platform for Automated Driving Market Forecast (USD Billion), by Others, 2018-2029
Figure 44: Latin America Computing Platform for Automated Driving Market Forecast (USD Billion), by Brazil, 2018-2029
Figure 45: Latin America Computing Platform for Automated Driving Market Forecast (USD Billion), by Mexico, 2018-2029
Figure 46: Latin America Computing Platform for Automated Driving Market Forecast (USD Billion), by Rest of Latin America, 2018-2029
Figure 47: Europe Computing Platform for Automated Driving Market Value Share (%), By Segment 1, 2022 & 2029
Figure 48: Europe Computing Platform for Automated Driving Market Forecast (USD Billion), by Sub-Segment 1, 2018-2029
Figure 49: Europe Computing Platform for Automated Driving Market Forecast (USD Billion), by Sub-Segment 2, 2018-2029
Figure 50: Europe Computing Platform for Automated Driving Market Value Share (%), By Segment 2, 2022 & 2029
Figure 51: Europe Computing Platform for Automated Driving Market Forecast (USD Billion), by Sub-Segment 1, 2018-2029
Figure 52: Europe Computing Platform for Automated Driving Market Forecast (USD Billion), by Sub-Segment 2, 2018-2029
Figure 53: Europe Computing Platform for Automated Driving Market Forecast (USD Billion), by Sub-Segment 3, 2018-2029
Figure 54: Europe Computing Platform for Automated Driving Market Forecast (USD Billion), by Others, 2018-2029
Figure 55: Europe Computing Platform for Automated Driving Market Value Share (%), By Segment 3, 2022 & 2029
Figure 56: Europe Computing Platform for Automated Driving Market Forecast (USD Billion), by Sub-Segment 1, 2018-2029
Figure 57: Europe Computing Platform for Automated Driving Market Forecast (USD Billion), by Sub-Segment 2, 2018-2029
Figure 58: Europe Computing Platform for Automated Driving Market Forecast (USD Billion), by Sub-Segment 3, 2018-2029
Figure 59: Europe Computing Platform for Automated Driving Market Forecast (USD Billion), by Others, 2018-2029
Figure 60: Europe Computing Platform for Automated Driving Market Forecast (USD Billion), by U.K., 2018-2029
Figure 61: Europe Computing Platform for Automated Driving Market Forecast (USD Billion), by Germany, 2018-2029
Figure 62: Europe Computing Platform for Automated Driving Market Forecast (USD Billion), by France, 2018-2029
Figure 63: Europe Computing Platform for Automated Driving Market Forecast (USD Billion), by Italy, 2018-2029
Figure 64: Europe Computing Platform for Automated Driving Market Forecast (USD Billion), by Spain, 2018-2029
Figure 65: Europe Computing Platform for Automated Driving Market Forecast (USD Billion), by Russia, 2018-2029
Figure 66: Europe Computing Platform for Automated Driving Market Forecast (USD Billion), by Rest of Europe, 2018-2029
Figure 67: Asia Pacific Computing Platform for Automated Driving Market Value Share (%), By Segment 1, 2022 & 2029
Figure 68: Asia Pacific Computing Platform for Automated Driving Market Forecast (USD Billion), by Sub-Segment 1, 2018-2029
Figure 69: Asia Pacific Computing Platform for Automated Driving Market Forecast (USD Billion), by Sub-Segment 2, 2018-2029
Figure 70: Asia Pacific Computing Platform for Automated Driving Market Value Share (%), By Segment 2, 2022 & 2029
Figure 71: Asia Pacific Computing Platform for Automated Driving Market Forecast (USD Billion), by Sub-Segment 1, 2018-2029
Figure 72: Asia Pacific Computing Platform for Automated Driving Market Forecast (USD Billion), by Sub-Segment 2, 2018-2029
Figure 73: Asia Pacific Computing Platform for Automated Driving Market Forecast (USD Billion), by Sub-Segment 3, 2018-2029
Figure 74: Asia Pacific Computing Platform for Automated Driving Market Forecast (USD Billion), by Others, 2018-2029
Figure 75: Asia Pacific Computing Platform for Automated Driving Market Value Share (%), By Segment 3, 2022 & 2029
Figure 76: Asia Pacific Computing Platform for Automated Driving Market Forecast (USD Billion), by Sub-Segment 1, 2018-2029
Figure 77: Asia Pacific Computing Platform for Automated Driving Market Forecast (USD Billion), by Sub-Segment 2, 2018-2029
Figure 78: Asia Pacific Computing Platform for Automated Driving Market Forecast (USD Billion), by Sub-Segment 3, 2018-2029
Figure 79: Asia Pacific Computing Platform for Automated Driving Market Forecast (USD Billion), by Others, 2018-2029
Figure 80: Asia Pacific Computing Platform for Automated Driving Market Forecast (USD Billion), by China, 2018-2029
Figure 81: Asia Pacific Computing Platform for Automated Driving Market Forecast (USD Billion), by India, 2018-2029
Figure 82: Asia Pacific Computing Platform for Automated Driving Market Forecast (USD Billion), by Japan, 2018-2029
Figure 83: Asia Pacific Computing Platform for Automated Driving Market Forecast (USD Billion), by Australia, 2018-2029
Figure 84: Asia Pacific Computing Platform for Automated Driving Market Forecast (USD Billion), by Southeast Asia, 2018-2029
Figure 85: Asia Pacific Computing Platform for Automated Driving Market Forecast (USD Billion), by Rest of Asia Pacific, 2018-2029
Figure 86: Middle East & Africa Computing Platform for Automated Driving Market Value Share (%), By Segment 1, 2022 & 2029
Figure 87: Middle East & Africa Computing Platform for Automated Driving Market Forecast (USD Billion), by Sub-Segment 1, 2018-2029
Figure 88: Middle East & Africa Computing Platform for Automated Driving Market Forecast (USD Billion), by Sub-Segment 2, 2018-2029
Figure 89: Middle East & Africa Computing Platform for Automated Driving Market Value Share (%), By Segment 2, 2022 & 2029
Figure 90: Middle East & Africa Computing Platform for Automated Driving Market Forecast (USD Billion), by Sub-Segment 1, 2018-2029
Figure 91: Middle East & Africa Computing Platform for Automated Driving Market Forecast (USD Billion), by Sub-Segment 2, 2018-2029
Figure 92: Middle East & Africa Computing Platform for Automated Driving Market Forecast (USD Billion), by Sub-Segment 3, 2018-2029
Figure 93: Middle East & Africa Computing Platform for Automated Driving Market Forecast (USD Billion), by Others, 2018-2029
Figure 94: Middle East & Africa Computing Platform for Automated Driving Market Value Share (%), By Segment 3, 2022 & 2029
Figure 95: Middle East & Africa Computing Platform for Automated Driving Market Forecast (USD Billion), by Sub-Segment 1, 2018-2029
Figure 96: Middle East & Africa Computing Platform for Automated Driving Market Forecast (USD Billion), by Sub-Segment 2, 2018-2029
Figure 97: Middle East & Africa Computing Platform for Automated Driving Market Forecast (USD Billion), by Sub-Segment 3, 2018-2029
Figure 98: Middle East & Africa Computing Platform for Automated Driving Market Forecast (USD Billion), by Others, 2018-2029
Figure 99: Middle East & Africa Computing Platform for Automated Driving Market Forecast (USD Billion), by GCC, 2018-2029
Figure 100: Middle East & Africa Computing Platform for Automated Driving Market Forecast (USD Billion), by South Africa, 2018-2029
Figure 101: Middle East & Africa Computing Platform for Automated Driving Market Forecast (USD Billion), by Rest of Middle East & Africa, 2018-2029
List of Tables
Table 1: Global Computing Platform for Automated Driving Market Revenue (USD Billion) Forecast, by Segment 1, 2018-2029
Table 2: Global Computing Platform for Automated Driving Market Revenue (USD Billion) Forecast, by Segment 2, 2018-2029
Table 3: Global Computing Platform for Automated Driving Market Revenue (USD Billion) Forecast, by Segment 3, 2018-2029
Table 4: Global Computing Platform for Automated Driving Market Revenue (USD Billion) Forecast, by Region, 2018-2029
Table 5: North America Computing Platform for Automated Driving Market Revenue (USD Billion) Forecast, by Segment 1, 2018-2029
Table 6: North America Computing Platform for Automated Driving Market Revenue (USD Billion) Forecast, by Segment 2, 2018-2029
Table 7: North America Computing Platform for Automated Driving Market Revenue (USD Billion) Forecast, by Segment 3, 2018-2029
Table 8: North America Computing Platform for Automated Driving Market Revenue (USD Billion) Forecast, by Country, 2018-2029
Table 9: Europe Computing Platform for Automated Driving Market Revenue (USD Billion) Forecast, by Segment 1, 2018-2029
Table 10: Europe Computing Platform for Automated Driving Market Revenue (USD Billion) Forecast, by Segment 2, 2018-2029
Table 11: Europe Computing Platform for Automated Driving Market Revenue (USD Billion) Forecast, by Segment 3, 2018-2029
Table 12: Europe Computing Platform for Automated Driving Market Revenue (USD Billion) Forecast, by Country, 2018-2029
Table 13: Latin America Computing Platform for Automated Driving Market Revenue (USD Billion) Forecast, by Segment 1, 2018-2029
Table 14: Latin America Computing Platform for Automated Driving Market Revenue (USD Billion) Forecast, by Segment 2, 2018-2029
Table 15: Latin America Computing Platform for Automated Driving Market Revenue (USD Billion) Forecast, by Segment 3, 2018-2029
Table 16: Latin America Computing Platform for Automated Driving Market Revenue (USD Billion) Forecast, by Country, 2018-2029
Table 17: Asia Pacific Computing Platform for Automated Driving Market Revenue (USD Billion) Forecast, by Segment 1, 2018-2029
Table 18: Asia Pacific Computing Platform for Automated Driving Market Revenue (USD Billion) Forecast, by Segment 2, 2018-2029
Table 19: Asia Pacific Computing Platform for Automated Driving Market Revenue (USD Billion) Forecast, by Segment 3, 2018-2029
Table 20: Asia Pacific Computing Platform for Automated Driving Market Revenue (USD Billion) Forecast, by Country, 2018-2029
Table 21: Middle East & Africa Computing Platform for Automated Driving Market Revenue (USD Billion) Forecast, by Segment 1, 2018-2029
Table 22: Middle East & Africa Computing Platform for Automated Driving Market Revenue (USD Billion) Forecast, by Segment 2, 2018-2029
Table 23: Middle East & Africa Computing Platform for Automated Driving Market Revenue (USD Billion) Forecast, by Segment 3, 2018-2029
Table 24: Middle East & Africa Computing Platform for Automated Driving Market Revenue (USD Billion) Forecast, by Country, 2018-2029
Research Process
Data Library Research are conducted by industry experts who offer insight on
industry structure, market segmentations technology assessment and competitive landscape (CL), and penetration, as well as on emerging trends. Their analysis is based on primary interviews (~ 80%) and secondary research (~ 20%) as well as years of professional expertise in their respective industries. Adding to this, by analysing historical trends and current market positions, our analysts predict where the market will be headed for the next five years. Furthermore, the varying trends of segment & categories geographically presented are also studied and the estimated based on the primary & secondary research.
In this particular report from the supply side Data Library Research has conducted primary surveys (interviews) with the key level executives (VP, CEO’s, Marketing Director, Business Development Manager
and SOFT) of the companies that active & prominent as well as the midsized organization
FIGURE 1: DLR RESEARH PROCESS
![research-methodology1]()
Primary Research
Extensive primary research was conducted to gain a deeper insight of the market and industry performance. The analysis is based on both primary and secondary research as well as years of professional expertise in the respective industries.
In addition to analysing current and historical trends, our analysts predict where the market is headed over the next five years.
It varies by segment for these categories geographically presented in the list of market tables. Speaking about this particular report we have conducted primary surveys (interviews) with the key level executives (VP, CEO’s, Marketing Director, Business Development Manager and many more) of the major players active in the market.
Secondary Research
Secondary research was mainly used to collect and identify information useful for the extensive, technical, market-oriented, and Friend’s study of the Global Extra Neutral Alcohol. It was also used to obtain key information about major players, market classification and segmentation according to the industry trends, geographical markets, and developments related to the market and technology perspectives. For this study, analysts have gathered information from various credible sources, such as annual reports, sec filings, journals, white papers, SOFT presentations, and company web sites.
Market Size Estimation
Both, top-down and bottom-up approaches were used to estimate and validate the size of the Global market and to estimate the size of various other dependent submarkets in the overall Extra Neutral Alcohol. The key players in the market were identified through secondary research and their market contributions in the respective geographies were determined through primary and secondary research.
Forecast Model
![research-methodology2]()