Corona Discharge Surface Treatment Machine Market Overview and Analysis
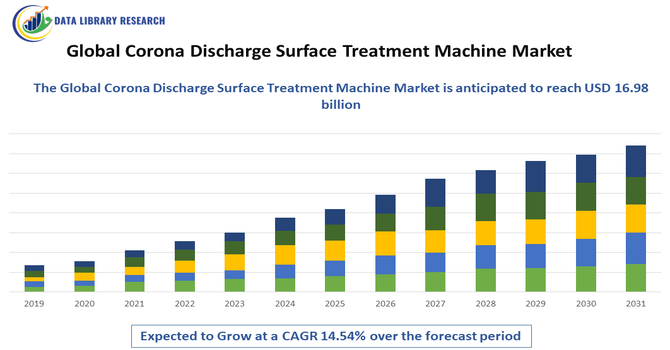
The Global Corona Discharge Surface Treatment Machine Market, worth 8.07 billion in 2025, is projected to grow at a CAGR of 14.54% from 2025 to 2032, reaching USD 16.98 billion in 2032.
Get Complete Analysis Of The Report - Download Updated Free Sample PDF
The growth of the Global Corona Discharge Surface Treatment Machine Market is primarily driven by the increasing demand for surface treatment solutions in the packaging, printing, and automotive industries. Corona discharge machines are essential for improving surface wettability and adhesion on materials such as plastics, films, and nonwoven fabrics, which are widely used in packaging and labeling applications.
Corona Discharge Surface Treatment Machine Market Latest Trends
The Global Corona Discharge Surface Treatment Machine Market is witnessing key trends driven by the need for enhanced surface adhesion, automation, and energy efficiency. Manufacturers are increasingly adopting high-speed, automated corona treatment systems that ensure consistent treatment quality on plastics, films, and nonwoven materials, supporting inline production and reducing operational downtime. There is also a growing focus on eco-friendly and low-maintenance machines to minimize energy consumption and environmental impact. Additionally, integration with digital monitoring and process control technologies allows precise treatment adjustments, improving efficiency and product quality.
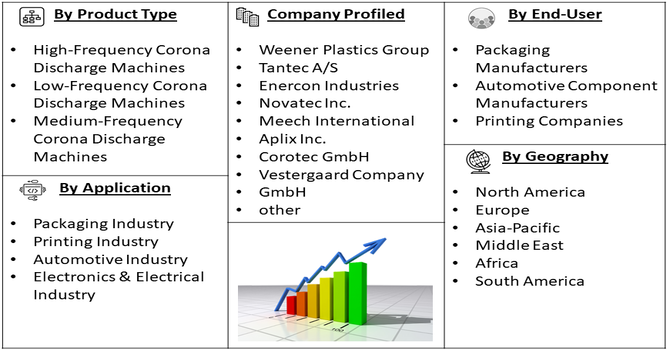
Segmentation: Global Corona Discharge Surface Treatment Machine Market is segmented By Machine Type (High-Frequency Corona Discharge Machines, Low-Frequency Corona Discharge Machines, Medium-Frequency Corona Discharge Machines), Application (Packaging Industry, Printing Industry, Automotive Industry, Electronics & Electrical Industry), End-User (Packaging Manufacturers, Automotive Component Manufacturers, Printing Companies), and Geography (North America, Europe, Asia-Pacific, Middle East and Africa, and South America). The report provides the value (in USD million) for the above segments.
For Detailed Market Segmentation - Get a Free Sample PDF
Market Drivers:
- Growing Demand for High-Quality Packaging and Printing Applications
The increasing demand for flexible and durable packaging materials, such as plastic films, laminates, and nonwoven fabrics, is driving the adoption of corona discharge surface treatment machines. These machines improve surface energy and adhesion, allowing inks, coatings, and adhesives to bond effectively. With the rapid growth of the food, beverage, pharmaceutical, and e-commerce packaging sectors, manufacturers require consistent and high-quality surface treatment to ensure product safety, durability, and aesthetic appeal. Additionally, rising global demand for printed packaging, labels, and decorative films is further boosting the need for efficient corona treatment solutions.
- Expansion of Automotive and Electronics Industries
The automotive and electronics industries increasingly use plastic components, films, and nonwoven materials that require surface treatment for coatings, adhesives, and functional finishes. Corona discharge machines enhance adhesion properties, ensuring durability and performance of automotive interior/exterior parts, electronic device housings, and protective films. Rapid industrialization, growing vehicle production, and increasing consumer electronics demand, particularly in emerging economies, are driving the adoption of advanced corona treatment technologies. This trend is further supported by technological innovations in high-speed, automated, and energy-efficient machines that improve productivity and reduce operational costs for manufacturers.
Market Restraints:
- High Initial Investment and Maintenance Costs
A significant restraint for the corona discharge surface treatment market is the high capital expenditure required to acquire advanced treatment machines, especially high-frequency and automated systems. These machines involve sophisticated components and technologies, which increase purchase costs. Additionally, regular maintenance, electrode replacement, and power consumption add to operational expenses, making it challenging for small and medium-sized manufacturers to adopt these solutions. The high upfront and ongoing costs can limit market penetration, particularly in developing regions where budget constraints are more pronounced.
Socioeconomic Impact on Corona Discharge Surface Treatment Machine Market
The global corona discharge surface treatment machine market has had significant socioeconomic impacts by enhancing manufacturing efficiency, product quality, and industrial competitiveness across sectors such as packaging, automotive, electronics, and printing. By improving surface adhesion and coating performance, these machines have reduced material waste and production costs, supporting more sustainable manufacturing practices. Their adoption has stimulated job creation in engineering, maintenance, and technical services while fostering innovation in polymer processing and surface engineering technologies. Improved product durability and functionality have benefited consumers and businesses alike, driving economic growth and industrial modernization.
Segmental Analysis
- High-Frequency Corona Discharge Machines segment is expected to witness highest growth over the forecast period
High-frequency corona discharge machines are widely adopted due to their efficiency, precision, and ability to treat a variety of materials, including plastics, films, and nonwoven fabrics. These machines offer superior surface energy enhancement, which ensures better adhesion of inks, coatings, and adhesives. Their compatibility with inline production systems and ability to maintain consistent treatment quality make them ideal for large-scale industrial applications, particularly in packaging and printing industries where uniform surface treatment is critical.
- Packaging Industry segment is expected to witness highest growth over the forecast period
The packaging industry is a major driver for corona discharge machines, as treated surfaces improve adhesion of inks, coatings, and laminates on flexible films, plastics, and other packaging materials. Growing demand for food, beverage, and pharmaceutical packaging, coupled with the rise of e-commerce requiring durable and high-quality packaging, is significantly boosting the adoption of corona treatment machines to enhance product appearance, durability, and safety.
- Packaging Manufacturers segment is expected to witness highest growth over the forecast period
Packaging manufacturers form the largest end-user group, relying on corona discharge machines to improve the quality and functionality of their products. By ensuring proper surface treatment, these manufacturers can produce packaging that meets regulatory standards, improves printability, and ensures adhesive performance. The increasing demand for high-quality packaging solutions in global markets is driving investments in advanced corona treatment technologies among manufacturers.
- North America segment is expected to witness highest growth over the forecast period
North America is a key regional segment due to its advanced manufacturing infrastructure, high adoption of automated systems, and strong industrial base. The region has a significant demand for packaging, automotive, and electronics applications requiring surface treatment. Moreover, strict regulatory requirements and a focus on product quality and innovation are driving the adoption of high-performance corona discharge machines, making North America a leading market for this technology.
Furthermore, the presence of major industry players, research institutions, and technology providers in North America has fostered continuous innovation and development of advanced corona discharge surface treatment machines. Rising investment in smart manufacturing, Industry 4.0 initiatives, and sustainable production practices has further accelerated market growth, enabling manufacturers to enhance efficiency, reduce defects, and meet evolving consumer and regulatory demands.
| Market Size Value |
USD 16.98 billion |
| Growth Rate |
CAGR of 14.54 % |
| Forecast |
2026-2033 |
| Historical data |
2021-2024 |
| Base Year |
2025 |
| Report Coverage |
Forecasted revenue, company rating, competitive environment, growth drivers, and trends |
| Segment Coverage |
Type, Application, End-User, Geography |
| Regional Scope |
North America, Europe, Asia Pacific, Middle East |
| Customized scope |
Free customization of reports (With 3 months' Analysis Support ) |
| To Learn More About This Report |
Request a Free Sample Copy |
Corona Discharge Surface Treatment Machine Market Competitive Landscape
The competitive landscape of the Global Corona Discharge Surface Treatment Machine Market is characterized by the presence of specialized equipment manufacturers and technology solution providers focusing on innovation, energy efficiency, and precision surface treatment. Companies compete on machine performance, automation capabilities, energy consumption, and after-sales support to meet the increasing demand from packaging, printing, automotive, and electronics industries. Strategic collaborations with end-users, investment in research and development for high-speed and eco-friendly machines, and expansion into emerging markets are key strategies for gaining market share. The market is moderately consolidated, with leading players dominating global supply chains.
Key Players:
- Weener Plastics Group
- Tantec A/S
- Enercon Industries
- Novatec Inc.
- Meech International
- Aplix Inc.
- Corotec GmbH
- Vestergaard Company
- MEEC GmbH
- IBL-Industrie-Elektronik GmbH
- Kisco International, Inc.
- ION Systems GmbH
- Techno Surface Engineering
- Delta Corona
- Fraunhofer FEP
- PPM Technologies
- IMC Group
- Dürr Systems AG
- Santec Corporation
- DSE Surface Treatment Technologies
Recent Development
- In May 2025, research published in journal Scientific Reports, stated that multi-scale simulation of corona discharge and its electromagnetic (EM) characteristics in gas-insulated equipment offers critical insights for the global corona discharge surface treatment machine market. By understanding how voltage, temperature, and geometry affect discharge behavior and EM wave generation, manufacturers can optimize machine design, enhance treatment precision, improve efficiency, and develop more reliable, high-performance surface treatment solutions.
- In November 2024, research published in journal in Electrical Engineering, reported that corona discharge (CD) detection in medium-voltage switchboards highlights advancements in diagnostic methods, influencing the global corona discharge surface treatment machine market by driving innovation in machine design, monitoring, and efficiency. Insights into detection mechanisms, environmental factors, and severity assessment support improved process control, reliability, and adoption of high-performance surface treatment solutions across industries.
Frequently Asked Questions (FAQ) :
Q1. What are the main growth-driving factors for this market?
The market is primarily driven by the escalating demand for advanced surface treatment technologies to improve the adhesion and printability of materials, especially in the growing packaging industry. Rapid industrialization and manufacturing expansion across Asia-Pacific, coupled with the increasing need for high-quality printing on films and fabrics, significantly contribute to market growth.
Q2. What are the main restraining factors for this market?
Restraining factors include the high initial investment cost required for corona treatment equipment, which can be prohibitive for small-to-medium enterprises. Additionally, the increasing competition from alternative surface modification techniques, such as cold plasma treatment, which can offer greater control and versatility for certain materials, may limit growth.
Q3. Which segment is expected to witness high growth?
The highest growth is anticipated within the Packaging application segment. This is due to the rising global consumption of packaged goods and the continuous need for better surface tension on plastic films and foils for high-speed printing, coating, and lamination processes. The demand for narrow web systems also sees strong momentum.
Q4. Who are the top major players for this market?
Key participants in the competitive landscape include specialized technology providers focusing on surface treatment solutions. Top major players often cited are Enercon Industries, Tantec, Baldwin Ahlbrandt, Pillar Technologies (ITW), and Plasmatreat. These companies specialize in developing and manufacturing the core corona discharge equipment and systems.
Q5. Which country is the largest player?
While North America has a strong presence, the Asia-Pacific region is consistently identified as the fastest-growing and often the largest regional market due to its robust manufacturing base. Rapid industrialization in countries like China and India, especially within the vast packaging and electronics sectors, drives the majority of the equipment demand.
List of Figures
Figure 1: Global Corona Discharge Surface Treatment Machine Market Revenue Breakdown (USD Billion, %) by Region, 2022 & 2029
Figure 2: Global Corona Discharge Surface Treatment Machine Market Value Share (%), By Segment 1, 2022 & 2029
Figure 3: Global Corona Discharge Surface Treatment Machine Market Forecast (USD Billion), by Sub-Segment 1, 2018-2029
Figure 4: Global Corona Discharge Surface Treatment Machine Market Forecast (USD Billion), by Sub-Segment 2, 2018-2029
Figure 5: Global Corona Discharge Surface Treatment Machine Market Value Share (%), By Segment 2, 2022 & 2029
Figure 6: Global Corona Discharge Surface Treatment Machine Market Forecast (USD Billion), by Sub-Segment 1, 2018-2029
Figure 7: Global Corona Discharge Surface Treatment Machine Market Forecast (USD Billion), by Sub-Segment 2, 2018-2029
Figure 8: Global Corona Discharge Surface Treatment Machine Market Forecast (USD Billion), by Sub-Segment 3, 2018-2029
Figure 9: Global Corona Discharge Surface Treatment Machine Market Forecast (USD Billion), by Others, 2018-2029
Figure 10: Global Corona Discharge Surface Treatment Machine Market Value Share (%), By Segment 3, 2022 & 2029
Figure 11: Global Corona Discharge Surface Treatment Machine Market Forecast (USD Billion), by Sub-Segment 1, 2018-2029
Figure 12: Global Corona Discharge Surface Treatment Machine Market Forecast (USD Billion), by Sub-Segment 2, 2018-2029
Figure 13: Global Corona Discharge Surface Treatment Machine Market Forecast (USD Billion), by Sub-Segment 3, 2018-2029
Figure 14: Global Corona Discharge Surface Treatment Machine Market Forecast (USD Billion), by Others, 2018-2029
Figure 15: Global Corona Discharge Surface Treatment Machine Market Value (USD Billion), by Region, 2022 & 2029
Figure 16: North America Corona Discharge Surface Treatment Machine Market Value Share (%), By Segment 1, 2022 & 2029
Figure 17: North America Corona Discharge Surface Treatment Machine Market Forecast (USD Billion), by Sub-Segment 1, 2018-2029
Figure 18: North America Corona Discharge Surface Treatment Machine Market Forecast (USD Billion), by Sub-Segment 2, 2018-2029
Figure 19: North America Corona Discharge Surface Treatment Machine Market Value Share (%), By Segment 2, 2022 & 2029
Figure 20: North America Corona Discharge Surface Treatment Machine Market Forecast (USD Billion), by Sub-Segment 1, 2018-2029
Figure 21: North America Corona Discharge Surface Treatment Machine Market Forecast (USD Billion), by Sub-Segment 2, 2018-2029
Figure 22: North America Corona Discharge Surface Treatment Machine Market Forecast (USD Billion), by Sub-Segment 3, 2018-2029
Figure 23: North America Corona Discharge Surface Treatment Machine Market Forecast (USD Billion), by Others, 2018-2029
Figure 24: North America Corona Discharge Surface Treatment Machine Market Value Share (%), By Segment 3, 2022 & 2029
Figure 25: North America Corona Discharge Surface Treatment Machine Market Forecast (USD Billion), by Sub-Segment 1, 2018-2029
Figure 26: North America Corona Discharge Surface Treatment Machine Market Forecast (USD Billion), by Sub-Segment 2, 2018-2029
Figure 27: North America Corona Discharge Surface Treatment Machine Market Forecast (USD Billion), by Sub-Segment 3, 2018-2029
Figure 28: North America Corona Discharge Surface Treatment Machine Market Forecast (USD Billion), by Others, 2018-2029
Figure 29: North America Corona Discharge Surface Treatment Machine Market Forecast (USD Billion), by U.S., 2018-2029
Figure 30: North America Corona Discharge Surface Treatment Machine Market Forecast (USD Billion), by Canada, 2018-2029
Figure 31: Latin America Corona Discharge Surface Treatment Machine Market Value Share (%), By Segment 1, 2022 & 2029
Figure 32: Latin America Corona Discharge Surface Treatment Machine Market Forecast (USD Billion), by Sub-Segment 1, 2018-2029
Figure 33: Latin America Corona Discharge Surface Treatment Machine Market Forecast (USD Billion), by Sub-Segment 2, 2018-2029
Figure 34: Latin America Corona Discharge Surface Treatment Machine Market Value Share (%), By Segment 2, 2022 & 2029
Figure 35: Latin America Corona Discharge Surface Treatment Machine Market Forecast (USD Billion), by Sub-Segment 1, 2018-2029
Figure 36: Latin America Corona Discharge Surface Treatment Machine Market Forecast (USD Billion), by Sub-Segment 2, 2018-2029
Figure 37: Latin America Corona Discharge Surface Treatment Machine Market Forecast (USD Billion), by Sub-Segment 3, 2018-2029
Figure 38: Latin America Corona Discharge Surface Treatment Machine Market Forecast (USD Billion), by Others, 2018-2029
Figure 39: Latin America Corona Discharge Surface Treatment Machine Market Value Share (%), By Segment 3, 2022 & 2029
Figure 40: Latin America Corona Discharge Surface Treatment Machine Market Forecast (USD Billion), by Sub-Segment 1, 2018-2029
Figure 41: Latin America Corona Discharge Surface Treatment Machine Market Forecast (USD Billion), by Sub-Segment 2, 2018-2029
Figure 42: Latin America Corona Discharge Surface Treatment Machine Market Forecast (USD Billion), by Sub-Segment 3, 2018-2029
Figure 43: Latin America Corona Discharge Surface Treatment Machine Market Forecast (USD Billion), by Others, 2018-2029
Figure 44: Latin America Corona Discharge Surface Treatment Machine Market Forecast (USD Billion), by Brazil, 2018-2029
Figure 45: Latin America Corona Discharge Surface Treatment Machine Market Forecast (USD Billion), by Mexico, 2018-2029
Figure 46: Latin America Corona Discharge Surface Treatment Machine Market Forecast (USD Billion), by Rest of Latin America, 2018-2029
Figure 47: Europe Corona Discharge Surface Treatment Machine Market Value Share (%), By Segment 1, 2022 & 2029
Figure 48: Europe Corona Discharge Surface Treatment Machine Market Forecast (USD Billion), by Sub-Segment 1, 2018-2029
Figure 49: Europe Corona Discharge Surface Treatment Machine Market Forecast (USD Billion), by Sub-Segment 2, 2018-2029
Figure 50: Europe Corona Discharge Surface Treatment Machine Market Value Share (%), By Segment 2, 2022 & 2029
Figure 51: Europe Corona Discharge Surface Treatment Machine Market Forecast (USD Billion), by Sub-Segment 1, 2018-2029
Figure 52: Europe Corona Discharge Surface Treatment Machine Market Forecast (USD Billion), by Sub-Segment 2, 2018-2029
Figure 53: Europe Corona Discharge Surface Treatment Machine Market Forecast (USD Billion), by Sub-Segment 3, 2018-2029
Figure 54: Europe Corona Discharge Surface Treatment Machine Market Forecast (USD Billion), by Others, 2018-2029
Figure 55: Europe Corona Discharge Surface Treatment Machine Market Value Share (%), By Segment 3, 2022 & 2029
Figure 56: Europe Corona Discharge Surface Treatment Machine Market Forecast (USD Billion), by Sub-Segment 1, 2018-2029
Figure 57: Europe Corona Discharge Surface Treatment Machine Market Forecast (USD Billion), by Sub-Segment 2, 2018-2029
Figure 58: Europe Corona Discharge Surface Treatment Machine Market Forecast (USD Billion), by Sub-Segment 3, 2018-2029
Figure 59: Europe Corona Discharge Surface Treatment Machine Market Forecast (USD Billion), by Others, 2018-2029
Figure 60: Europe Corona Discharge Surface Treatment Machine Market Forecast (USD Billion), by U.K., 2018-2029
Figure 61: Europe Corona Discharge Surface Treatment Machine Market Forecast (USD Billion), by Germany, 2018-2029
Figure 62: Europe Corona Discharge Surface Treatment Machine Market Forecast (USD Billion), by France, 2018-2029
Figure 63: Europe Corona Discharge Surface Treatment Machine Market Forecast (USD Billion), by Italy, 2018-2029
Figure 64: Europe Corona Discharge Surface Treatment Machine Market Forecast (USD Billion), by Spain, 2018-2029
Figure 65: Europe Corona Discharge Surface Treatment Machine Market Forecast (USD Billion), by Russia, 2018-2029
Figure 66: Europe Corona Discharge Surface Treatment Machine Market Forecast (USD Billion), by Rest of Europe, 2018-2029
Figure 67: Asia Pacific Corona Discharge Surface Treatment Machine Market Value Share (%), By Segment 1, 2022 & 2029
Figure 68: Asia Pacific Corona Discharge Surface Treatment Machine Market Forecast (USD Billion), by Sub-Segment 1, 2018-2029
Figure 69: Asia Pacific Corona Discharge Surface Treatment Machine Market Forecast (USD Billion), by Sub-Segment 2, 2018-2029
Figure 70: Asia Pacific Corona Discharge Surface Treatment Machine Market Value Share (%), By Segment 2, 2022 & 2029
Figure 71: Asia Pacific Corona Discharge Surface Treatment Machine Market Forecast (USD Billion), by Sub-Segment 1, 2018-2029
Figure 72: Asia Pacific Corona Discharge Surface Treatment Machine Market Forecast (USD Billion), by Sub-Segment 2, 2018-2029
Figure 73: Asia Pacific Corona Discharge Surface Treatment Machine Market Forecast (USD Billion), by Sub-Segment 3, 2018-2029
Figure 74: Asia Pacific Corona Discharge Surface Treatment Machine Market Forecast (USD Billion), by Others, 2018-2029
Figure 75: Asia Pacific Corona Discharge Surface Treatment Machine Market Value Share (%), By Segment 3, 2022 & 2029
Figure 76: Asia Pacific Corona Discharge Surface Treatment Machine Market Forecast (USD Billion), by Sub-Segment 1, 2018-2029
Figure 77: Asia Pacific Corona Discharge Surface Treatment Machine Market Forecast (USD Billion), by Sub-Segment 2, 2018-2029
Figure 78: Asia Pacific Corona Discharge Surface Treatment Machine Market Forecast (USD Billion), by Sub-Segment 3, 2018-2029
Figure 79: Asia Pacific Corona Discharge Surface Treatment Machine Market Forecast (USD Billion), by Others, 2018-2029
Figure 80: Asia Pacific Corona Discharge Surface Treatment Machine Market Forecast (USD Billion), by China, 2018-2029
Figure 81: Asia Pacific Corona Discharge Surface Treatment Machine Market Forecast (USD Billion), by India, 2018-2029
Figure 82: Asia Pacific Corona Discharge Surface Treatment Machine Market Forecast (USD Billion), by Japan, 2018-2029
Figure 83: Asia Pacific Corona Discharge Surface Treatment Machine Market Forecast (USD Billion), by Australia, 2018-2029
Figure 84: Asia Pacific Corona Discharge Surface Treatment Machine Market Forecast (USD Billion), by Southeast Asia, 2018-2029
Figure 85: Asia Pacific Corona Discharge Surface Treatment Machine Market Forecast (USD Billion), by Rest of Asia Pacific, 2018-2029
Figure 86: Middle East & Africa Corona Discharge Surface Treatment Machine Market Value Share (%), By Segment 1, 2022 & 2029
Figure 87: Middle East & Africa Corona Discharge Surface Treatment Machine Market Forecast (USD Billion), by Sub-Segment 1, 2018-2029
Figure 88: Middle East & Africa Corona Discharge Surface Treatment Machine Market Forecast (USD Billion), by Sub-Segment 2, 2018-2029
Figure 89: Middle East & Africa Corona Discharge Surface Treatment Machine Market Value Share (%), By Segment 2, 2022 & 2029
Figure 90: Middle East & Africa Corona Discharge Surface Treatment Machine Market Forecast (USD Billion), by Sub-Segment 1, 2018-2029
Figure 91: Middle East & Africa Corona Discharge Surface Treatment Machine Market Forecast (USD Billion), by Sub-Segment 2, 2018-2029
Figure 92: Middle East & Africa Corona Discharge Surface Treatment Machine Market Forecast (USD Billion), by Sub-Segment 3, 2018-2029
Figure 93: Middle East & Africa Corona Discharge Surface Treatment Machine Market Forecast (USD Billion), by Others, 2018-2029
Figure 94: Middle East & Africa Corona Discharge Surface Treatment Machine Market Value Share (%), By Segment 3, 2022 & 2029
Figure 95: Middle East & Africa Corona Discharge Surface Treatment Machine Market Forecast (USD Billion), by Sub-Segment 1, 2018-2029
Figure 96: Middle East & Africa Corona Discharge Surface Treatment Machine Market Forecast (USD Billion), by Sub-Segment 2, 2018-2029
Figure 97: Middle East & Africa Corona Discharge Surface Treatment Machine Market Forecast (USD Billion), by Sub-Segment 3, 2018-2029
Figure 98: Middle East & Africa Corona Discharge Surface Treatment Machine Market Forecast (USD Billion), by Others, 2018-2029
Figure 99: Middle East & Africa Corona Discharge Surface Treatment Machine Market Forecast (USD Billion), by GCC, 2018-2029
Figure 100: Middle East & Africa Corona Discharge Surface Treatment Machine Market Forecast (USD Billion), by South Africa, 2018-2029
Figure 101: Middle East & Africa Corona Discharge Surface Treatment Machine Market Forecast (USD Billion), by Rest of Middle East & Africa, 2018-2029
List of Tables
Table 1: Global Corona Discharge Surface Treatment Machine Market Revenue (USD Billion) Forecast, by Segment 1, 2018-2029
Table 2: Global Corona Discharge Surface Treatment Machine Market Revenue (USD Billion) Forecast, by Segment 2, 2018-2029
Table 3: Global Corona Discharge Surface Treatment Machine Market Revenue (USD Billion) Forecast, by Segment 3, 2018-2029
Table 4: Global Corona Discharge Surface Treatment Machine Market Revenue (USD Billion) Forecast, by Region, 2018-2029
Table 5: North America Corona Discharge Surface Treatment Machine Market Revenue (USD Billion) Forecast, by Segment 1, 2018-2029
Table 6: North America Corona Discharge Surface Treatment Machine Market Revenue (USD Billion) Forecast, by Segment 2, 2018-2029
Table 7: North America Corona Discharge Surface Treatment Machine Market Revenue (USD Billion) Forecast, by Segment 3, 2018-2029
Table 8: North America Corona Discharge Surface Treatment Machine Market Revenue (USD Billion) Forecast, by Country, 2018-2029
Table 9: Europe Corona Discharge Surface Treatment Machine Market Revenue (USD Billion) Forecast, by Segment 1, 2018-2029
Table 10: Europe Corona Discharge Surface Treatment Machine Market Revenue (USD Billion) Forecast, by Segment 2, 2018-2029
Table 11: Europe Corona Discharge Surface Treatment Machine Market Revenue (USD Billion) Forecast, by Segment 3, 2018-2029
Table 12: Europe Corona Discharge Surface Treatment Machine Market Revenue (USD Billion) Forecast, by Country, 2018-2029
Table 13: Latin America Corona Discharge Surface Treatment Machine Market Revenue (USD Billion) Forecast, by Segment 1, 2018-2029
Table 14: Latin America Corona Discharge Surface Treatment Machine Market Revenue (USD Billion) Forecast, by Segment 2, 2018-2029
Table 15: Latin America Corona Discharge Surface Treatment Machine Market Revenue (USD Billion) Forecast, by Segment 3, 2018-2029
Table 16: Latin America Corona Discharge Surface Treatment Machine Market Revenue (USD Billion) Forecast, by Country, 2018-2029
Table 17: Asia Pacific Corona Discharge Surface Treatment Machine Market Revenue (USD Billion) Forecast, by Segment 1, 2018-2029
Table 18: Asia Pacific Corona Discharge Surface Treatment Machine Market Revenue (USD Billion) Forecast, by Segment 2, 2018-2029
Table 19: Asia Pacific Corona Discharge Surface Treatment Machine Market Revenue (USD Billion) Forecast, by Segment 3, 2018-2029
Table 20: Asia Pacific Corona Discharge Surface Treatment Machine Market Revenue (USD Billion) Forecast, by Country, 2018-2029
Table 21: Middle East & Africa Corona Discharge Surface Treatment Machine Market Revenue (USD Billion) Forecast, by Segment 1, 2018-2029
Table 22: Middle East & Africa Corona Discharge Surface Treatment Machine Market Revenue (USD Billion) Forecast, by Segment 2, 2018-2029
Table 23: Middle East & Africa Corona Discharge Surface Treatment Machine Market Revenue (USD Billion) Forecast, by Segment 3, 2018-2029
Table 24: Middle East & Africa Corona Discharge Surface Treatment Machine Market Revenue (USD Billion) Forecast, by Country, 2018-2029
Research Process
Data Library Research are conducted by industry experts who offer insight on
industry structure, market segmentations technology assessment and competitive landscape (CL), and penetration, as well as on emerging trends. Their analysis is based on primary interviews (~ 80%) and secondary research (~ 20%) as well as years of professional expertise in their respective industries. Adding to this, by analysing historical trends and current market positions, our analysts predict where the market will be headed for the next five years. Furthermore, the varying trends of segment & categories geographically presented are also studied and the estimated based on the primary & secondary research.
In this particular report from the supply side Data Library Research has conducted primary surveys (interviews) with the key level executives (VP, CEO’s, Marketing Director, Business Development Manager
and SOFT) of the companies that active & prominent as well as the midsized organization
FIGURE 1: DLR RESEARH PROCESS
![research-methodology1]()
Primary Research
Extensive primary research was conducted to gain a deeper insight of the market and industry performance. The analysis is based on both primary and secondary research as well as years of professional expertise in the respective industries.
In addition to analysing current and historical trends, our analysts predict where the market is headed over the next five years.
It varies by segment for these categories geographically presented in the list of market tables. Speaking about this particular report we have conducted primary surveys (interviews) with the key level executives (VP, CEO’s, Marketing Director, Business Development Manager and many more) of the major players active in the market.
Secondary Research
Secondary research was mainly used to collect and identify information useful for the extensive, technical, market-oriented, and Friend’s study of the Global Extra Neutral Alcohol. It was also used to obtain key information about major players, market classification and segmentation according to the industry trends, geographical markets, and developments related to the market and technology perspectives. For this study, analysts have gathered information from various credible sources, such as annual reports, sec filings, journals, white papers, SOFT presentations, and company web sites.
Market Size Estimation
Both, top-down and bottom-up approaches were used to estimate and validate the size of the Global market and to estimate the size of various other dependent submarkets in the overall Extra Neutral Alcohol. The key players in the market were identified through secondary research and their market contributions in the respective geographies were determined through primary and secondary research.
Forecast Model
![research-methodology2]()