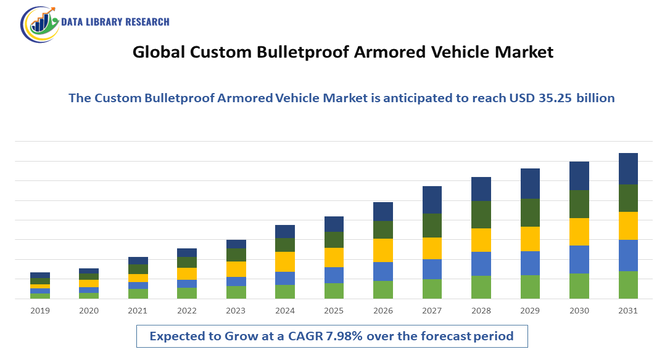
Custom Bulletproof Armored Vehicle Market Overview and Analysis:
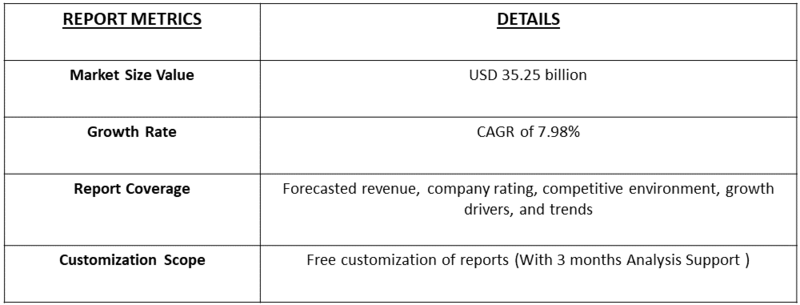
- The Global Custom Bulletproof Armored Vehicle Market size is estimated at USD 22.18 billion in 2025 and is predicted to reach around USD 35.25 billion by 2032, growing with a CAGR of 7.98% from 2025-2032.
Get Complete Analysis Of The Report - Download Updated Free Sample PDF
The Global Custom Bulletproof Armored Vehicle Market refers to a specialized segment in which vehicles — such as SUVs, sedans, and vans — are custom modified or built with reinforced armor, ballistic steel, and bullet-resistant glass to protect occupants from armed attacks. These high-security vehicles are used by governments, the military, law enforcement, corporations, and high-net-worth individuals, balancing protection, performance, and luxury options.
The global custom bulletproof armored vehicle market was growing because rising security threats—such as terrorism, crime, and geopolitical instability—made individuals, corporations, and governments increasingly seek protection through armored transport. Technological innovation in lightweight materials and modular armor systems also drove demand. Additionally, wealthier individuals and executives fueled growth by demanding bespoke armored vehicles that combine luxury with advanced security.
Custom Bulletproof Armored Vehicle Market Latest Trends
The bulletproof armored vehicle market has trended toward lighter, more advanced protection systems, as manufacturers develop composite armor, modular ballistic kits, and integrated surveillance or GPS systems. Demand is rising particularly for customized armored SUVs and luxury sedans among private individuals and executives. Regionally, strong growth is reported in emerging markets with security concerns, while lightweight innovation is making armored transport more accessible and practical.
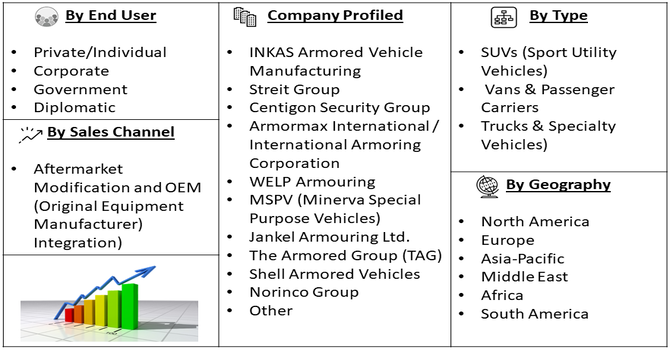
Segmentation: The Global Custom Bulletproof Armored Vehicle Market is segmented by Vehicle Type (SUVs (Sport Utility Vehicles), Vans & Passenger Carriers, and Trucks & Specialty Vehicles), Protection Level (Low/Moderate, High and Maximum), End-User (Private/Individual, Corporate and Government/Diplomatic), Sales Channel (Aftermarket Modification and OEM (Original Equipment Manufacturer) Integration), and Geography (North America, Europe, Asia-Pacific, Middle East and Africa, and South America). The report provides the value (in USD million) for the above segments.
For Detailed Market Segmentation - Get a Free Sample PDF
Market Drivers:
- Rising Global Security Concerns
The global custom bulletproof armored vehicle market has been significantly driven by rising security concerns worldwide. Increasing threats from terrorism, organized crime, civil unrest, and targeted attacks have pushed governments, corporations, and high-net-worth individuals to seek advanced armored vehicles for personal and executive protection.
For instance, in August 2023, BMW developed two new 7 Series Protection models, blending top-tier ballistic protection with exceptional comfort, advanced features, and dynamic performance. The BMW i7 Protection became the world’s first all-electric protection sedan, delivering VR9-level security without limitations, while the combustion-engine 7 Series Protection offered equivalent safety with traditional powertrain efficiency. These innovations addressed rising global security concerns by providing high-net-worth individuals and executives with state-of-the-art armored vehicles that combined safety, luxury, and advanced mobility. Thus, as public safety remains a priority, demand for SUVs, sedans, and vans equipped with ballistic steel, bullet-resistant glass, and blast protection systems has surged. High-profile incidents and geopolitical tensions in certain regions have further heightened awareness about the importance of secure transportation.
- Technological Advancements in Armoring and Vehicle Customization
Technological innovations have also driven growth in the bulletproof armored vehicle market. Modern manufacturers increasingly use lightweight composite armor, modular protection kits, and advanced materials that enhance protection while maintaining vehicle performance. For instance, August 2024, INKAS Armored Vehicle Manufacturing became the first company to armor the INEOS Grenadier. This collaboration combined INEOS Automotive’s rugged performance with INKAS’ advanced security expertise, delivering a vehicle that offered both superior protection and style. The partnership created a unique armored SUV that met high safety standards while maintaining the Grenadier’s performance and aesthetic appeal, appealing to clients seeking luxury, durability, and security. These innovations have increased consumer confidence in armored vehicles, expanded their applications, and positioned the market for sustained growth as more buyers seek personalized, technologically advanced protective mobility solutions.
Market Restraints
- High Costs and Limited Accessibility
A key restraint in the global bulletproof armored vehicle market is the high cost of production and purchase. Advanced armor plating, reinforced glass, blast protection systems, and integrated electronic security components significantly increase vehicle prices, making them inaccessible to many potential buyers. Additionally, specialized customization and maintenance requirements further add to operational costs. Limited availability of skilled manufacturers and retrofit providers in certain regions restricts market penetration, especially in developing countries. Regulatory approvals and compliance with international ballistic standards can also delay deliveries.
Socio Economic Impact on Custom Bulletproof Armored Vehicle Market
Growth in this market has bolstered specialized manufacturing sectors, creating jobs in high-tech armoring and security customization. Wealthy individuals investing in bulletproof vehicles also reflect growing inequality — but also rising awareness of personal risk. At the same time, governments and executives purchasing these vehicles highlight how privatized security has become increasingly necessary. This dynamic strengthens private security services and fuels demand for protective mobility across both civilian and government spheres.
Segmental Analysis:
- SUVs (Sport Utility Vehicles) segment is expected to witness the highest growth over the forecast period
The SUVs segment is expected to witness the highest growth over the forecast period due to their popularity among high-net-worth individuals, corporate executives, and government officials seeking both luxury and protection. SUVs provide spacious interiors, higher ground clearance, and versatility, making them ideal platforms for armoring and additional security features. Increasing demand for executive transport, VIP protection, and family safety has driven growth, as these vehicles can balance comfort, performance, and ballistic protection. Additionally, manufacturers are increasingly offering factory-armored SUVs, along with aftermarket options, making them accessible to a broader customer base and reinforcing their dominance in the armored vehicle market.
- Maximum Protection Segment segment is expected to witness the highest growth over the forecast period
The Maximum Protection segment is expected to witness the highest growth as security threats intensify globally. Clients with critical security needs, such as political leaders, diplomats, and high-profile business executives, increasingly demand vehicles offering the highest levels of ballistic, blast, and anti-riot protection. Advanced technologies, such as multi-layered armor, reinforced chassis, and explosion-resistant floors, make these vehicles capable of withstanding extreme threats. Rising global incidents of targeted attacks and terrorism have fueled demand for maximum protection armored vehicles, driving manufacturers to invest in R&D for cutting-edge security solutions. This segment’s growth is also supported by heightened awareness and regulatory compliance requirements.
- Private/Individual segment is expected to witness the highest growth over the forecast period
The Private/Individual segment is expected to witness the highest growth over the forecast period due to increasing security concerns among affluent individuals and families. High-net-worth individuals, celebrities, and executives are seeking armored vehicles that offer both luxury and advanced protection, without compromising comfort or style. Rising urban crime rates, targeted attacks, and global unrest have amplified the demand for personal armored SUVs, sedans, and vans. Customization options allow private owners to personalize interiors, integrate high-tech surveillance, and enhance mobility while ensuring safety. This trend has encouraged both OEMs and specialized armoring companies to expand offerings tailored for private individual use.
- Aftermarket Modification segment is expected to witness the highest growth over the forecast period
The Aftermarket Modification segment is expected to witness the highest growth as many buyers prefer converting standard luxury or utility vehicles into armored versions. Aftermarket armoring allows for greater flexibility in customization, including selection of protection levels, luxury interiors, and technological enhancements. This approach is popular among clients who require specific security features without compromising on vehicle brand, design, or performance. Additionally, the aftermarket segment benefits from shorter lead times and the ability to retrofit existing vehicles, making it a cost-effective option for individuals, corporations, and government agencies seeking enhanced protection. Growth is further supported by advancements in modular armor technologies.
- North America Region is expected to witness the highest growth over the forecast period
North America is expected to witness the highest growth in the global custom bulletproof armored vehicle market due to high adoption of luxury and high-security vehicles among executives, VIPs, and government personnel. The region has a strong presence of leading armored vehicle manufacturers and aftermarket modification providers, ensuring availability of advanced ballistic and blast protection technologies.
Rising security concerns, urban crime rates, and high disposable incomes among private individuals drive market demand. For instance, in August 2021, Apogee Enterprises Inc. announced the closure of its Viracon facility in Statesboro, Georgia, and its Velocity facility in Dallas after about 18 months of operation. These closures were part of the company’s strategy to restructure and cut business costs. This move impacted the global custom bulletproof armored vehicle market by potentially limiting supply sources amid rising security concerns, underscoring challenges in balancing cost efficiency with growing demand for armored vehicle components and technologies.
Additionally, supportive regulations, advanced R&D infrastructure, and growing awareness of personal safety further contribute to the region’s market growth, making North America a key hub for both domestic production and consumption of armored vehicles.
To Learn More About This Report - Request a Free Sample Copy
Custom Bulletproof Armored Vehicle Market Competitive Landscape
The competitive landscape is populated by niche armoring firms and luxury vehicle manufacturers. Key players include specialized companies that retrofit standard models with ballistic protection, as well as bespoke armoring firms that build custom high-security vehicles. These companies compete by offering advanced modular armor, high customizability, and integration of security tech. They also differentiate through client relationships — serving high-net-worth individuals, corporations, and state actors — while investing in R&D to improve protection and reduce weight.
The major players for this market are:
- INKAS Armored Vehicle Manufacturing
- Streit Group
- Centigon Security Group
- Armormax International / International Armoring Corporation
- WELP Armouring
- MSPV (Minerva Special Purpose Vehicles)
- Jankel Armouring Ltd.
- The Armored Group (TAG)
- Shell Armored Vehicles
- Alpine Armoring Inc.
- Double Star (Shanghai) Co.
- Norinco Group
- Shaanxi Baoji Special Vehicles Manufacturing Co.
- DIMA Holdings Co., Ltd
- JCBL Armouring Solutions Pvt. Ltd
- Plasan Sasa Ltd.
- Oshkosh Defense, LLC
- BAE Systems plc
- General Dynamics Corporation
- Lockheed Martin Corporation
Recent Development
- In October 2025, Armoris Defense showcased its advanced vehicle armoring technology at the 2025 SEMA Show, demonstrating industry-leading ballistic protection. Designed for both civilian and tactical applications, the company’s innovative systems provided exceptional protection while seamlessly integrating with vehicle design. The solutions combined high performance, luxury, and personal security, appealing to customers who demanded uncompromised safety without sacrificing style or functionality. This unveiling highlighted Armoris Defense’s commitment to delivering cutting-edge armored vehicles that meet evolving security needs in both private and professional markets.
- In September 2025, INKAS successfully completed a landmark R&D collaboration with VinFast, Vietnam’s leading electric automaker, resulting in the development of the Lạc Hồng 900 LX. This fully electric armored SUV was engineered to meet some of the highest international standards for ballistic and blast protection. The partnership combined INKAS expertise in advanced vehicle armoring with VinFast’s electric propulsion technology, creating a high-performance, sustainable armored vehicle that demonstrated innovation, safety, and compliance with global security and environmental standards.
Frequently Asked Questions (FAQ) :
Q1. What are the main growth-driving factors for this market?
The primary driver is the escalating threat of organized crime, kidnapping, and civil unrest in high-risk regions globally. Growth is also fueled by the increasing number of Ultra-High-Net-Worth Individuals (UHNWIs) and corporate executives requiring protection. Furthermore, advancements in lightweight armor materials allow for discreet protection without compromising vehicle performance, making the vehicles more appealing.
Q2. What are the main restraining factors for this market?
A key constraint is the extremely high cost of specialized armoring processes and materials, which limits the customer base. The market also suffers from long, complex manufacturing lead times due to custom work and ballistic testing. Additionally, the added weight of the armor significantly increases fuel consumption and wear and tear on suspension components, resulting in higher operational costs.
Q3. Which segment is expected to witness high growth?
The SUV and Luxury Sedan Segment is projected to witness the highest growth. These vehicles offer the best balance of passenger capacity, luxury, and discreet protection, making them ideal for executive and family security details. The demand is particularly high for discreet armoring (B6/B7 levels) that maintains the vehicle’s original appearance, ensuring safety without drawing unwanted attention.
Q4. Who are the top major players for this market?
The market is dominated by highly specialized, bespoke armoring companies. Top major players include INKAS Armored Vehicle Manufacturing, The Armored Group (TAG), International Armoring Corporation (IAC), and Alpine Armoring. Competition centers on offering the highest ballistic protection certifications (VPAM standards), rapid delivery times, and customizing luxury interiors to meet the exact security and comfort demands of elite clients.
Q5. Which country is the largest player?
The United States is the largest country player by value and technology. This dominance is driven by high demand from corporate and government security sectors, and the presence of world-leading vehicle manufacturers (OEMs). The U.S. also acts as a primary hub for exporting armored vehicles to high-risk areas globally, utilizing its advanced technology and robust manufacturing base.
List of Figures
Figure 1: Global Custom Bulletproof Armored Vehicle Market Revenue Breakdown (USD Billion, %) by Region, 2022 & 2029
Figure 2: Global Custom Bulletproof Armored Vehicle Market Value Share (%), By Segment 1, 2022 & 2029
Figure 3: Global Custom Bulletproof Armored Vehicle Market Forecast (USD Billion), by Sub-Segment 1, 2018-2029
Figure 4: Global Custom Bulletproof Armored Vehicle Market Forecast (USD Billion), by Sub-Segment 2, 2018-2029
Figure 5: Global Custom Bulletproof Armored Vehicle Market Value Share (%), By Segment 2, 2022 & 2029
Figure 6: Global Custom Bulletproof Armored Vehicle Market Forecast (USD Billion), by Sub-Segment 1, 2018-2029
Figure 7: Global Custom Bulletproof Armored Vehicle Market Forecast (USD Billion), by Sub-Segment 2, 2018-2029
Figure 8: Global Custom Bulletproof Armored Vehicle Market Forecast (USD Billion), by Sub-Segment 3, 2018-2029
Figure 9: Global Custom Bulletproof Armored Vehicle Market Forecast (USD Billion), by Others, 2018-2029
Figure 10: Global Custom Bulletproof Armored Vehicle Market Value Share (%), By Segment 3, 2022 & 2029
Figure 11: Global Custom Bulletproof Armored Vehicle Market Forecast (USD Billion), by Sub-Segment 1, 2018-2029
Figure 12: Global Custom Bulletproof Armored Vehicle Market Forecast (USD Billion), by Sub-Segment 2, 2018-2029
Figure 13: Global Custom Bulletproof Armored Vehicle Market Forecast (USD Billion), by Sub-Segment 3, 2018-2029
Figure 14: Global Custom Bulletproof Armored Vehicle Market Forecast (USD Billion), by Others, 2018-2029
Figure 15: Global Custom Bulletproof Armored Vehicle Market Value (USD Billion), by Region, 2022 & 2029
Figure 16: North America Custom Bulletproof Armored Vehicle Market Value Share (%), By Segment 1, 2022 & 2029
Figure 17: North America Custom Bulletproof Armored Vehicle Market Forecast (USD Billion), by Sub-Segment 1, 2018-2029
Figure 18: North America Custom Bulletproof Armored Vehicle Market Forecast (USD Billion), by Sub-Segment 2, 2018-2029
Figure 19: North America Custom Bulletproof Armored Vehicle Market Value Share (%), By Segment 2, 2022 & 2029
Figure 20: North America Custom Bulletproof Armored Vehicle Market Forecast (USD Billion), by Sub-Segment 1, 2018-2029
Figure 21: North America Custom Bulletproof Armored Vehicle Market Forecast (USD Billion), by Sub-Segment 2, 2018-2029
Figure 22: North America Custom Bulletproof Armored Vehicle Market Forecast (USD Billion), by Sub-Segment 3, 2018-2029
Figure 23: North America Custom Bulletproof Armored Vehicle Market Forecast (USD Billion), by Others, 2018-2029
Figure 24: North America Custom Bulletproof Armored Vehicle Market Value Share (%), By Segment 3, 2022 & 2029
Figure 25: North America Custom Bulletproof Armored Vehicle Market Forecast (USD Billion), by Sub-Segment 1, 2018-2029
Figure 26: North America Custom Bulletproof Armored Vehicle Market Forecast (USD Billion), by Sub-Segment 2, 2018-2029
Figure 27: North America Custom Bulletproof Armored Vehicle Market Forecast (USD Billion), by Sub-Segment 3, 2018-2029
Figure 28: North America Custom Bulletproof Armored Vehicle Market Forecast (USD Billion), by Others, 2018-2029
Figure 29: North America Custom Bulletproof Armored Vehicle Market Forecast (USD Billion), by U.S., 2018-2029
Figure 30: North America Custom Bulletproof Armored Vehicle Market Forecast (USD Billion), by Canada, 2018-2029
Figure 31: Latin America Custom Bulletproof Armored Vehicle Market Value Share (%), By Segment 1, 2022 & 2029
Figure 32: Latin America Custom Bulletproof Armored Vehicle Market Forecast (USD Billion), by Sub-Segment 1, 2018-2029
Figure 33: Latin America Custom Bulletproof Armored Vehicle Market Forecast (USD Billion), by Sub-Segment 2, 2018-2029
Figure 34: Latin America Custom Bulletproof Armored Vehicle Market Value Share (%), By Segment 2, 2022 & 2029
Figure 35: Latin America Custom Bulletproof Armored Vehicle Market Forecast (USD Billion), by Sub-Segment 1, 2018-2029
Figure 36: Latin America Custom Bulletproof Armored Vehicle Market Forecast (USD Billion), by Sub-Segment 2, 2018-2029
Figure 37: Latin America Custom Bulletproof Armored Vehicle Market Forecast (USD Billion), by Sub-Segment 3, 2018-2029
Figure 38: Latin America Custom Bulletproof Armored Vehicle Market Forecast (USD Billion), by Others, 2018-2029
Figure 39: Latin America Custom Bulletproof Armored Vehicle Market Value Share (%), By Segment 3, 2022 & 2029
Figure 40: Latin America Custom Bulletproof Armored Vehicle Market Forecast (USD Billion), by Sub-Segment 1, 2018-2029
Figure 41: Latin America Custom Bulletproof Armored Vehicle Market Forecast (USD Billion), by Sub-Segment 2, 2018-2029
Figure 42: Latin America Custom Bulletproof Armored Vehicle Market Forecast (USD Billion), by Sub-Segment 3, 2018-2029
Figure 43: Latin America Custom Bulletproof Armored Vehicle Market Forecast (USD Billion), by Others, 2018-2029
Figure 44: Latin America Custom Bulletproof Armored Vehicle Market Forecast (USD Billion), by Brazil, 2018-2029
Figure 45: Latin America Custom Bulletproof Armored Vehicle Market Forecast (USD Billion), by Mexico, 2018-2029
Figure 46: Latin America Custom Bulletproof Armored Vehicle Market Forecast (USD Billion), by Rest of Latin America, 2018-2029
Figure 47: Europe Custom Bulletproof Armored Vehicle Market Value Share (%), By Segment 1, 2022 & 2029
Figure 48: Europe Custom Bulletproof Armored Vehicle Market Forecast (USD Billion), by Sub-Segment 1, 2018-2029
Figure 49: Europe Custom Bulletproof Armored Vehicle Market Forecast (USD Billion), by Sub-Segment 2, 2018-2029
Figure 50: Europe Custom Bulletproof Armored Vehicle Market Value Share (%), By Segment 2, 2022 & 2029
Figure 51: Europe Custom Bulletproof Armored Vehicle Market Forecast (USD Billion), by Sub-Segment 1, 2018-2029
Figure 52: Europe Custom Bulletproof Armored Vehicle Market Forecast (USD Billion), by Sub-Segment 2, 2018-2029
Figure 53: Europe Custom Bulletproof Armored Vehicle Market Forecast (USD Billion), by Sub-Segment 3, 2018-2029
Figure 54: Europe Custom Bulletproof Armored Vehicle Market Forecast (USD Billion), by Others, 2018-2029
Figure 55: Europe Custom Bulletproof Armored Vehicle Market Value Share (%), By Segment 3, 2022 & 2029
Figure 56: Europe Custom Bulletproof Armored Vehicle Market Forecast (USD Billion), by Sub-Segment 1, 2018-2029
Figure 57: Europe Custom Bulletproof Armored Vehicle Market Forecast (USD Billion), by Sub-Segment 2, 2018-2029
Figure 58: Europe Custom Bulletproof Armored Vehicle Market Forecast (USD Billion), by Sub-Segment 3, 2018-2029
Figure 59: Europe Custom Bulletproof Armored Vehicle Market Forecast (USD Billion), by Others, 2018-2029
Figure 60: Europe Custom Bulletproof Armored Vehicle Market Forecast (USD Billion), by U.K., 2018-2029
Figure 61: Europe Custom Bulletproof Armored Vehicle Market Forecast (USD Billion), by Germany, 2018-2029
Figure 62: Europe Custom Bulletproof Armored Vehicle Market Forecast (USD Billion), by France, 2018-2029
Figure 63: Europe Custom Bulletproof Armored Vehicle Market Forecast (USD Billion), by Italy, 2018-2029
Figure 64: Europe Custom Bulletproof Armored Vehicle Market Forecast (USD Billion), by Spain, 2018-2029
Figure 65: Europe Custom Bulletproof Armored Vehicle Market Forecast (USD Billion), by Russia, 2018-2029
Figure 66: Europe Custom Bulletproof Armored Vehicle Market Forecast (USD Billion), by Rest of Europe, 2018-2029
Figure 67: Asia Pacific Custom Bulletproof Armored Vehicle Market Value Share (%), By Segment 1, 2022 & 2029
Figure 68: Asia Pacific Custom Bulletproof Armored Vehicle Market Forecast (USD Billion), by Sub-Segment 1, 2018-2029
Figure 69: Asia Pacific Custom Bulletproof Armored Vehicle Market Forecast (USD Billion), by Sub-Segment 2, 2018-2029
Figure 70: Asia Pacific Custom Bulletproof Armored Vehicle Market Value Share (%), By Segment 2, 2022 & 2029
Figure 71: Asia Pacific Custom Bulletproof Armored Vehicle Market Forecast (USD Billion), by Sub-Segment 1, 2018-2029
Figure 72: Asia Pacific Custom Bulletproof Armored Vehicle Market Forecast (USD Billion), by Sub-Segment 2, 2018-2029
Figure 73: Asia Pacific Custom Bulletproof Armored Vehicle Market Forecast (USD Billion), by Sub-Segment 3, 2018-2029
Figure 74: Asia Pacific Custom Bulletproof Armored Vehicle Market Forecast (USD Billion), by Others, 2018-2029
Figure 75: Asia Pacific Custom Bulletproof Armored Vehicle Market Value Share (%), By Segment 3, 2022 & 2029
Figure 76: Asia Pacific Custom Bulletproof Armored Vehicle Market Forecast (USD Billion), by Sub-Segment 1, 2018-2029
Figure 77: Asia Pacific Custom Bulletproof Armored Vehicle Market Forecast (USD Billion), by Sub-Segment 2, 2018-2029
Figure 78: Asia Pacific Custom Bulletproof Armored Vehicle Market Forecast (USD Billion), by Sub-Segment 3, 2018-2029
Figure 79: Asia Pacific Custom Bulletproof Armored Vehicle Market Forecast (USD Billion), by Others, 2018-2029
Figure 80: Asia Pacific Custom Bulletproof Armored Vehicle Market Forecast (USD Billion), by China, 2018-2029
Figure 81: Asia Pacific Custom Bulletproof Armored Vehicle Market Forecast (USD Billion), by India, 2018-2029
Figure 82: Asia Pacific Custom Bulletproof Armored Vehicle Market Forecast (USD Billion), by Japan, 2018-2029
Figure 83: Asia Pacific Custom Bulletproof Armored Vehicle Market Forecast (USD Billion), by Australia, 2018-2029
Figure 84: Asia Pacific Custom Bulletproof Armored Vehicle Market Forecast (USD Billion), by Southeast Asia, 2018-2029
Figure 85: Asia Pacific Custom Bulletproof Armored Vehicle Market Forecast (USD Billion), by Rest of Asia Pacific, 2018-2029
Figure 86: Middle East & Africa Custom Bulletproof Armored Vehicle Market Value Share (%), By Segment 1, 2022 & 2029
Figure 87: Middle East & Africa Custom Bulletproof Armored Vehicle Market Forecast (USD Billion), by Sub-Segment 1, 2018-2029
Figure 88: Middle East & Africa Custom Bulletproof Armored Vehicle Market Forecast (USD Billion), by Sub-Segment 2, 2018-2029
Figure 89: Middle East & Africa Custom Bulletproof Armored Vehicle Market Value Share (%), By Segment 2, 2022 & 2029
Figure 90: Middle East & Africa Custom Bulletproof Armored Vehicle Market Forecast (USD Billion), by Sub-Segment 1, 2018-2029
Figure 91: Middle East & Africa Custom Bulletproof Armored Vehicle Market Forecast (USD Billion), by Sub-Segment 2, 2018-2029
Figure 92: Middle East & Africa Custom Bulletproof Armored Vehicle Market Forecast (USD Billion), by Sub-Segment 3, 2018-2029
Figure 93: Middle East & Africa Custom Bulletproof Armored Vehicle Market Forecast (USD Billion), by Others, 2018-2029
Figure 94: Middle East & Africa Custom Bulletproof Armored Vehicle Market Value Share (%), By Segment 3, 2022 & 2029
Figure 95: Middle East & Africa Custom Bulletproof Armored Vehicle Market Forecast (USD Billion), by Sub-Segment 1, 2018-2029
Figure 96: Middle East & Africa Custom Bulletproof Armored Vehicle Market Forecast (USD Billion), by Sub-Segment 2, 2018-2029
Figure 97: Middle East & Africa Custom Bulletproof Armored Vehicle Market Forecast (USD Billion), by Sub-Segment 3, 2018-2029
Figure 98: Middle East & Africa Custom Bulletproof Armored Vehicle Market Forecast (USD Billion), by Others, 2018-2029
Figure 99: Middle East & Africa Custom Bulletproof Armored Vehicle Market Forecast (USD Billion), by GCC, 2018-2029
Figure 100: Middle East & Africa Custom Bulletproof Armored Vehicle Market Forecast (USD Billion), by South Africa, 2018-2029
Figure 101: Middle East & Africa Custom Bulletproof Armored Vehicle Market Forecast (USD Billion), by Rest of Middle East & Africa, 2018-2029
List of Tables
Table 1: Global Custom Bulletproof Armored Vehicle Market Revenue (USD Billion) Forecast, by Segment 1, 2018-2029
Table 2: Global Custom Bulletproof Armored Vehicle Market Revenue (USD Billion) Forecast, by Segment 2, 2018-2029
Table 3: Global Custom Bulletproof Armored Vehicle Market Revenue (USD Billion) Forecast, by Segment 3, 2018-2029
Table 4: Global Custom Bulletproof Armored Vehicle Market Revenue (USD Billion) Forecast, by Region, 2018-2029
Table 5: North America Custom Bulletproof Armored Vehicle Market Revenue (USD Billion) Forecast, by Segment 1, 2018-2029
Table 6: North America Custom Bulletproof Armored Vehicle Market Revenue (USD Billion) Forecast, by Segment 2, 2018-2029
Table 7: North America Custom Bulletproof Armored Vehicle Market Revenue (USD Billion) Forecast, by Segment 3, 2018-2029
Table 8: North America Custom Bulletproof Armored Vehicle Market Revenue (USD Billion) Forecast, by Country, 2018-2029
Table 9: Europe Custom Bulletproof Armored Vehicle Market Revenue (USD Billion) Forecast, by Segment 1, 2018-2029
Table 10: Europe Custom Bulletproof Armored Vehicle Market Revenue (USD Billion) Forecast, by Segment 2, 2018-2029
Table 11: Europe Custom Bulletproof Armored Vehicle Market Revenue (USD Billion) Forecast, by Segment 3, 2018-2029
Table 12: Europe Custom Bulletproof Armored Vehicle Market Revenue (USD Billion) Forecast, by Country, 2018-2029
Table 13: Latin America Custom Bulletproof Armored Vehicle Market Revenue (USD Billion) Forecast, by Segment 1, 2018-2029
Table 14: Latin America Custom Bulletproof Armored Vehicle Market Revenue (USD Billion) Forecast, by Segment 2, 2018-2029
Table 15: Latin America Custom Bulletproof Armored Vehicle Market Revenue (USD Billion) Forecast, by Segment 3, 2018-2029
Table 16: Latin America Custom Bulletproof Armored Vehicle Market Revenue (USD Billion) Forecast, by Country, 2018-2029
Table 17: Asia Pacific Custom Bulletproof Armored Vehicle Market Revenue (USD Billion) Forecast, by Segment 1, 2018-2029
Table 18: Asia Pacific Custom Bulletproof Armored Vehicle Market Revenue (USD Billion) Forecast, by Segment 2, 2018-2029
Table 19: Asia Pacific Custom Bulletproof Armored Vehicle Market Revenue (USD Billion) Forecast, by Segment 3, 2018-2029
Table 20: Asia Pacific Custom Bulletproof Armored Vehicle Market Revenue (USD Billion) Forecast, by Country, 2018-2029
Table 21: Middle East & Africa Custom Bulletproof Armored Vehicle Market Revenue (USD Billion) Forecast, by Segment 1, 2018-2029
Table 22: Middle East & Africa Custom Bulletproof Armored Vehicle Market Revenue (USD Billion) Forecast, by Segment 2, 2018-2029
Table 23: Middle East & Africa Custom Bulletproof Armored Vehicle Market Revenue (USD Billion) Forecast, by Segment 3, 2018-2029
Table 24: Middle East & Africa Custom Bulletproof Armored Vehicle Market Revenue (USD Billion) Forecast, by Country, 2018-2029
Research Process
Data Library Research are conducted by industry experts who offer insight on
industry structure, market segmentations technology assessment and competitive landscape (CL), and penetration, as well as on emerging trends. Their analysis is based on primary interviews (~ 80%) and secondary research (~ 20%) as well as years of professional expertise in their respective industries. Adding to this, by analysing historical trends and current market positions, our analysts predict where the market will be headed for the next five years. Furthermore, the varying trends of segment & categories geographically presented are also studied and the estimated based on the primary & secondary research.
In this particular report from the supply side Data Library Research has conducted primary surveys (interviews) with the key level executives (VP, CEO’s, Marketing Director, Business Development Manager
and SOFT) of the companies that active & prominent as well as the midsized organization
FIGURE 1: DLR RESEARH PROCESS
![research-methodology1]()
Primary Research
Extensive primary research was conducted to gain a deeper insight of the market and industry performance. The analysis is based on both primary and secondary research as well as years of professional expertise in the respective industries.
In addition to analysing current and historical trends, our analysts predict where the market is headed over the next five years.
It varies by segment for these categories geographically presented in the list of market tables. Speaking about this particular report we have conducted primary surveys (interviews) with the key level executives (VP, CEO’s, Marketing Director, Business Development Manager and many more) of the major players active in the market.
Secondary Research
Secondary research was mainly used to collect and identify information useful for the extensive, technical, market-oriented, and Friend’s study of the Global Extra Neutral Alcohol. It was also used to obtain key information about major players, market classification and segmentation according to the industry trends, geographical markets, and developments related to the market and technology perspectives. For this study, analysts have gathered information from various credible sources, such as annual reports, sec filings, journals, white papers, SOFT presentations, and company web sites.
Market Size Estimation
Both, top-down and bottom-up approaches were used to estimate and validate the size of the Global market and to estimate the size of various other dependent submarkets in the overall Extra Neutral Alcohol. The key players in the market were identified through secondary research and their market contributions in the respective geographies were determined through primary and secondary research.
Forecast Model
![research-methodology2]()