Data Conversion Development Boards and Kits Market Overview and Analysis
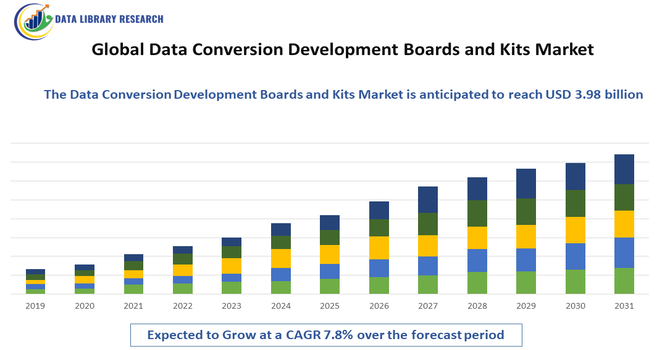
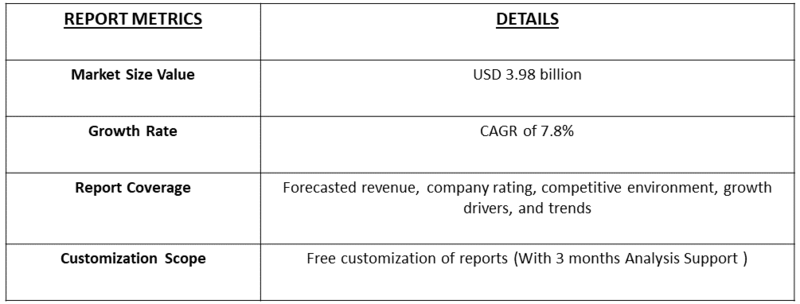
- The Global Data Conversion Development Boards and Kits Market size is estimated to be USD 1.8 billion in 2025 and is expected to reach USD 3.98 billion in the year 2032, growing with a CAGR of 7.8% from 2025-2032.
Get Complete Analysis Of The Report - Download Updated Free Sample PDF
Data Conversion Development Boards and Kits are hardware platforms designed to evaluate, prototype, and develop systems involving analog-to-digital (ADC) and digital-to-analog (DAC) conversion. They help engineers test performance, integrate sensors, process signals, and interface with microcontrollers or processors for applications in audio, instrumentation, communications, and embedded systems.
The growth of the Data Conversion Development Boards and Kits market is driven by rising demand for high-performance signal processing in applications such as IoT devices, industrial automation, automotive electronics, and consumer gadgets. Increasing adoption of mixed-signal systems, advancements in ADC/DAC technology, and growing need for efficient data acquisition, testing, and prototyping tools among engineers and developers further boost market expansion. Additionally, the proliferation of AI, 5G, and connected devices fuels demand for precise, high-speed data conversion solutions integrated into development platforms for rapid innovation and product development.
Data Conversion Development Boards and Kits Market Trends
The Data Conversion Development Boards and Kits market is witnessing trends such as increasing integration of high-resolution and low-power ADC/DAC components, growing use of modular and customizable platforms, and rising adoption of USB- and FPGA-based evaluation kits for faster prototyping. There is also a shift toward compact, multifunctional boards supporting multiple communication interfaces to meet diverse application needs. Moreover, trends like AI-driven signal processing, 5G deployment, and IoT expansion are driving demand for advanced data conversion solutions, while manufacturers focus on enhancing software support, real-time analysis tools, and cloud-based development environments to streamline testing and accelerate product innovation.
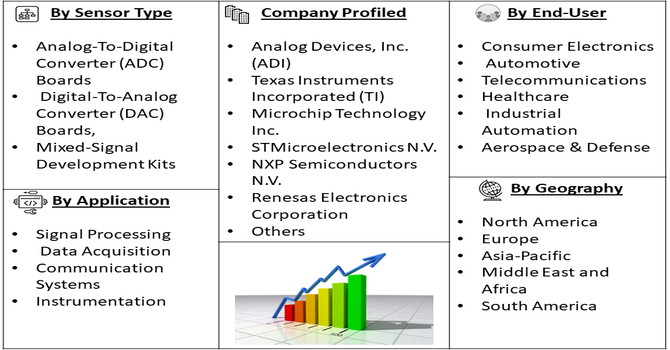
Segmentation: The Data Conversion Development Boards and Kits market can be by Type (Analog-To-Digital Converter (ADC) Boards, Digital-To-Analog Converter (DAC) Boards, and Mixed-Signal Development Kits), Application (Signal Processing, Data Acquisition, Communication Systems, and Instrumentation), End Users (Consumer Electronics, Automotive, Telecommunications, Healthcare, Industrial Automation, and Aerospace & Defense) and Geography (North America, Europe, Asia-Pacific, Middle East and Africa, and South America). The report provides the value (in USD million) for the above segments.
For Detailed Market Segmentation - Get a Free Sample PDF
Market Drivers:
- Rising Adoption of IoT and Connected Devices
The increasing proliferation of Internet of Things (IoT) devices across industries such as healthcare, automotive, industrial automation, and consumer electronics is a major driver for the Data Conversion Development Boards and Kits market. IoT applications require precise conversion of analog sensor data into digital formats for accurate monitoring, control, and analytics. Development boards equipped with high-performance ADCs and DACs enable engineers to design and test efficient data acquisition systems quickly. Moreover, as connected devices generate large volumes of real-time data, the demand for faster and more accurate data conversion tools continues to rise.
- Advancements in Mixed-Signal and High-Speed Data Conversion Technologies
Technological advancements in mixed-signal processing and high-speed ADC/DAC designs are fueling the growth of the Data Conversion Development Boards and Kits market. Modern applications such as 5G communication, AI-driven edge devices, and advanced instrumentation require high-resolution, low-noise, and energy-efficient data conversion systems.
In June 2024, NEC had developed a radio-over-fiber system using a 1-bit fiber transmission method, enabling cost-effective millimeter-wave networks for Beyond 5G/6G. This advancement had impacted the Global Data Conversion Development Boards and Kits Market by increasing demand for high-frequency, low-cost ADC/DAC solutions and fostering the development of compact, energy-efficient prototyping boards for next-generation wireless and optical communication applications. Development boards that integrate these advanced technologies enable designers to prototype complex circuits with improved signal integrity and processing speeds. Furthermore, the availability of boards supporting multiple interfaces like USB, SPI, and Ethernet enhances system flexibility and integration capability.
Market Restraint
- High Cost and Complexity of Advanced Development Boards
One of the major restraints for the Data Conversion Development Boards and Kits market is the high cost and complexity associated with advanced boards. Boards featuring high-speed ADCs, DACs, and multi-interface capabilities often require significant investment, making them less accessible to small and medium enterprises or academic users. Additionally, the integration of complex mixed-signal architectures demands specialized technical expertise for configuration, calibration, and software development, which can limit widespread adoption. The need for compatible software tools and ongoing maintenance further adds to operational costs.
Socio-Economic Impact on Global Data Conversion Development Boards and Kits Market
The Data Conversion Modules and Services Market has a profound socioeconomic impact by acting as a critical enabler of the digital economy. Economically, it drives efficiency and cost reduction by converting incompatible, unstructured, or legacy data (like paper records) into unified, analyzable digital formats. This improves business intelligence and allows organizations to make faster, data-driven decisions, increasing competitiveness and profitability. Socially, this conversion facilitates digital transformation in public services like healthcare and government, making information more accessible and secure. It supports the creation of high-value jobs in data analytics, engineering, and cybersecurity, fostering a skilled workforce essential for the 21st-century knowledge economy.
Segmental Analysis:
- Digital-To-Analog Converter (DAC) Boards Segment is Expected to Witness Significant Growth Over the Forecast Period
The Digital-To-Analog Converter (DAC) boards segment is expected to experience strong growth due to rising demand for high-quality audio, video, and communication systems. DAC boards play a key role in converting digital signals into analog form for accurate sound, image, and signal output. With increasing adoption of advanced consumer electronics, automotive infotainment systems, and industrial automation tools, the need for precise and efficient DAC solutions is expanding. Additionally, the growth of IoT and connected devices requiring real-time signal processing is further boosting the adoption of DAC development boards for testing, evaluation, and product innovation across multiple industries.
- Signal Processing Segment is Expected to Witness Significant Growth Over the Forecast Period
The signal processing segment is expected to grow rapidly as industries increasingly rely on accurate data conversion for real-time analysis and decision-making. Data Conversion Development Boards and Kits help engineers process, filter, and interpret signals effectively in complex systems. With rising demand in applications such as medical imaging, audio enhancement, industrial monitoring, and autonomous systems, efficient signal processing tools are becoming essential. Advancements in high-speed ADCs and DACs are enabling faster and more precise conversion, improving system performance. The expansion of AI, machine learning, and 5G technologies further strengthens this segment, creating opportunities for innovation and development in advanced signal processing solutions.
- Telecommunications Segment is Expected to Witness Significant Growth Over the Forecast Period
The telecommunications segment is set to witness significant growth due to the rapid expansion of 5G networks, data centers, and high-speed communication systems. Data Conversion Development Boards and Kits are essential for designing and testing transceivers, modems, and base stations that require precise signal conversion. As the demand for faster data transmission and enhanced connectivity increases, telecom equipment manufacturers are focusing on high-performance ADC and DAC boards for signal quality and system efficiency. Additionally, the integration of cloud computing and IoT in telecom infrastructure is further driving the need for reliable data conversion tools, supporting the segment’s strong market outlook.
- North America Region is Expected to Witness Significant Growth Over the Forecast Period
North America is expected to experience significant growth in the Data Conversion Development Boards and Kits market due to strong technological advancement and widespread adoption of innovative electronic systems. The region’s well-established industries, including telecommunications, automotive, aerospace, and healthcare, are increasingly using these boards for R&D, testing, and prototyping.
Additionally, major semiconductor and electronics companies in the U.S. and Canada are investing heavily in high-speed data conversion technologies to support next-generation devices. For instance, in April 2025, Microchip had introduced the PIC16F17576 8-bit MCUs, optimized for low-cost, low-power analog sensor applications. With integrated low-power comparators, voltage references, up to four op amps, and a 12-bit differential ADC, these MCUs had enabled efficient analog measurements with minimal power consumption. This innovation had strengthened the North America Data Conversion Development Boards and Kits Market by driving adoption of energy-efficient, sensor-focused development platforms across industrial, automotive, and IoT applications. Thus, the growing demand for automation, IoT applications, and AI-driven systems further strengthens market growth, making North America a leading hub for development and deployment of advanced data conversion solutions.
To Learn More About This Report - Request a Free Sample Copy
Data Conversion Development Boards and Kits Market Competitive Analysis
@@@@ The competitive landscape of the Data Conversion Development Boards and Kits market is characterized by the presence of several global and regional players focusing on innovation, product quality, and technological advancement. Key companies such as Analog Devices, Texas Instruments, Microchip Technology, STMicroelectronics, Maxim Integrated, and Renesas Electronics dominate the market through a wide range of ADC and DAC development solutions. These players emphasize enhancing performance, speed, and integration capabilities to meet growing industry demands. Strategic partnerships, mergers, and collaborations are common to expand product portfolios and strengthen market presence. Additionally, emerging players and startups are entering the market with cost-effective, application-specific boards catering to niche industrial and educational sectors.
The 20 major players for above market:
- Analog Devices, Inc. (ADI)
- Texas Instruments Incorporated (TI)
- Microchip Technology Inc.
- STMicroelectronics N.V.
- NXP Semiconductors N.V.
- Renesas Electronics Corporation
- Infineon Technologies AG
- Rohm Semiconductor
- Maxim Integrated Products, Inc. (now part of ADI)
- Cirrus Logic, Inc.
- Asahi Kasei Microdevices Corporation (AKM)
- ON Semiconductor Corporation
- THine Electronics, Inc.
- Lattice Semiconductor Corporation
- ESS Technology, Inc.
- Broadcom Inc.
- Samsung Electronics Co., Ltd.
- Sony Corporation
- Panasonic Corporation
- MikroElektronika d.o.o. (specialty/kit-board provider)
Recent Development
- IN June 2025, Imec and IDLab’s breakthrough 7-bit 150 GSa/s DAC, unveiled at the 2025 Symposium on VLSI Technology and Circuits, had accelerated innovation in the Global Data Conversion Development Boards and Kits Market. It had driven advancements in high-speed, power-efficient data conversion technologies, enhancing performance in data center, AI, and communication applications while inspiring next-generation board and kit designs.
- In June 2023, Analog Devices, Inc. launched its Apollo MxFE platform, a cutting-edge software-defined, direct RF-sampling mixed signal front end, enabling advanced 6G, radar, and surveillance applications. This innovation had positively impacted the Global Data Conversion Development Boards and Kits Market by accelerating demand for high-performance, wideband ADC/DAC solutions and inspiring the development of next-generation mixed-signal prototyping platforms.
Frequently Asked Questions (FAQ) :
Q1. What are the main growth driving factors for this market?
The market is primarily driven by the massive growth of the Internet of Things (IoT), requiring rapid prototyping of connected devices, and the overall digital transformation across all industries. Data conversion is essential for systems like 5G networks, smart cities, and industrial automation (Industry 4.0), where analog sensor data must be accurately and efficiently converted to digital for processing. Development boards accelerate this process, offering a quick, testable platform for engineers to design and validate high-speed, high-precision data acquisition systems before committing to final chip design.
Q2. What are the main restraining factors for this market?
A major restraining factor is the high cost and complexity associated with advanced, high-resolution data converter components and the corresponding development kits. These sophisticated tools demand specialized technical skills for effective integration, programming, and calibration, which can be a significant barrier for smaller businesses and new developers. Furthermore, the constant and rapid pace of technological change means that today's cutting-edge boards can quickly become obsolete, necessitating continuous investment in new versions.
Q3. Which segment is expected to witness high growth?
The segment tied to high-speed and precision data conversion is expected to witness the highest growth, mainly driven by applications in 5G communication and advanced test & measurement (T&M) equipment. These applications require Analog-to-Digital Converters (ADCs) and Digital-to-Analog Converters (DACs) with extremely fast sampling rates and high accuracy to handle the vast amounts of real-time data being transmitted. The development kits that support these high-performance systems for quick market entry will be in particularly high demand.
Q4. Who are the top major players for this market?
The market is led by major semiconductor companies that specialize in high-performance analog and mixed-signal components. The top major players include Analog Devices Inc. (ADI) and Texas Instruments (TI), who are renowned for their extensive portfolios of high-speed ADCs and DACs and the development boards built around them. Other significant contributors are companies like STMicroelectronics and NXP Semiconductors, which offer a wide range of development kits that integrate data converters with microcontrollers for embedded systems.
Q5. Which country is the largest player?
North America, particularly the United States, is widely considered the largest regional player in the market for high-value, high-performance Data Conversion Development Boards and Kits. This dominance stems from the strong presence of major technology corporations, a robust research and development ecosystem, and high defense/aerospace spending which requires cutting-edge conversion technology. However, the Asia-Pacific (APAC) region, driven by China's massive manufacturing base and growing tech infrastructure, is rapidly growing and holds the largest production share for general development boards.
List of Figures
Figure 1: Global Data Conversion Development Boards and Kits Market Revenue Breakdown (USD Billion, %) by Region, 2022 & 2029
Figure 2: Global Data Conversion Development Boards and Kits Market Value Share (%), By Segment 1, 2022 & 2029
Figure 3: Global Data Conversion Development Boards and Kits Market Forecast (USD Billion), by Sub-Segment 1, 2018-2029
Figure 4: Global Data Conversion Development Boards and Kits Market Forecast (USD Billion), by Sub-Segment 2, 2018-2029
Figure 5: Global Data Conversion Development Boards and Kits Market Value Share (%), By Segment 2, 2022 & 2029
Figure 6: Global Data Conversion Development Boards and Kits Market Forecast (USD Billion), by Sub-Segment 1, 2018-2029
Figure 7: Global Data Conversion Development Boards and Kits Market Forecast (USD Billion), by Sub-Segment 2, 2018-2029
Figure 8: Global Data Conversion Development Boards and Kits Market Forecast (USD Billion), by Sub-Segment 3, 2018-2029
Figure 9: Global Data Conversion Development Boards and Kits Market Forecast (USD Billion), by Others, 2018-2029
Figure 10: Global Data Conversion Development Boards and Kits Market Value Share (%), By Segment 3, 2022 & 2029
Figure 11: Global Data Conversion Development Boards and Kits Market Forecast (USD Billion), by Sub-Segment 1, 2018-2029
Figure 12: Global Data Conversion Development Boards and Kits Market Forecast (USD Billion), by Sub-Segment 2, 2018-2029
Figure 13: Global Data Conversion Development Boards and Kits Market Forecast (USD Billion), by Sub-Segment 3, 2018-2029
Figure 14: Global Data Conversion Development Boards and Kits Market Forecast (USD Billion), by Others, 2018-2029
Figure 15: Global Data Conversion Development Boards and Kits Market Value (USD Billion), by Region, 2022 & 2029
Figure 16: North America Data Conversion Development Boards and Kits Market Value Share (%), By Segment 1, 2022 & 2029
Figure 17: North America Data Conversion Development Boards and Kits Market Forecast (USD Billion), by Sub-Segment 1, 2018-2029
Figure 18: North America Data Conversion Development Boards and Kits Market Forecast (USD Billion), by Sub-Segment 2, 2018-2029
Figure 19: North America Data Conversion Development Boards and Kits Market Value Share (%), By Segment 2, 2022 & 2029
Figure 20: North America Data Conversion Development Boards and Kits Market Forecast (USD Billion), by Sub-Segment 1, 2018-2029
Figure 21: North America Data Conversion Development Boards and Kits Market Forecast (USD Billion), by Sub-Segment 2, 2018-2029
Figure 22: North America Data Conversion Development Boards and Kits Market Forecast (USD Billion), by Sub-Segment 3, 2018-2029
Figure 23: North America Data Conversion Development Boards and Kits Market Forecast (USD Billion), by Others, 2018-2029
Figure 24: North America Data Conversion Development Boards and Kits Market Value Share (%), By Segment 3, 2022 & 2029
Figure 25: North America Data Conversion Development Boards and Kits Market Forecast (USD Billion), by Sub-Segment 1, 2018-2029
Figure 26: North America Data Conversion Development Boards and Kits Market Forecast (USD Billion), by Sub-Segment 2, 2018-2029
Figure 27: North America Data Conversion Development Boards and Kits Market Forecast (USD Billion), by Sub-Segment 3, 2018-2029
Figure 28: North America Data Conversion Development Boards and Kits Market Forecast (USD Billion), by Others, 2018-2029
Figure 29: North America Data Conversion Development Boards and Kits Market Forecast (USD Billion), by U.S., 2018-2029
Figure 30: North America Data Conversion Development Boards and Kits Market Forecast (USD Billion), by Canada, 2018-2029
Figure 31: Latin America Data Conversion Development Boards and Kits Market Value Share (%), By Segment 1, 2022 & 2029
Figure 32: Latin America Data Conversion Development Boards and Kits Market Forecast (USD Billion), by Sub-Segment 1, 2018-2029
Figure 33: Latin America Data Conversion Development Boards and Kits Market Forecast (USD Billion), by Sub-Segment 2, 2018-2029
Figure 34: Latin America Data Conversion Development Boards and Kits Market Value Share (%), By Segment 2, 2022 & 2029
Figure 35: Latin America Data Conversion Development Boards and Kits Market Forecast (USD Billion), by Sub-Segment 1, 2018-2029
Figure 36: Latin America Data Conversion Development Boards and Kits Market Forecast (USD Billion), by Sub-Segment 2, 2018-2029
Figure 37: Latin America Data Conversion Development Boards and Kits Market Forecast (USD Billion), by Sub-Segment 3, 2018-2029
Figure 38: Latin America Data Conversion Development Boards and Kits Market Forecast (USD Billion), by Others, 2018-2029
Figure 39: Latin America Data Conversion Development Boards and Kits Market Value Share (%), By Segment 3, 2022 & 2029
Figure 40: Latin America Data Conversion Development Boards and Kits Market Forecast (USD Billion), by Sub-Segment 1, 2018-2029
Figure 41: Latin America Data Conversion Development Boards and Kits Market Forecast (USD Billion), by Sub-Segment 2, 2018-2029
Figure 42: Latin America Data Conversion Development Boards and Kits Market Forecast (USD Billion), by Sub-Segment 3, 2018-2029
Figure 43: Latin America Data Conversion Development Boards and Kits Market Forecast (USD Billion), by Others, 2018-2029
Figure 44: Latin America Data Conversion Development Boards and Kits Market Forecast (USD Billion), by Brazil, 2018-2029
Figure 45: Latin America Data Conversion Development Boards and Kits Market Forecast (USD Billion), by Mexico, 2018-2029
Figure 46: Latin America Data Conversion Development Boards and Kits Market Forecast (USD Billion), by Rest of Latin America, 2018-2029
Figure 47: Europe Data Conversion Development Boards and Kits Market Value Share (%), By Segment 1, 2022 & 2029
Figure 48: Europe Data Conversion Development Boards and Kits Market Forecast (USD Billion), by Sub-Segment 1, 2018-2029
Figure 49: Europe Data Conversion Development Boards and Kits Market Forecast (USD Billion), by Sub-Segment 2, 2018-2029
Figure 50: Europe Data Conversion Development Boards and Kits Market Value Share (%), By Segment 2, 2022 & 2029
Figure 51: Europe Data Conversion Development Boards and Kits Market Forecast (USD Billion), by Sub-Segment 1, 2018-2029
Figure 52: Europe Data Conversion Development Boards and Kits Market Forecast (USD Billion), by Sub-Segment 2, 2018-2029
Figure 53: Europe Data Conversion Development Boards and Kits Market Forecast (USD Billion), by Sub-Segment 3, 2018-2029
Figure 54: Europe Data Conversion Development Boards and Kits Market Forecast (USD Billion), by Others, 2018-2029
Figure 55: Europe Data Conversion Development Boards and Kits Market Value Share (%), By Segment 3, 2022 & 2029
Figure 56: Europe Data Conversion Development Boards and Kits Market Forecast (USD Billion), by Sub-Segment 1, 2018-2029
Figure 57: Europe Data Conversion Development Boards and Kits Market Forecast (USD Billion), by Sub-Segment 2, 2018-2029
Figure 58: Europe Data Conversion Development Boards and Kits Market Forecast (USD Billion), by Sub-Segment 3, 2018-2029
Figure 59: Europe Data Conversion Development Boards and Kits Market Forecast (USD Billion), by Others, 2018-2029
Figure 60: Europe Data Conversion Development Boards and Kits Market Forecast (USD Billion), by U.K., 2018-2029
Figure 61: Europe Data Conversion Development Boards and Kits Market Forecast (USD Billion), by Germany, 2018-2029
Figure 62: Europe Data Conversion Development Boards and Kits Market Forecast (USD Billion), by France, 2018-2029
Figure 63: Europe Data Conversion Development Boards and Kits Market Forecast (USD Billion), by Italy, 2018-2029
Figure 64: Europe Data Conversion Development Boards and Kits Market Forecast (USD Billion), by Spain, 2018-2029
Figure 65: Europe Data Conversion Development Boards and Kits Market Forecast (USD Billion), by Russia, 2018-2029
Figure 66: Europe Data Conversion Development Boards and Kits Market Forecast (USD Billion), by Rest of Europe, 2018-2029
Figure 67: Asia Pacific Data Conversion Development Boards and Kits Market Value Share (%), By Segment 1, 2022 & 2029
Figure 68: Asia Pacific Data Conversion Development Boards and Kits Market Forecast (USD Billion), by Sub-Segment 1, 2018-2029
Figure 69: Asia Pacific Data Conversion Development Boards and Kits Market Forecast (USD Billion), by Sub-Segment 2, 2018-2029
Figure 70: Asia Pacific Data Conversion Development Boards and Kits Market Value Share (%), By Segment 2, 2022 & 2029
Figure 71: Asia Pacific Data Conversion Development Boards and Kits Market Forecast (USD Billion), by Sub-Segment 1, 2018-2029
Figure 72: Asia Pacific Data Conversion Development Boards and Kits Market Forecast (USD Billion), by Sub-Segment 2, 2018-2029
Figure 73: Asia Pacific Data Conversion Development Boards and Kits Market Forecast (USD Billion), by Sub-Segment 3, 2018-2029
Figure 74: Asia Pacific Data Conversion Development Boards and Kits Market Forecast (USD Billion), by Others, 2018-2029
Figure 75: Asia Pacific Data Conversion Development Boards and Kits Market Value Share (%), By Segment 3, 2022 & 2029
Figure 76: Asia Pacific Data Conversion Development Boards and Kits Market Forecast (USD Billion), by Sub-Segment 1, 2018-2029
Figure 77: Asia Pacific Data Conversion Development Boards and Kits Market Forecast (USD Billion), by Sub-Segment 2, 2018-2029
Figure 78: Asia Pacific Data Conversion Development Boards and Kits Market Forecast (USD Billion), by Sub-Segment 3, 2018-2029
Figure 79: Asia Pacific Data Conversion Development Boards and Kits Market Forecast (USD Billion), by Others, 2018-2029
Figure 80: Asia Pacific Data Conversion Development Boards and Kits Market Forecast (USD Billion), by China, 2018-2029
Figure 81: Asia Pacific Data Conversion Development Boards and Kits Market Forecast (USD Billion), by India, 2018-2029
Figure 82: Asia Pacific Data Conversion Development Boards and Kits Market Forecast (USD Billion), by Japan, 2018-2029
Figure 83: Asia Pacific Data Conversion Development Boards and Kits Market Forecast (USD Billion), by Australia, 2018-2029
Figure 84: Asia Pacific Data Conversion Development Boards and Kits Market Forecast (USD Billion), by Southeast Asia, 2018-2029
Figure 85: Asia Pacific Data Conversion Development Boards and Kits Market Forecast (USD Billion), by Rest of Asia Pacific, 2018-2029
Figure 86: Middle East & Africa Data Conversion Development Boards and Kits Market Value Share (%), By Segment 1, 2022 & 2029
Figure 87: Middle East & Africa Data Conversion Development Boards and Kits Market Forecast (USD Billion), by Sub-Segment 1, 2018-2029
Figure 88: Middle East & Africa Data Conversion Development Boards and Kits Market Forecast (USD Billion), by Sub-Segment 2, 2018-2029
Figure 89: Middle East & Africa Data Conversion Development Boards and Kits Market Value Share (%), By Segment 2, 2022 & 2029
Figure 90: Middle East & Africa Data Conversion Development Boards and Kits Market Forecast (USD Billion), by Sub-Segment 1, 2018-2029
Figure 91: Middle East & Africa Data Conversion Development Boards and Kits Market Forecast (USD Billion), by Sub-Segment 2, 2018-2029
Figure 92: Middle East & Africa Data Conversion Development Boards and Kits Market Forecast (USD Billion), by Sub-Segment 3, 2018-2029
Figure 93: Middle East & Africa Data Conversion Development Boards and Kits Market Forecast (USD Billion), by Others, 2018-2029
Figure 94: Middle East & Africa Data Conversion Development Boards and Kits Market Value Share (%), By Segment 3, 2022 & 2029
Figure 95: Middle East & Africa Data Conversion Development Boards and Kits Market Forecast (USD Billion), by Sub-Segment 1, 2018-2029
Figure 96: Middle East & Africa Data Conversion Development Boards and Kits Market Forecast (USD Billion), by Sub-Segment 2, 2018-2029
Figure 97: Middle East & Africa Data Conversion Development Boards and Kits Market Forecast (USD Billion), by Sub-Segment 3, 2018-2029
Figure 98: Middle East & Africa Data Conversion Development Boards and Kits Market Forecast (USD Billion), by Others, 2018-2029
Figure 99: Middle East & Africa Data Conversion Development Boards and Kits Market Forecast (USD Billion), by GCC, 2018-2029
Figure 100: Middle East & Africa Data Conversion Development Boards and Kits Market Forecast (USD Billion), by South Africa, 2018-2029
Figure 101: Middle East & Africa Data Conversion Development Boards and Kits Market Forecast (USD Billion), by Rest of Middle East & Africa, 2018-2029
List of Tables
Table 1: Global Data Conversion Development Boards and Kits Market Revenue (USD Billion) Forecast, by Segment 1, 2018-2029
Table 2: Global Data Conversion Development Boards and Kits Market Revenue (USD Billion) Forecast, by Segment 2, 2018-2029
Table 3: Global Data Conversion Development Boards and Kits Market Revenue (USD Billion) Forecast, by Segment 3, 2018-2029
Table 4: Global Data Conversion Development Boards and Kits Market Revenue (USD Billion) Forecast, by Region, 2018-2029
Table 5: North America Data Conversion Development Boards and Kits Market Revenue (USD Billion) Forecast, by Segment 1, 2018-2029
Table 6: North America Data Conversion Development Boards and Kits Market Revenue (USD Billion) Forecast, by Segment 2, 2018-2029
Table 7: North America Data Conversion Development Boards and Kits Market Revenue (USD Billion) Forecast, by Segment 3, 2018-2029
Table 8: North America Data Conversion Development Boards and Kits Market Revenue (USD Billion) Forecast, by Country, 2018-2029
Table 9: Europe Data Conversion Development Boards and Kits Market Revenue (USD Billion) Forecast, by Segment 1, 2018-2029
Table 10: Europe Data Conversion Development Boards and Kits Market Revenue (USD Billion) Forecast, by Segment 2, 2018-2029
Table 11: Europe Data Conversion Development Boards and Kits Market Revenue (USD Billion) Forecast, by Segment 3, 2018-2029
Table 12: Europe Data Conversion Development Boards and Kits Market Revenue (USD Billion) Forecast, by Country, 2018-2029
Table 13: Latin America Data Conversion Development Boards and Kits Market Revenue (USD Billion) Forecast, by Segment 1, 2018-2029
Table 14: Latin America Data Conversion Development Boards and Kits Market Revenue (USD Billion) Forecast, by Segment 2, 2018-2029
Table 15: Latin America Data Conversion Development Boards and Kits Market Revenue (USD Billion) Forecast, by Segment 3, 2018-2029
Table 16: Latin America Data Conversion Development Boards and Kits Market Revenue (USD Billion) Forecast, by Country, 2018-2029
Table 17: Asia Pacific Data Conversion Development Boards and Kits Market Revenue (USD Billion) Forecast, by Segment 1, 2018-2029
Table 18: Asia Pacific Data Conversion Development Boards and Kits Market Revenue (USD Billion) Forecast, by Segment 2, 2018-2029
Table 19: Asia Pacific Data Conversion Development Boards and Kits Market Revenue (USD Billion) Forecast, by Segment 3, 2018-2029
Table 20: Asia Pacific Data Conversion Development Boards and Kits Market Revenue (USD Billion) Forecast, by Country, 2018-2029
Table 21: Middle East & Africa Data Conversion Development Boards and Kits Market Revenue (USD Billion) Forecast, by Segment 1, 2018-2029
Table 22: Middle East & Africa Data Conversion Development Boards and Kits Market Revenue (USD Billion) Forecast, by Segment 2, 2018-2029
Table 23: Middle East & Africa Data Conversion Development Boards and Kits Market Revenue (USD Billion) Forecast, by Segment 3, 2018-2029
Table 24: Middle East & Africa Data Conversion Development Boards and Kits Market Revenue (USD Billion) Forecast, by Country, 2018-2029
Research Process
Data Library Research are conducted by industry experts who offer insight on
industry structure, market segmentations technology assessment and competitive landscape (CL), and penetration, as well as on emerging trends. Their analysis is based on primary interviews (~ 80%) and secondary research (~ 20%) as well as years of professional expertise in their respective industries. Adding to this, by analysing historical trends and current market positions, our analysts predict where the market will be headed for the next five years. Furthermore, the varying trends of segment & categories geographically presented are also studied and the estimated based on the primary & secondary research.
In this particular report from the supply side Data Library Research has conducted primary surveys (interviews) with the key level executives (VP, CEO’s, Marketing Director, Business Development Manager
and SOFT) of the companies that active & prominent as well as the midsized organization
FIGURE 1: DLR RESEARH PROCESS
![research-methodology1]()
Primary Research
Extensive primary research was conducted to gain a deeper insight of the market and industry performance. The analysis is based on both primary and secondary research as well as years of professional expertise in the respective industries.
In addition to analysing current and historical trends, our analysts predict where the market is headed over the next five years.
It varies by segment for these categories geographically presented in the list of market tables. Speaking about this particular report we have conducted primary surveys (interviews) with the key level executives (VP, CEO’s, Marketing Director, Business Development Manager and many more) of the major players active in the market.
Secondary Research
Secondary research was mainly used to collect and identify information useful for the extensive, technical, market-oriented, and Friend’s study of the Global Extra Neutral Alcohol. It was also used to obtain key information about major players, market classification and segmentation according to the industry trends, geographical markets, and developments related to the market and technology perspectives. For this study, analysts have gathered information from various credible sources, such as annual reports, sec filings, journals, white papers, SOFT presentations, and company web sites.
Market Size Estimation
Both, top-down and bottom-up approaches were used to estimate and validate the size of the Global market and to estimate the size of various other dependent submarkets in the overall Extra Neutral Alcohol. The key players in the market were identified through secondary research and their market contributions in the respective geographies were determined through primary and secondary research.
Forecast Model
![research-methodology2]()