Personalized Nutrition Market Overview
The global Personalized Nutrition market is expected to rise at a significant rate in the coming years. Growing elderly populations across regions, as well as changing consumer trends such as rising consumer demands for high-quality nutritional food, are expected to boost personalized nutrition approaches. Market growth is projected to be aided by rising demand for personalized nutrition.
Personalized nutrition market growth is projected to be hampered by the high cost of nutrition plans and dietary supplements during the forecast period. On the other hand, technological developments and expanding innovations, are projected to continue to provide market growth prospects.
| Report Metric |
Details |
| Market size available for years |
2023–2030 |
| Base year considered |
2023 |
| Forecast period |
2024–2030 |
| Forecast unit |
Value (USD Million) |
| Segments covered |
Product Type, End User, and Region. |
| Regions covered |
North America (the U.S. and Canada), Europe (UK, Germany, France, Italy, Spain, Russia, Rest of Europe), Asia-Pacific (China, India, Japan, Australia, South East Asia, Rest of Asia Pacific), Latin America and the Middle East and Africa (Brazil, Saudi Arabia, UAE, Rest of LAMEA) |
| Companies covered |
BASF SE, DSM, Herbalife Nutrition Ltd., Amway, Dnafit, Wellness Coaches, Atlas Biomed Group Limited, Habit Food Personalized, LLC., Persona, Bactolac Pharmaceutical, Inc. |
Covid-19 Impact on Personalized Nutrition Market
Consumers across the globe are adjusting to the new normal and there is a noteworthy discrepancy in consumer behavior. Consumer's purchasing habits, behavior, and attitudes have changed in light of COVID-19. People are shopping very consciously and are majorly centered on basic needs and are buying locally. Consumers are using digital commerce to play, learn, and connect to manage isolation and follow social distancing policy. The covid-19 has consistently impacted the shopping behavior of 9 in 10 consumers. Nearly 30-50 percent of the consumers have shifted towards online shopping from March 2020 to December 2020.
Personalized Nutrition Market Segment Overview
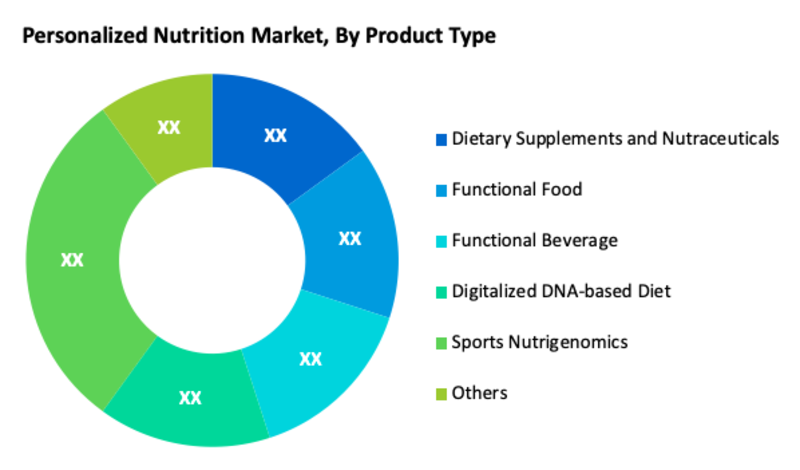
According to Product Type, Sports Nutrigenomics is one of the most prominent segments of the global Personalized Nutrition Market. During the projected period, the sports nutrigenomics segment is expected to increase at the fastest rate. Increased intake of functional supplements for sports performance improvement and weight control can be contributed to the segment's growth.
Based on End User, Direct-to-Consumer is another major segment in the global market. During the projected period, the direct-to-consumer segment is expected to be the largest. Customers' changing preferences for nutrition-rich products available on the market to improve their health can be related to the segment's growth.
Personalized Nutrition Market, By Product Type
· Dietary Supplements and Nutraceuticals
· Functional Food
· Functional Beverage
· Digitalized DNA-based Diet
· Sports Nutrigenomics
· Others
Personalized Nutrition Market, By End User
· Direct-to-Consumer
· Wellness and Fitness Centers
· Hospitals and Clinics
Personalized Nutrition Market Regional Overview
North America, Europe, Asia Pacific, Middle East and Africa, and South America are the regions in which the personalized nutrition market is divided. During the projection period, North America is expected to be the largest segment. The increase in regional growth can be due to customers' growing knowledge of their health. The presence of major companies delivering personalized nutrition in this region is expected to add to the regional market. Customers have also been encouraged to choose specialized dietary supplements that are tailored to their specific needs as a result of their faster and more hectic lifestyles.
Furthermore, due to the growing elderly patient pool, increasing frequency of lifestyle problems, lack of nutrition, and increasing consumer spending capacity in the region, Asia Pacific is predicted to develop at the quickest rate throughout the forecast period.
Personalized Nutrition Market, By Geography
· North America (US & Canada)
· Europe (UK, Germany, France, Italy, Spain, Russia & Rest of Europe)
· Asia-Pacific (Japan, China, India, Australia, & South Korea, & Rest of Asia-Pacific)
· LAMEA (Brazil, Saudi Arabia, UAE & Rest of LAMEA)
Personalized Nutrition Market Competitor overview
Some key developments and strategies adopted by manufacturers in Personalized Nutrition are highlighted below.
· In February 2020, Metagenics, Inc., a health sciences company, announced the release of CardioLux HDL, the newest patent-pending formula launched in the Metagenics product line. CardioLux HDL provides phytonutrient and vitamin support for healthy HDL function.
Personalized Nutrition Market, Key Players
· BASF SE
· DSM
· Herbalife Nutrition Ltd.
· Amway
· Dnafit
· Wellness Coaches
· Atlas Biomed Group Limited
· Habit Food Personalized, LLC.
· Persona
· Bactolac Pharmaceutical, Inc.
Frequently Asked Questions (FAQ) :
Q1. What are the driving factors for the global Personalized Nutrition market?
Personalized Nutrition Market growth is projected to be aided by rising demand for personalized nutrition.
Q2. Which Segments are covered in the global Personalized Nutrition market report?
Product Type, End User, and Region. these segments are covered in the global Personalized Nutrition market report
Q3. Which segment is projected to hold the largest share in the global Personalized Nutrition market?
Sports Nutrigenomics segment is projected to hold the largest share in the global Personalized Nutrition market
Q4. Which region holds the largest share in the global Personalized Nutrition market?
North America holds the largest share in the global Personalized Nutrition market
Q5. Which are the prominent players in the global Personalized Nutrition market?
BASF SE, DSM, Herbalife Nutrition Ltd., Amway, Dnafit, Wellness Coaches, Atlas Biomed Group Limited, Habit Food Personalized, LLC., Persona, Bactolac Pharmaceutical, Inc. are some key players in the global Personalized Nutrition market
List of Figures
Figure 1: Global Personalized Nutrition Market Revenue Breakdown (USD Billion, %) by Region, 2019 & 2027
Figure 2: Global Personalized Nutrition Market Value Share (%), By Segment 1, 2019 & 2027
Figure 3: Global Personalized Nutrition Market Forecast (USD Billion), by Sub-Segment 1, 2016-2027
Figure 4: Global Personalized Nutrition Market Forecast (USD Billion), by Sub-Segment 2, 2016-2027
Figure 5: Global Personalized Nutrition Market Value Share (%), By Segment 2, 2019 & 2027
Figure 6: Global Personalized Nutrition Market Forecast (USD Billion), by Sub-Segment 1, 2016-2027
Figure 7: Global Personalized Nutrition Market Forecast (USD Billion), by Sub-Segment 2, 2016-2027
Figure 8: Global Personalized Nutrition Market Forecast (USD Billion), by Sub-Segment 3, 2016-2027
Figure 9: Global Personalized Nutrition Market Forecast (USD Billion), by Others, 2016-2027
Figure 10: Global Personalized Nutrition Market Value Share (%), By Segment 3, 2019 & 2027
Figure 11: Global Personalized Nutrition Market Forecast (USD Billion), by Sub-Segment 1, 2016-2027
Figure 12: Global Personalized Nutrition Market Forecast (USD Billion), by Sub-Segment 2, 2016-2027
Figure 13: Global Personalized Nutrition Market Forecast (USD Billion), by Sub-Segment 3, 2016-2027
Figure 14: Global Personalized Nutrition Market Forecast (USD Billion), by Others, 2016-2027
Figure 15: Global Personalized Nutrition Market Value (USD Billion), by Region, 2019 & 2027
Figure 16: North America Personalized Nutrition Market Value Share (%), By Segment 1, 2019 & 2027
Figure 17: North America Personalized Nutrition Market Forecast (USD Billion), by Sub-Segment 1, 2016-2027
Figure 18: North America Personalized Nutrition Market Forecast (USD Billion), by Sub-Segment 2, 2016-2027
Figure 19: North America Personalized Nutrition Market Value Share (%), By Segment 2, 2019 & 2027
Figure 20: North America Personalized Nutrition Market Forecast (USD Billion), by Sub-Segment 1, 2016-2027
Figure 21: North America Personalized Nutrition Market Forecast (USD Billion), by Sub-Segment 2, 2016-2027
Figure 22: North America Personalized Nutrition Market Forecast (USD Billion), by Sub-Segment 3, 2016-2027
Figure 23: North America Personalized Nutrition Market Forecast (USD Billion), by Others, 2016-2027
Figure 24: North America Personalized Nutrition Market Value Share (%), By Segment 3, 2019 & 2027
Figure 25: North America Personalized Nutrition Market Forecast (USD Billion), by Sub-Segment 1, 2016-2027
Figure 26: North America Personalized Nutrition Market Forecast (USD Billion), by Sub-Segment 2, 2016-2027
Figure 27: North America Personalized Nutrition Market Forecast (USD Billion), by Sub-Segment 3, 2016-2027
Figure 28: North America Personalized Nutrition Market Forecast (USD Billion), by Others, 2016-2027
Figure 29: North America Personalized Nutrition Market Forecast (USD Billion), by U.S., 2016-2027
Figure 30: North America Personalized Nutrition Market Forecast (USD Billion), by Canada, 2016-2027
Figure 31: Latin America Personalized Nutrition Market Value Share (%), By Segment 1, 2019 & 2027
Figure 32: Latin America Personalized Nutrition Market Forecast (USD Billion), by Sub-Segment 1, 2016-2027
Figure 33: Latin America Personalized Nutrition Market Forecast (USD Billion), by Sub-Segment 2, 2016-2027
Figure 34: Latin America Personalized Nutrition Market Value Share (%), By Segment 2, 2019 & 2027
Figure 35: Latin America Personalized Nutrition Market Forecast (USD Billion), by Sub-Segment 1, 2016-2027
Figure 36: Latin America Personalized Nutrition Market Forecast (USD Billion), by Sub-Segment 2, 2016-2027
Figure 37: Latin America Personalized Nutrition Market Forecast (USD Billion), by Sub-Segment 3, 2016-2027
Figure 38: Latin America Personalized Nutrition Market Forecast (USD Billion), by Others, 2016-2027
Figure 39: Latin America Personalized Nutrition Market Value Share (%), By Segment 3, 2019 & 2027
Figure 40: Latin America Personalized Nutrition Market Forecast (USD Billion), by Sub-Segment 1, 2016-2027
Figure 41: Latin America Personalized Nutrition Market Forecast (USD Billion), by Sub-Segment 2, 2016-2027
Figure 42: Latin America Personalized Nutrition Market Forecast (USD Billion), by Sub-Segment 3, 2016-2027
Figure 43: Latin America Personalized Nutrition Market Forecast (USD Billion), by Others, 2016-2027
Figure 44: Latin America Personalized Nutrition Market Forecast (USD Billion), by Brazil, 2016-2027
Figure 45: Latin America Personalized Nutrition Market Forecast (USD Billion), by Mexico, 2016-2027
Figure 46: Latin America Personalized Nutrition Market Forecast (USD Billion), by Rest of Latin America, 2016-2027
Figure 47: Europe Personalized Nutrition Market Value Share (%), By Segment 1, 2019 & 2027
Figure 48: Europe Personalized Nutrition Market Forecast (USD Billion), by Sub-Segment 1, 2016-2027
Figure 49: Europe Personalized Nutrition Market Forecast (USD Billion), by Sub-Segment 2, 2016-2027
Figure 50: Europe Personalized Nutrition Market Value Share (%), By Segment 2, 2019 & 2027
Figure 51: Europe Personalized Nutrition Market Forecast (USD Billion), by Sub-Segment 1, 2016-2027
Figure 52: Europe Personalized Nutrition Market Forecast (USD Billion), by Sub-Segment 2, 2016-2027
Figure 53: Europe Personalized Nutrition Market Forecast (USD Billion), by Sub-Segment 3, 2016-2027
Figure 54: Europe Personalized Nutrition Market Forecast (USD Billion), by Others, 2016-2027
Figure 55: Europe Personalized Nutrition Market Value Share (%), By Segment 3, 2019 & 2027
Figure 56: Europe Personalized Nutrition Market Forecast (USD Billion), by Sub-Segment 1, 2016-2027
Figure 57: Europe Personalized Nutrition Market Forecast (USD Billion), by Sub-Segment 2, 2016-2027
Figure 58: Europe Personalized Nutrition Market Forecast (USD Billion), by Sub-Segment 3, 2016-2027
Figure 59: Europe Personalized Nutrition Market Forecast (USD Billion), by Others, 2016-2027
Figure 60: Europe Personalized Nutrition Market Forecast (USD Billion), by U.K., 2016-2027
Figure 61: Europe Personalized Nutrition Market Forecast (USD Billion), by Germany, 2016-2027
Figure 62: Europe Personalized Nutrition Market Forecast (USD Billion), by France, 2016-2027
Figure 63: Europe Personalized Nutrition Market Forecast (USD Billion), by Italy, 2016-2027
Figure 64: Europe Personalized Nutrition Market Forecast (USD Billion), by Spain, 2016-2027
Figure 65: Europe Personalized Nutrition Market Forecast (USD Billion), by Russia, 2016-2027
Figure 66: Europe Personalized Nutrition Market Forecast (USD Billion), by Rest of Europe, 2016-2027
Figure 67: Asia Pacific Personalized Nutrition Market Value Share (%), By Segment 1, 2019 & 2027
Figure 68: Asia Pacific Personalized Nutrition Market Forecast (USD Billion), by Sub-Segment 1, 2016-2027
Figure 69: Asia Pacific Personalized Nutrition Market Forecast (USD Billion), by Sub-Segment 2, 2016-2027
Figure 70: Asia Pacific Personalized Nutrition Market Value Share (%), By Segment 2, 2019 & 2027
Figure 71: Asia Pacific Personalized Nutrition Market Forecast (USD Billion), by Sub-Segment 1, 2016-2027
Figure 72: Asia Pacific Personalized Nutrition Market Forecast (USD Billion), by Sub-Segment 2, 2016-2027
Figure 73: Asia Pacific Personalized Nutrition Market Forecast (USD Billion), by Sub-Segment 3, 2016-2027
Figure 74: Asia Pacific Personalized Nutrition Market Forecast (USD Billion), by Others, 2016-2027
Figure 75: Asia Pacific Personalized Nutrition Market Value Share (%), By Segment 3, 2019 & 2027
Figure 76: Asia Pacific Personalized Nutrition Market Forecast (USD Billion), by Sub-Segment 1, 2016-2027
Figure 77: Asia Pacific Personalized Nutrition Market Forecast (USD Billion), by Sub-Segment 2, 2016-2027
Figure 78: Asia Pacific Personalized Nutrition Market Forecast (USD Billion), by Sub-Segment 3, 2016-2027
Figure 79: Asia Pacific Personalized Nutrition Market Forecast (USD Billion), by Others, 2016-2027
Figure 80: Asia Pacific Personalized Nutrition Market Forecast (USD Billion), by China, 2016-2027
Figure 81: Asia Pacific Personalized Nutrition Market Forecast (USD Billion), by India, 2016-2027
Figure 82: Asia Pacific Personalized Nutrition Market Forecast (USD Billion), by Japan, 2016-2027
Figure 83: Asia Pacific Personalized Nutrition Market Forecast (USD Billion), by Australia, 2016-2027
Figure 84: Asia Pacific Personalized Nutrition Market Forecast (USD Billion), by Southeast Asia, 2016-2027
Figure 85: Asia Pacific Personalized Nutrition Market Forecast (USD Billion), by Rest of Asia Pacific, 2016-2027
Figure 86: Middle East & Africa Personalized Nutrition Market Value Share (%), By Segment 1, 2019 & 2027
Figure 87: Middle East & Africa Personalized Nutrition Market Forecast (USD Billion), by Sub-Segment 1, 2016-2027
Figure 88: Middle East & Africa Personalized Nutrition Market Forecast (USD Billion), by Sub-Segment 2, 2016-2027
Figure 89: Middle East & Africa Personalized Nutrition Market Value Share (%), By Segment 2, 2019 & 2027
Figure 90: Middle East & Africa Personalized Nutrition Market Forecast (USD Billion), by Sub-Segment 1, 2016-2027
Figure 91: Middle East & Africa Personalized Nutrition Market Forecast (USD Billion), by Sub-Segment 2, 2016-2027
Figure 92: Middle East & Africa Personalized Nutrition Market Forecast (USD Billion), by Sub-Segment 3, 2016-2027
Figure 93: Middle East & Africa Personalized Nutrition Market Forecast (USD Billion), by Others, 2016-2027
Figure 94: Middle East & Africa Personalized Nutrition Market Value Share (%), By Segment 3, 2019 & 2027
Figure 95: Middle East & Africa Personalized Nutrition Market Forecast (USD Billion), by Sub-Segment 1, 2016-2027
Figure 96: Middle East & Africa Personalized Nutrition Market Forecast (USD Billion), by Sub-Segment 2, 2016-2027
Figure 97: Middle East & Africa Personalized Nutrition Market Forecast (USD Billion), by Sub-Segment 3, 2016-2027
Figure 98: Middle East & Africa Personalized Nutrition Market Forecast (USD Billion), by Others, 2016-2027
Figure 99: Middle East & Africa Personalized Nutrition Market Forecast (USD Billion), by GCC, 2016-2027
Figure 100: Middle East & Africa Personalized Nutrition Market Forecast (USD Billion), by South Africa, 2016-2027
Figure 101: Middle East & Africa Personalized Nutrition Market Forecast (USD Billion), by Rest of Middle East & Africa, 2016-2027
List of Tables
Table 1: Global Personalized Nutrition Market Revenue (USD Billion) Forecast, by Segment 1, 2016-2027
Table 2: Global Personalized Nutrition Market Revenue (USD Billion) Forecast, by Segment 2, 2016-2027
Table 3: Global Personalized Nutrition Market Revenue (USD Billion) Forecast, by Segment 3, 2016-2027
Table 4: Global Personalized Nutrition Market Revenue (USD Billion) Forecast, by Region, 2016-2027
Table 5: North America Personalized Nutrition Market Revenue (USD Billion) Forecast, by Segment 1, 2016-2027
Table 6: North America Personalized Nutrition Market Revenue (USD Billion) Forecast, by Segment 2, 2016-2027
Table 7: North America Personalized Nutrition Market Revenue (USD Billion) Forecast, by Segment 3, 2016-2027
Table 8: North America Personalized Nutrition Market Revenue (USD Billion) Forecast, by Country, 2016-2027
Table 9: Europe Personalized Nutrition Market Revenue (USD Billion) Forecast, by Segment 1, 2016-2027
Table 10: Europe Personalized Nutrition Market Revenue (USD Billion) Forecast, by Segment 2, 2016-2027
Table 11: Europe Personalized Nutrition Market Revenue (USD Billion) Forecast, by Segment 3, 2016-2027
Table 12: Europe Personalized Nutrition Market Revenue (USD Billion) Forecast, by Country, 2016-2027
Table 13: Latin America Personalized Nutrition Market Revenue (USD Billion) Forecast, by Segment 1, 2016-2027
Table 14: Latin America Personalized Nutrition Market Revenue (USD Billion) Forecast, by Segment 2, 2016-2027
Table 15: Latin America Personalized Nutrition Market Revenue (USD Billion) Forecast, by Segment 3, 2016-2027
Table 16: Latin America Personalized Nutrition Market Revenue (USD Billion) Forecast, by Country, 2016-2027
Table 17: Asia Pacific Personalized Nutrition Market Revenue (USD Billion) Forecast, by Segment 1, 2016-2027
Table 18: Asia Pacific Personalized Nutrition Market Revenue (USD Billion) Forecast, by Segment 2, 2016-2027
Table 19: Asia Pacific Personalized Nutrition Market Revenue (USD Billion) Forecast, by Segment 3, 2016-2027
Table 20: Asia Pacific Personalized Nutrition Market Revenue (USD Billion) Forecast, by Country, 2016-2027
Table 21: Middle East & Africa Personalized Nutrition Market Revenue (USD Billion) Forecast, by Segment 1, 2016-2027
Table 22: Middle East & Africa Personalized Nutrition Market Revenue (USD Billion) Forecast, by Segment 2, 2016-2027
Table 23: Middle East & Africa Personalized Nutrition Market Revenue (USD Billion) Forecast, by Segment 3, 2016-2027
Table 24: Middle East & Africa Personalized Nutrition Market Revenue (USD Billion) Forecast, by Country, 2016-2027
Research Process
Data Library Research are conducted by industry experts who offer insight on
industry structure, market segmentations technology assessment and competitive landscape (CL), and penetration, as well as on emerging trends. Their analysis is based on primary interviews (~ 80%) and secondary research (~ 20%) as well as years of professional expertise in their respective industries. Adding to this, by analysing historical trends and current market positions, our analysts predict where the market will be headed for the next five years. Furthermore, the varying trends of segment & categories geographically presented are also studied and the estimated based on the primary & secondary research.
In this particular report from the supply side Data Library Research has conducted primary surveys (interviews) with the key level executives (VP, CEO’s, Marketing Director, Business Development Manager
and SOFT) of the companies that active & prominent as well as the midsized organization
FIGURE 1: DLR RESEARH PROCESS
![research-methodology1]()
Primary Research
Extensive primary research was conducted to gain a deeper insight of the market and industry performance. The analysis is based on both primary and secondary research as well as years of professional expertise in the respective industries.
In addition to analysing current and historical trends, our analysts predict where the market is headed over the next five years.
It varies by segment for these categories geographically presented in the list of market tables. Speaking about this particular report we have conducted primary surveys (interviews) with the key level executives (VP, CEO’s, Marketing Director, Business Development Manager and many more) of the major players active in the market.
Secondary Research
Secondary research was mainly used to collect and identify information useful for the extensive, technical, market-oriented, and Friend’s study of the Global Extra Neutral Alcohol. It was also used to obtain key information about major players, market classification and segmentation according to the industry trends, geographical markets, and developments related to the market and technology perspectives. For this study, analysts have gathered information from various credible sources, such as annual reports, sec filings, journals, white papers, SOFT presentations, and company web sites.
Market Size Estimation
Both, top-down and bottom-up approaches were used to estimate and validate the size of the Global market and to estimate the size of various other dependent submarkets in the overall Extra Neutral Alcohol. The key players in the market were identified through secondary research and their market contributions in the respective geographies were determined through primary and secondary research.
Forecast Model
![research-methodology2]()