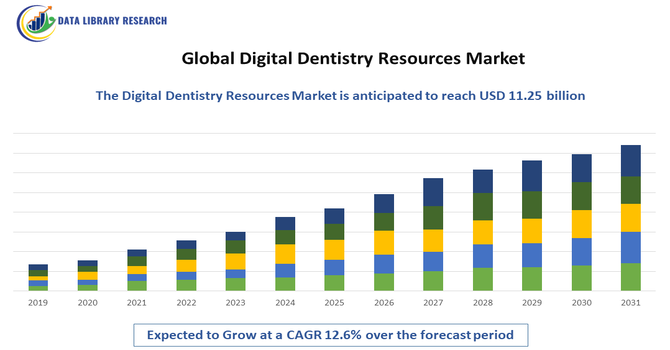
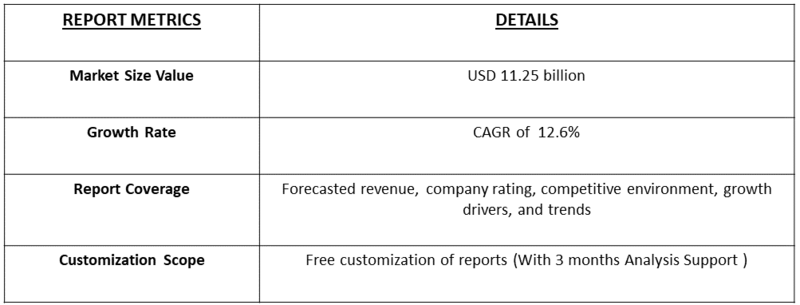
Digital Dentistry Resources Market Overview and Analysis:

The market is forecast to reach up to USD 17.8 billion by 2032. It is expected to grow robustly, with a consistent CAGR in the range of 12.6% during the forecast period from 2025-2032, from USD 11.25 billion in the year 2025.

The Global Digital Dentistry Resources Market is experiencing robust growth driven by the rapid adoption of advanced digital technologies across dental diagnostics, treatment planning, and restorative procedures. The increasing prevalence of dental disorders, rising demand for cosmetic dentistry, and the growing emphasis on precision and efficiency in dental care are key factors fueling market expansion. The integration of CAD/CAM systems, 3D printing, intraoral scanners, and digital imaging technologies has revolutionized clinical workflows, enhancing patient outcomes and reducing turnaround times.

Digital Dentistry Resources Market Latest Trends:

The latest trends in the Global Digital Dentistry Resources market show rapid, cross-cutting digitalization: artificial intelligence is being embedded across the entire dental workflow — from automated diagnostics and treatment-planning to design and quality checks — improving speed and diagnostic accuracy. Intraoral scanners and chairside CAD/CAM systems continue to become standard equipment, enabling same-day restorations and tighter integration between clinics and labs, while 3D printing is expanding beyond models into definitive restorations, removable prosthetics and surgical guides, driving faster, more personalized care.

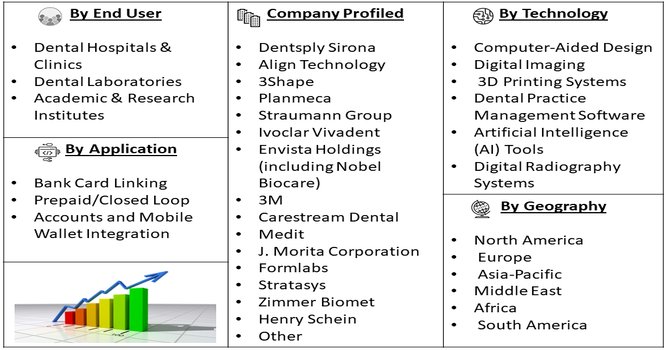
Segmentation: Global Digital Dentistry Resources Market is segmented By Technology (Computer-Aided Design, Digital Imaging, 3D Printing Systems, Dental Practice Management Software, Artificial Intelligence (AI) Tools, Digital Radiography Systems), Application (Diagnosis & Imaging, Restorative Dentistry, Orthodontics, Implantology, Prosthodontics, Oral Surgery), End User (Dental Hospitals & Clinics, Dental Laboratories, and Academic & Research Institutes), and Geography (North America, Europe, Asia-Pacific, Middle East and Africa, and South America). The report provides the value (in USD million) for the above segments.

Market Drivers:

  • Rising Adoption of Advanced Dental Technologies

The growing integration of CAD/CAM systems, 3D printing, intraoral scanners, and AI-powered diagnostic tools is a key driver accelerating the digital dentistry resources market. These technologies enable high-precision diagnostics, streamlined workflows, and reduced treatment time, improving both clinical efficiency and patient satisfaction.

In September 2023, Dentsply Sirona launched the DS Academy Campus, a platform focused on digital dentistry. The initiative aimed to support the clinical growth of dental professionals by providing access to a wide range of on-demand and live educational content. These courses covered topics in restorative dentistry and orthodontics, emphasizing digital workflows and techniques. The campus enabled practitioners to enhance their skills, stay updated with the latest technologies, and improve patient care. Thus, the increasing focus on accuracy, aesthetics, and minimally invasive procedures has further propelled dental professionals to adopt digital solutions across restorative and orthodontic applications.

  • Increasing Demand for Aesthetic and Preventive Dental Care

The global rise in awareness regarding oral health and cosmetic dentistry is significantly driving market growth. For instance, in March 2025, Align Technology, Inc. introduced Align X-ray Insights in the European Union and the United Kingdom. This AI-powered, software-based computer-aided detection (CADe) solution automatically analyzes 2D radiographs, helping dental professionals identify issues more accurately and efficiently. Patients are increasingly seeking advanced, customized, and painless dental treatments, leading clinics to invest in digital technologies that support real-time imaging, same-day restorations, and personalized treatment plans.

Additionally, the growing prevalence of dental disorders and the emphasis on preventive care are boosting demand for digital diagnostic and treatment planning tools across both developed and emerging markets. For instance, in July 2025, an article published by Journal of Periodontology reported that, 1990 and 2021, oral disorders affected 3.74 billion people, reflecting a 35.54% increase in incidence. Tropical Latin America and Southeast Asia showed higher age-standardized rates. Dental caries in permanent teeth rose 6%, while deciduous teeth caries declined 7.83%. Periodontal disease cases surged 76.32%, and edentulism increased 93.56%. Projections indicated that oral disorders, particularly periodontal diseases, would continue to grow over the next 30 years, highlighting a rising global prevalence of dental conditions.

Market Restraints:

  • High Initial Investment and Maintenance Cost

One of the primary challenges is the high initial investment and maintenance cost associated with digital equipment such as CAD/CAM systems, intraoral scanners, and 3D printers. These technologies require significant capital expenditure, making adoption difficult for small and mid-sized dental practices, particularly in developing regions. Additionally, the lack of skilled professionals and adequate training in operating advanced digital systems hampers optimal utilization and slows technological integration within clinical workflows. Furthermore, data security and privacy concerns related to cloud-based dental management solutions pose regulatory and ethical challenges. Together, these factors may restrict the widespread adoption of digital dentistry resources, especially in cost-sensitive markets.

Socio Economic Impact on Digital Dentistry Resources Market

An article titled, Global-, Regional-, and Country-Level Economic Impacts of Dental Diseases in 2015, reported that, dental issues were creating such a massive financial strain around the world that governments were forced to take a hard look at their healthcare spending. In fact, that year's global treatment cost alone was estimated at an astonishing USD 357 billion. On top of that, countries lost another USD 188 billion because people couldn't work due to their oral health issues. The study also reported that, wealthy nations suffered the biggest financial hit per person, with severe tooth loss being the main reason people missed work. Essentially, poor oral health isn't just a physical issue; it severely damages the economy, stresses household budgets, and makes existing social inequalities worse. That's why making preventive dental care easily available could be one of the best ways to boost everyone’s overall well-being.

Segmental Analysis

  • Digital Imaging segment is expected to witness highest growth over the forecast period

The digital imaging segment has grown rapidly because it gives dental professionals exceptionally clear and accurate views of a patient’s mouth. Instead of using traditional impression materials, dentists now rely on intraoral scanners to create precise digital models. Even more impactful are 3D imaging systems like CBCT scans, which provide detailed views of bone, nerves, and surrounding structures before complex procedures such as implant placement. This level of accuracy improves safety, speeds up treatment, and allows for far more predictable outcomes—key reasons why demand for advanced imaging continues to rise.

  • Restorative Dentistry segment is expected to witness highest growth over the forecast period

Restorative dentistry remains a major market because patients consistently need crowns, bridges, veneers, and other corrective treatments. Recent technology has transformed how quickly these restorations can be delivered. With CAD/CAM systems, dentists can scan a damaged tooth and create a customized crown or filling right in their office, often in a single visit. This eliminates the wait time and extra appointments associated with traditional lab work. The combination of convenience, accuracy, and quicker results has made same-day dentistry increasingly popular and a strong driver of growth in the restorative segment.

  • Dental Hospitals & Clinics segment is expected to witness highest growth over the forecast period

Dental hospitals and clinics lead the market in equipment purchases simply because they see the highest number of patients and require efficient, high-capacity tools. These facilities invest heavily in advanced scanners, CBCT units, and chairside milling systems to manage daily patient flow. They also play a key role in training new dentists, which means the latest technologies quickly become part of standard practice. Their continuous need to update equipment makes them one of the biggest contributors to digital dentistry market growth.

  • North America segment is expected to witness highest growth over the forecast period

North America remains the largest market for digital dental technology due to its early adoption of advanced tools and strong investment in high-quality oral care. The competitive nature of private dental practices encourages clinics to upgrade equipment to attract patients seeking modern, efficient treatment.

Well-developed healthcare infrastructure and supportive financing options also make it easier for practices to invest in costly digital systems. For instance, in March 2024, Desktop Health, the medical 3D printing brand of Desktop Metal, introduced ScanUp, a program designed to make digital adoption easier for dental practices. After a beta phase launched in late 2022 with hundreds of users, including major DSOs like Western Dental and Smile Brands, the program is now available broadly. ScanUp is expected to accelerate digital dentistry adoption across North America by lowering upfront costs, improving access to high-quality scanners, and helping clinics shift toward fully digital workflows. This supports faster, more efficient care and strengthens the region’s position as a leader in dental technology use. Thus, these factors create a cycle of continuous technology adoption, keeping North America at the forefront of growth in the digital dentistry market

Digital Dentistry Resources Market Competitive Landscape:

The competitive landscape of the Global Digital Dentistry Resources market is highly dynamic and crowded, led by a mix of large dental-equipment manufacturers, specialized digital-lab and software vendors, and fast-growing 3D printing and intraoral-scanner challengers. Market leaders compete on product innovation (CAD/CAM, intraoral scanners, CBCT, 3D printing), software ecosystems and cloud/data services, strategic partnerships, and channel reach into clinics and labs; mid-sized and niche players focus on specialized hardware or software and regional service advantages. Ongoing consolidation, product launches, and cross-industry collaborations (dental materials + digital hardware + AI software) are intensifying competition and accelerating technology-driven differentiation across segments.

Key Players:

  • Dentsply Sirona
  • Align Technology
  • 3Shape
  • Planmeca
  • Straumann Group
  • Ivoclar Vivadent
  • Envista Holdings (including Nobel Biocare)
  • 3M
  • Carestream Dental
  • Medit
  • J. Morita Corporation
  • Formlabs
  • Stratasys
  • Zimmer Biomet
  • Henry Schein
  • GC Corporation
  • Amann Girrbach
  • Shining 3D
  • Exocad GmbH
  • KaVo Dental

Recent Development

  • In July 2025, 3D Systems announced the full commercial launch of its NextDent Jetted Denture Solution in the U.S. This first-of-its-kind technology produces monolithic dentures by printing multiple materials in a single process, creating strong, long-lasting, and natural-looking results. The system offers a faster, more affordable, and highly scalable alternative to traditional denture manufacturing, improving the patient experience and delivering strong financial benefits for dental labs that use it.


  • In March 2025, Solventum a major name in dental composites and restorative solutions, announced a strategic partnership with SprintRay, a leader in chairside 3D printing. Together, they aim to advance in-office production of 3D-printed crowns, inlays, onlays, and other restorations. The collaboration focuses on developing durable, high-quality materials and workflows that make same-day permanent restorations possible, offering patients and dentists results comparable to traditional multi-visit, lab-made options.


Frequently Asked Questions (FAQ) :

Q1. What are the main growth-driving factors for this market?

The primary driver is the demand for improved treatment accuracy, speed, and patient experience. Digital tools like intraoral scanners eliminate messy traditional impressions, increasing patient comfort and workflow efficiency. Furthermore, the decreasing cost of high-speed 3D printers and CAD/CAM software, combined with a global shift toward minimally invasive procedures and aesthetic dentistry, strongly motivates dental practices to adopt these modern resources.

Q2. What are the main restraining factors for this market?

A significant constraint is the high initial capital investment required to purchase digital equipment, such as intraoral scanners and specialized milling machines, which is a major hurdle for smaller clinics. The market is also challenged by the need for extensive training and a steep learning curve for dental professionals to effectively use complex digital workflows and software. Reluctance among older practitioners to abandon familiar analog techniques also slows adoption.

Q3. Which segment is expected to witness high growth?

The Digital Imaging segment is driven by replacing messy traditional impressions with intraoral scanners, which dramatically improve patient comfort and clinic efficiency. These scanners deliver superior accuracy for crowns and aligners. Their seamless integration with CAD/CAM and 3D printing streamlines the entire fabrication process, positioning digital imaging as the key foundation for modern dental practices.

Q4. Who are the top major players for this market?

The market features major imaging companies and specialized dental tech providers. Top major players include Dentsply Sirona, 3Shape A/S, Henry Schein, Inc., and Align Technology (makers of iTero scanners). Competition centers on developing integrated digital ecosystems that link the dental clinic to the lab, offering bundled solutions that span scanning, design (CAD), and manufacturing (CAM) to ensure seamless, end-to-end digital workflows.

Q5. Which country is the largest player?

The United States is the largest country player in the Global Digital Dentistry Resources Market. This dominance is driven by high per-capita healthcare expenditure, high consumer demand for cosmetic and aesthetic dental services, and rapid technological adoption in dental schools and large group practices. High insurance coverage and a culture of continuous professional education also ensure that U.S. dentists are early and significant investors in premium digital technologies.

Digital Dentistry Resources MARKET STUDY GLOBAL MARKET ANALYSIS, INSIGHTS AND FORECAST, 2022-2029

    1. Introduction

    • 1.1. Research Scope
    • 1.2. Market Segmentation
    • 1.3. Research Methodology
    • 1.4. Definitions and Assumptions

    2. Executive Summary

      3. Market Dynamics

      • 3.1. Market Drivers
      • 3.2. Market Restraints
      • 3.3. Market Opportunities

      4. Key Insights

      • 4.1. Key Emerging Trends – For Major Countries
      • 4.2. Latest Technological Advancement
      • 4.3. Regulatory Landscape
      • 4.4. Industry SWOT Analysis
      • 4.5. Porters Five Forces Analysis

      5. Global Digital Dentistry Resources Market Analysis (USD Billion), Insights and Forecast, 2018-2029

      • 5.1. Key Findings / Summary
      • 5.2. Market Analysis, Insights and Forecast – By Segment 1
        • 5.2.1. Sub-Segment 1
        • 5.2.2. Sub-Segment 2
      • 5.3. Market Analysis, Insights and Forecast – By Segment 2
        • 5.3.1. Sub-Segment 1
        • 5.3.2. Sub-Segment 2
        • 5.3.3. Sub-Segment 3
        • 5.3.4. Others
      • 5.4. Market Analysis, Insights and Forecast – By Segment 3
        • 5.4.1. Sub-Segment 1
        • 5.4.2. Sub-Segment 2
        • 5.4.3. Sub-Segment 3
        • 5.4.4. Others
      • 5.5. Market Analysis, Insights and Forecast – By Region
        • 5.5.1. North America
        • 5.5.2. Latin America
        • 5.5.3. Europe
        • 5.5.4. Asia Pacific
        • 5.5.5. Middle East and Africa

      6. North America Digital Dentistry Resources Market Analysis (USD Billion), Insights and Forecast, 2018-2029

      • 6.1. Key Findings / Summary
      • 6.2. Market Analysis, Insights and Forecast – By Segment 1
        • 6.2.1. Sub-Segment 1
        • 6.2.2. Sub-Segment 2
      • 6.3. Market Analysis, Insights and Forecast – By Segment 2
        • 6.3.1. Sub-Segment 1
        • 6.3.2. Sub-Segment 2
        • 6.3.3. Sub-Segment 3
        • 6.3.4. Others
      • 6.4. Market Analysis, Insights and Forecast – By Segment 3
        • 6.4.1. Sub-Segment 1
        • 6.4.2. Sub-Segment 2
        • 6.4.3. Sub-Segment 3
        • 6.4.4. Others
      • 6.5. Market Analysis, Insights and Forecast – By Country
        • 6.5.1. U.S.
        • 6.5.2. Canada

      7. Latin America Digital Dentistry Resources Market Analysis (USD Billion), Insights and Forecast, 2018-2029

      • 7.1. Key Findings / Summary
      • 7.2. Market Analysis, Insights and Forecast – By Segment 1
        • 7.2.1. Sub-Segment 1
        • 7.2.2. Sub-Segment 2
      • 7.3. Market Analysis, Insights and Forecast – By Segment 2
        • 7.3.1. Sub-Segment 1
        • 7.3.2. Sub-Segment 2
        • 7.3.3. Sub-Segment 3
        • 7.3.4. Others
      • 7.4. Market Analysis, Insights and Forecast – By Segment 3
        • 7.4.1. Sub-Segment 1
        • 7.4.2. Sub-Segment 2
        • 7.4.3. Sub-Segment 3
        • 7.4.4. Others
      • 7.5. Insights and Forecast – By Country
        • 7.5.1. Brazil
        • 7.5.2. Mexico
        • 7.5.3. Rest of Latin America

      8. Europe Digital Dentistry Resources Market Analysis (USD Billion), Insights and Forecast, 2018-2029

      • 8.1. Key Findings / Summary
      • 8.2. Market Analysis, Insights and Forecast – By Segment 1
        • 8.2.1. Sub-Segment 1
        • 8.2.2. Sub-Segment 2
      • 8.3. Market Analysis, Insights and Forecast – By Segment 2
        • 8.3.1. Sub-Segment 1
        • 8.3.2. Sub-Segment 2
        • 8.3.3. Sub-Segment 3
        • 8.3.4. Others
      • 8.4. Market Analysis, Insights and Forecast – By Segment 3
        • 8.4.1. Sub-Segment 1
        • 8.4.2. Sub-Segment 2
        • 8.4.3. Sub-Segment 3
        • 8.4.4. Others
      • 8.5. Market Analysis, Insights and Forecast – By Country
        • 8.5.1. UK
        • 8.5.2. Germany
        • 8.5.3. France
        • 8.5.4. Italy
        • 8.5.5. Spain
        • 8.5.6. Russia
        • 8.5.7. Rest of Europe

      9. Asia Pacific Digital Dentistry Resources Market Analysis (USD Billion), Insights and Forecast, 2018-2029

      • 9.1. Key Findings / Summary
      • 9.2. Market Analysis, Insights and Forecast – By Segment 1
        • 9.2.1. Sub-Segment 1
        • 9.2.2. Sub-Segment 2
      • 9.3. Market Analysis, Insights and Forecast – By Segment 2
        • 9.3.1. Sub-Segment 1
        • 9.3.2. Sub-Segment 2
        • 9.3.3. Sub-Segment 3
        • 9.3.4. Others
      • 9.4. Market Analysis, Insights and Forecast – By Segment 3
        • 9.4.1. Sub-Segment 1
        • 9.4.2. Sub-Segment 2
        • 9.4.3. Sub-Segment 3
        • 9.4.4. Others
      • 9.5. Market Analysis, Insights and Forecast – By Country
        • 9.5.1. China
        • 9.5.2. India
        • 9.5.3. Japan
        • 9.5.4. Australia
        • 9.5.5. South East Asia
        • 9.5.6. Rest of Asia Pacific

      10. Middle East & Africa Digital Dentistry Resources Market Analysis (USD Billion), Insights and Forecast, 2018-2029

      • 10.1. Key Findings / Summary
      • 10.2. Market Analysis, Insights and Forecast – By Segment 1
        • 10.2.1. Sub-Segment 1
        • 10.2.2. Sub-Segment 2
      • 10.3. Market Analysis, Insights and Forecast – By Segment 2
        • 10.3.1. Sub-Segment 1
        • 10.3.2. Sub-Segment 2
        • 10.3.3. Sub-Segment 3
        • 10.3.4. Others
      • 10.4. Market Analysis, Insights and Forecast – By Segment 3
        • 10.4.1. Sub-Segment 1
        • 10.4.2. Sub-Segment 2
        • 10.4.3. Sub-Segment 3
        • 10.4.4. Others
      • 10.5. Market Analysis, Insights and Forecast – By Country
        • 10.5.1. GCC
        • 10.5.2. South Africa
        • 10.5.3. Rest of Middle East & Africa

      11. Competitive Analysis

      • 11.1. Company Market Share Analysis, 2018
      • 11.2. Key Industry Developments
      • 11.3. Company Profile
        • 11.3.1. Company 1
          • 11.3.1.1. Business Overview
          • 11.3.1.2. Segment 1 & Service Offering
          • 11.3.1.3. Overall Revenue
          • 11.3.1.4. Geographic Presence
          • 11.3.1.5. Recent Development
        *Similar details will be provided for the following companies
        • 11.3.2. Company 2
        • 11.3.3. Company 3
        • 11.3.4. Company 4
        • 11.3.5. Company 5
        • 11.3.6. Company 6
        • 11.3.7. Company 7
        • 11.3.8. Company 8
        • 11.3.9. Company 9
        • 11.3.10. Company 10
        • 11.3.11. Company 11
        • 11.3.12. Company 12
      List of Figures

      Figure 1: Global Digital Dentistry Resources Market Revenue Breakdown (USD Billion, %) by Region, 2022 & 2029
      Figure 2: Global Digital Dentistry Resources Market Value Share (%), By Segment 1, 2022 & 2029
      Figure 3: Global Digital Dentistry Resources Market Forecast (USD Billion), by Sub-Segment 1, 2018-2029
      Figure 4: Global Digital Dentistry Resources Market Forecast (USD Billion), by Sub-Segment 2, 2018-2029
      Figure 5: Global Digital Dentistry Resources Market Value Share (%), By Segment 2, 2022 & 2029
      Figure 6: Global Digital Dentistry Resources Market Forecast (USD Billion), by Sub-Segment 1, 2018-2029
      Figure 7: Global Digital Dentistry Resources Market Forecast (USD Billion), by Sub-Segment 2, 2018-2029
      Figure 8: Global Digital Dentistry Resources Market Forecast (USD Billion), by Sub-Segment 3, 2018-2029
      Figure 9: Global Digital Dentistry Resources Market Forecast (USD Billion), by Others, 2018-2029
      Figure 10: Global Digital Dentistry Resources Market Value Share (%), By Segment 3, 2022 & 2029
      Figure 11: Global Digital Dentistry Resources Market Forecast (USD Billion), by Sub-Segment 1, 2018-2029
      Figure 12: Global Digital Dentistry Resources Market Forecast (USD Billion), by Sub-Segment 2, 2018-2029
      Figure 13: Global Digital Dentistry Resources Market Forecast (USD Billion), by Sub-Segment 3, 2018-2029
      Figure 14: Global Digital Dentistry Resources Market Forecast (USD Billion), by Others, 2018-2029
      Figure 15: Global Digital Dentistry Resources Market Value (USD Billion), by Region, 2022 & 2029
      Figure 16: North America Digital Dentistry Resources Market Value Share (%), By Segment 1, 2022 & 2029
      Figure 17: North America Digital Dentistry Resources Market Forecast (USD Billion), by Sub-Segment 1, 2018-2029
      Figure 18: North America Digital Dentistry Resources Market Forecast (USD Billion), by Sub-Segment 2, 2018-2029
      Figure 19: North America Digital Dentistry Resources Market Value Share (%), By Segment 2, 2022 & 2029
      Figure 20: North America Digital Dentistry Resources Market Forecast (USD Billion), by Sub-Segment 1, 2018-2029
      Figure 21: North America Digital Dentistry Resources Market Forecast (USD Billion), by Sub-Segment 2, 2018-2029
      Figure 22: North America Digital Dentistry Resources Market Forecast (USD Billion), by Sub-Segment 3, 2018-2029
      Figure 23: North America Digital Dentistry Resources Market Forecast (USD Billion), by Others, 2018-2029
      Figure 24: North America Digital Dentistry Resources Market Value Share (%), By Segment 3, 2022 & 2029
      Figure 25: North America Digital Dentistry Resources Market Forecast (USD Billion), by Sub-Segment 1, 2018-2029
      Figure 26: North America Digital Dentistry Resources Market Forecast (USD Billion), by Sub-Segment 2, 2018-2029
      Figure 27: North America Digital Dentistry Resources Market Forecast (USD Billion), by Sub-Segment 3, 2018-2029
      Figure 28: North America Digital Dentistry Resources Market Forecast (USD Billion), by Others, 2018-2029
      Figure 29: North America Digital Dentistry Resources Market Forecast (USD Billion), by U.S., 2018-2029
      Figure 30: North America Digital Dentistry Resources Market Forecast (USD Billion), by Canada, 2018-2029
      Figure 31: Latin America Digital Dentistry Resources Market Value Share (%), By Segment 1, 2022 & 2029
      Figure 32: Latin America Digital Dentistry Resources Market Forecast (USD Billion), by Sub-Segment 1, 2018-2029
      Figure 33: Latin America Digital Dentistry Resources Market Forecast (USD Billion), by Sub-Segment 2, 2018-2029
      Figure 34: Latin America Digital Dentistry Resources Market Value Share (%), By Segment 2, 2022 & 2029
      Figure 35: Latin America Digital Dentistry Resources Market Forecast (USD Billion), by Sub-Segment 1, 2018-2029
      Figure 36: Latin America Digital Dentistry Resources Market Forecast (USD Billion), by Sub-Segment 2, 2018-2029
      Figure 37: Latin America Digital Dentistry Resources Market Forecast (USD Billion), by Sub-Segment 3, 2018-2029
      Figure 38: Latin America Digital Dentistry Resources Market Forecast (USD Billion), by Others, 2018-2029
      Figure 39: Latin America Digital Dentistry Resources Market Value Share (%), By Segment 3, 2022 & 2029
      Figure 40: Latin America Digital Dentistry Resources Market Forecast (USD Billion), by Sub-Segment 1, 2018-2029
      Figure 41: Latin America Digital Dentistry Resources Market Forecast (USD Billion), by Sub-Segment 2, 2018-2029
      Figure 42: Latin America Digital Dentistry Resources Market Forecast (USD Billion), by Sub-Segment 3, 2018-2029
      Figure 43: Latin America Digital Dentistry Resources Market Forecast (USD Billion), by Others, 2018-2029
      Figure 44: Latin America Digital Dentistry Resources Market Forecast (USD Billion), by Brazil, 2018-2029
      Figure 45: Latin America Digital Dentistry Resources Market Forecast (USD Billion), by Mexico, 2018-2029
      Figure 46: Latin America Digital Dentistry Resources Market Forecast (USD Billion), by Rest of Latin America, 2018-2029
      Figure 47: Europe Digital Dentistry Resources Market Value Share (%), By Segment 1, 2022 & 2029
      Figure 48: Europe Digital Dentistry Resources Market Forecast (USD Billion), by Sub-Segment 1, 2018-2029
      Figure 49: Europe Digital Dentistry Resources Market Forecast (USD Billion), by Sub-Segment 2, 2018-2029
      Figure 50: Europe Digital Dentistry Resources Market Value Share (%), By Segment 2, 2022 & 2029
      Figure 51: Europe Digital Dentistry Resources Market Forecast (USD Billion), by Sub-Segment 1, 2018-2029
      Figure 52: Europe Digital Dentistry Resources Market Forecast (USD Billion), by Sub-Segment 2, 2018-2029
      Figure 53: Europe Digital Dentistry Resources Market Forecast (USD Billion), by Sub-Segment 3, 2018-2029
      Figure 54: Europe Digital Dentistry Resources Market Forecast (USD Billion), by Others, 2018-2029
      Figure 55: Europe Digital Dentistry Resources Market Value Share (%), By Segment 3, 2022 & 2029
      Figure 56: Europe Digital Dentistry Resources Market Forecast (USD Billion), by Sub-Segment 1, 2018-2029
      Figure 57: Europe Digital Dentistry Resources Market Forecast (USD Billion), by Sub-Segment 2, 2018-2029
      Figure 58: Europe Digital Dentistry Resources Market Forecast (USD Billion), by Sub-Segment 3, 2018-2029
      Figure 59: Europe Digital Dentistry Resources Market Forecast (USD Billion), by Others, 2018-2029
      Figure 60: Europe Digital Dentistry Resources Market Forecast (USD Billion), by U.K., 2018-2029
      Figure 61: Europe Digital Dentistry Resources Market Forecast (USD Billion), by Germany, 2018-2029
      Figure 62: Europe Digital Dentistry Resources Market Forecast (USD Billion), by France, 2018-2029
      Figure 63: Europe Digital Dentistry Resources Market Forecast (USD Billion), by Italy, 2018-2029
      Figure 64: Europe Digital Dentistry Resources Market Forecast (USD Billion), by Spain, 2018-2029
      Figure 65: Europe Digital Dentistry Resources Market Forecast (USD Billion), by Russia, 2018-2029
      Figure 66: Europe Digital Dentistry Resources Market Forecast (USD Billion), by Rest of Europe, 2018-2029
      Figure 67: Asia Pacific Digital Dentistry Resources Market Value Share (%), By Segment 1, 2022 & 2029
      Figure 68: Asia Pacific Digital Dentistry Resources Market Forecast (USD Billion), by Sub-Segment 1, 2018-2029
      Figure 69: Asia Pacific Digital Dentistry Resources Market Forecast (USD Billion), by Sub-Segment 2, 2018-2029
      Figure 70: Asia Pacific Digital Dentistry Resources Market Value Share (%), By Segment 2, 2022 & 2029
      Figure 71: Asia Pacific Digital Dentistry Resources Market Forecast (USD Billion), by Sub-Segment 1, 2018-2029
      Figure 72: Asia Pacific Digital Dentistry Resources Market Forecast (USD Billion), by Sub-Segment 2, 2018-2029
      Figure 73: Asia Pacific Digital Dentistry Resources Market Forecast (USD Billion), by Sub-Segment 3, 2018-2029
      Figure 74: Asia Pacific Digital Dentistry Resources Market Forecast (USD Billion), by Others, 2018-2029
      Figure 75: Asia Pacific Digital Dentistry Resources Market Value Share (%), By Segment 3, 2022 & 2029
      Figure 76: Asia Pacific Digital Dentistry Resources Market Forecast (USD Billion), by Sub-Segment 1, 2018-2029
      Figure 77: Asia Pacific Digital Dentistry Resources Market Forecast (USD Billion), by Sub-Segment 2, 2018-2029
      Figure 78: Asia Pacific Digital Dentistry Resources Market Forecast (USD Billion), by Sub-Segment 3, 2018-2029
      Figure 79: Asia Pacific Digital Dentistry Resources Market Forecast (USD Billion), by Others, 2018-2029
      Figure 80: Asia Pacific Digital Dentistry Resources Market Forecast (USD Billion), by China, 2018-2029
      Figure 81: Asia Pacific Digital Dentistry Resources Market Forecast (USD Billion), by India, 2018-2029
      Figure 82: Asia Pacific Digital Dentistry Resources Market Forecast (USD Billion), by Japan, 2018-2029
      Figure 83: Asia Pacific Digital Dentistry Resources Market Forecast (USD Billion), by Australia, 2018-2029
      Figure 84: Asia Pacific Digital Dentistry Resources Market Forecast (USD Billion), by Southeast Asia, 2018-2029
      Figure 85: Asia Pacific Digital Dentistry Resources Market Forecast (USD Billion), by Rest of Asia Pacific, 2018-2029
      Figure 86: Middle East & Africa Digital Dentistry Resources Market Value Share (%), By Segment 1, 2022 & 2029
      Figure 87: Middle East & Africa Digital Dentistry Resources Market Forecast (USD Billion), by Sub-Segment 1, 2018-2029
      Figure 88: Middle East & Africa Digital Dentistry Resources Market Forecast (USD Billion), by Sub-Segment 2, 2018-2029
      Figure 89: Middle East & Africa Digital Dentistry Resources Market Value Share (%), By Segment 2, 2022 & 2029
      Figure 90: Middle East & Africa Digital Dentistry Resources Market Forecast (USD Billion), by Sub-Segment 1, 2018-2029
      Figure 91: Middle East & Africa Digital Dentistry Resources Market Forecast (USD Billion), by Sub-Segment 2, 2018-2029
      Figure 92: Middle East & Africa Digital Dentistry Resources Market Forecast (USD Billion), by Sub-Segment 3, 2018-2029
      Figure 93: Middle East & Africa Digital Dentistry Resources Market Forecast (USD Billion), by Others, 2018-2029
      Figure 94: Middle East & Africa Digital Dentistry Resources Market Value Share (%), By Segment 3, 2022 & 2029
      Figure 95: Middle East & Africa Digital Dentistry Resources Market Forecast (USD Billion), by Sub-Segment 1, 2018-2029
      Figure 96: Middle East & Africa Digital Dentistry Resources Market Forecast (USD Billion), by Sub-Segment 2, 2018-2029
      Figure 97: Middle East & Africa Digital Dentistry Resources Market Forecast (USD Billion), by Sub-Segment 3, 2018-2029
      Figure 98: Middle East & Africa Digital Dentistry Resources Market Forecast (USD Billion), by Others, 2018-2029
      Figure 99: Middle East & Africa Digital Dentistry Resources Market Forecast (USD Billion), by GCC, 2018-2029
      Figure 100: Middle East & Africa Digital Dentistry Resources Market Forecast (USD Billion), by South Africa, 2018-2029
      Figure 101: Middle East & Africa Digital Dentistry Resources Market Forecast (USD Billion), by Rest of Middle East & Africa, 2018-2029 
      List of Tables
      Table 1: Global Digital Dentistry Resources Market Revenue (USD Billion) Forecast, by Segment 1, 2018-2029
      Table 2: Global Digital Dentistry Resources Market Revenue (USD Billion) Forecast, by Segment 2, 2018-2029
      Table 3: Global Digital Dentistry Resources Market Revenue (USD Billion) Forecast, by Segment 3, 2018-2029
      Table 4: Global Digital Dentistry Resources Market Revenue (USD Billion) Forecast, by Region, 2018-2029
      Table 5: North America Digital Dentistry Resources Market Revenue (USD Billion) Forecast, by Segment 1, 2018-2029
      Table 6: North America Digital Dentistry Resources Market Revenue (USD Billion) Forecast, by Segment 2, 2018-2029
      Table 7: North America Digital Dentistry Resources Market Revenue (USD Billion) Forecast, by Segment 3, 2018-2029
      Table 8: North America Digital Dentistry Resources Market Revenue (USD Billion) Forecast, by Country, 2018-2029
      Table 9: Europe Digital Dentistry Resources Market Revenue (USD Billion) Forecast, by Segment 1, 2018-2029
      Table 10: Europe Digital Dentistry Resources Market Revenue (USD Billion) Forecast, by Segment 2, 2018-2029
      Table 11: Europe Digital Dentistry Resources Market Revenue (USD Billion) Forecast, by Segment 3, 2018-2029
      Table 12: Europe Digital Dentistry Resources Market Revenue (USD Billion) Forecast, by Country, 2018-2029
      Table 13: Latin America Digital Dentistry Resources Market Revenue (USD Billion) Forecast, by Segment 1, 2018-2029
      Table 14: Latin America Digital Dentistry Resources Market Revenue (USD Billion) Forecast, by Segment 2, 2018-2029
      Table 15: Latin America Digital Dentistry Resources Market Revenue (USD Billion) Forecast, by Segment 3, 2018-2029
      Table 16: Latin America Digital Dentistry Resources Market Revenue (USD Billion) Forecast, by Country, 2018-2029
      Table 17: Asia Pacific Digital Dentistry Resources Market Revenue (USD Billion) Forecast, by Segment 1, 2018-2029
      Table 18: Asia Pacific Digital Dentistry Resources Market Revenue (USD Billion) Forecast, by Segment 2, 2018-2029
      Table 19: Asia Pacific Digital Dentistry Resources Market Revenue (USD Billion) Forecast, by Segment 3, 2018-2029
      Table 20: Asia Pacific Digital Dentistry Resources Market Revenue (USD Billion) Forecast, by Country, 2018-2029
      Table 21: Middle East & Africa Digital Dentistry Resources Market Revenue (USD Billion) Forecast, by Segment 1, 2018-2029
      Table 22: Middle East & Africa Digital Dentistry Resources Market Revenue (USD Billion) Forecast, by Segment 2, 2018-2029
      Table 23: Middle East & Africa Digital Dentistry Resources Market Revenue (USD Billion) Forecast, by Segment 3, 2018-2029
      Table 24: Middle East & Africa Digital Dentistry Resources Market Revenue (USD Billion) Forecast, by Country, 2018-2029
      Research Process

      Data Library Research are conducted by industry experts who offer insight on industry structure, market segmentations technology assessment and competitive landscape (CL), and penetration, as well as on emerging trends. Their analysis is based on primary interviews (~ 80%) and secondary research (~ 20%) as well as years of professional expertise in their respective industries. Adding to this, by analysing historical trends and current market positions, our analysts predict where the market will be headed for the next five years. Furthermore, the varying trends of segment & categories geographically presented are also studied and the estimated based on the primary & secondary research.

      In this particular report from the supply side Data Library Research has conducted primary surveys (interviews) with the key level executives (VP, CEO’s, Marketing Director, Business Development Manager and SOFT) of the companies that active & prominent as well as the midsized organization

      FIGURE 1: DLR RESEARH PROCESS

      research-methodology1

      Primary Research

      Extensive primary research was conducted to gain a deeper insight of the market and industry performance. The analysis is based on both primary and secondary research as well as years of professional expertise in the respective industries.

      In addition to analysing current and historical trends, our analysts predict where the market is headed over the next five years.

      It varies by segment for these categories geographically presented in the list of market tables. Speaking about this particular report we have conducted primary surveys (interviews) with the key level executives (VP, CEO’s, Marketing Director, Business Development Manager and many more) of the major players active in the market.

      Secondary Research

      Secondary research was mainly used to collect and identify information useful for the extensive, technical, market-oriented, and Friend’s study of the Global Extra Neutral Alcohol. It was also used to obtain key information about major players, market classification and segmentation according to the industry trends, geographical markets, and developments related to the market and technology perspectives. For this study, analysts have gathered information from various credible sources, such as annual reports, sec filings, journals, white papers, SOFT presentations, and company web sites.

      Market Size Estimation

      Both, top-down and bottom-up approaches were used to estimate and validate the size of the Global market and to estimate the size of various other dependent submarkets in the overall Extra Neutral Alcohol. The key players in the market were identified through secondary research and their market contributions in the respective geographies were determined through primary and secondary research.

      Forecast Model

      research-methodology2

      Happy to Assist You

      If you have a question?

      info@datalibraryresearch.com

      IND : +91 955 279 0357

      Browse Related Reports