Get Complete Analysis Of The Report - Download Updated Free Sample PDF
This expansion is primarily fueled by the widespread adoption of OLED and LCD panels in consumer electronics, automotive displays, and industrial applications. The shift towards higher-resolution and flexible displays necessitates advanced DDICs, prompting foundries to invest in cutting-edge manufacturing processes. Additionally, the increasing integration of display technologies in emerging applications, such as wearables and smart home devices, further propels the demand for specialized DDIC foundry services.
The global Display Driver Integrated Circuit (DDIC) foundry market is experiencing several transformative trends that are shaping its future trajectory. A notable development is the increasing adoption of advanced display technologies, such as AMOLED and mini-LED, which demand more sophisticated and efficient DDICs. This shift is prompting foundries to enhance their capabilities to support these high-performance displays. For instance, in 2024, the demand for AMOLED mobile application drivers is expected to grow by 9% year-over-year, while capacity is projected to increase by 32% year-over-year, indicating a significant expansion in production to meet this demand.
Another emerging trend is the dominance of Taiwanese design houses in the large-sized LCD DDIC market, with their market share surpassing that of South Korean design houses in 2024. Additionally, mainland Chinese design houses have been gaining market share, reflecting a shift in the global competitive landscape.
The market is also witnessing a surge in demand for flexible and foldable displays, particularly in smartphones and wearable devices. This trend is driving the need for specialized DDICs that can support the unique requirements of these displays, including flexibility, durability, and compactness.
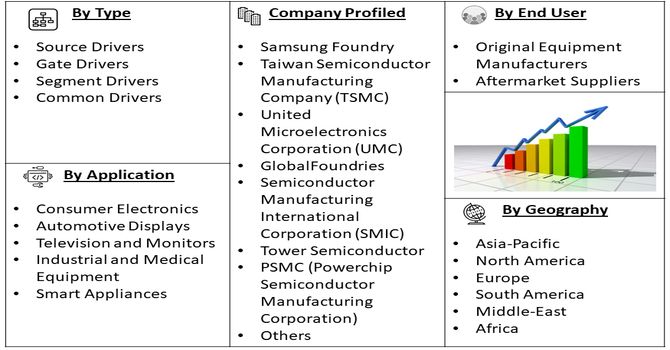
Segmentation: Global Display Driver Integrated Circuit Foundry Market is segmented By Display Technology (LCD, OLED, MicroLED, Mini-LED), By Driver Type (Source Drivers, Gate Drivers, Segment Drivers, Common Drivers), Application (Consumer Electronics, Automotive Displays, Television and Monitors, Industrial and Medical Equipment, Smart Appliances), End-User (Original Equipment Manufacturers, Aftermarket Suppliers), and Geography (North America, Europe, Asia-Pacific, Middle East and Africa, and South America). The report provides the value (in USD million) for the above segments.
For Detailed Market Segmentation - Get a Free Sample PDF
Market Drivers:
The rapid adoption of advanced display technologies, such as OLED, MicroLED, and Mini-LED, across various applications—including consumer electronics, automotive displays, and industrial equipment—is significantly driving the growth of the DDIC foundry market. These technologies require specialized driver ICs to manage their unique characteristics, leading to increased demand for advanced manufacturing processes and foundry services.
In April 2025, Vertiv, partnered with Maxcom, a prominent technology provider in the Maldives, to expand Micro Data Center and IT Systems solutions in the region. The collaboration centered on promoting and deploying Vertiv’s Smart Solutions portfolio, including global edge and modular data centers (MDC), offering power, cooling, and support to accelerate the growth of the local data center industry. This partnership supported the rapid expansion of data center infrastructure, which is essential for processing and delivering advanced display technologies. The enhanced data center capabilities fueled demand for high-performance display driver integrated circuits, thereby driving growth and innovation within the global foundry market for display driver ICs.
The continuous growth in the consumer electronics sector, particularly in smartphones, smart TVs, and wearable devices, is a major contributor to the rising demand for display driver ICs. Additionally, the automotive industry's shift towards digitalization, with the incorporation of advanced infotainment systems, digital dashboards, and heads-up displays, further fuels the need for specialized DDICs. This expansion necessitates increased production capacities and technological advancements in foundry services to meet the evolving requirements.
In October 2025, India’s Electronics Leap reported that electronics production had increased nearly six-fold from INR 1.9 lakh crore in 2014–15 to INR 11.3 lakh crore in 2024–25. Mobile phone exports surged 127 times, rising from INR 1,500 crore to INR 2 lakh crore during the same period, establishing India as the world’s second-largest mobile phone manufacturer. Additionally, electronics manufacturing had generated 25 lakh jobs over the past decade. This significant growth fuelled the expansion of the consumer electronics and automotive markets, driving higher demand for advanced display technologies and boosting the global display driver integrated circuit foundry market.
Market Restraints:
Establishing and maintaining advanced wafer foundry facilities necessitates substantial capital investment. The costs associated with state-of-the-art fabrication plants, clean rooms, and specialized equipment are significant, posing a barrier for new entrants and limiting the scalability of existing foundries. This financial burden can impede the expansion and technological advancement of DDIC manufacturing capabilities.
The DDIC market is characterized by intense price competition, especially in segments like mobile LCD TDDI, where products are priced close to cost. This pressure is exacerbated by weak market conditions in sectors such as handsets, leading to reduced profitability for manufacturers. Additionally, the demand for diverse product specifications across various display applications contributes to market fragmentation, making it challenging for foundries to achieve economies of scale and maintain consistent quality across different product lines.
The DDIC foundry market is the technological engine for the global visual experience, underpinning the entire consumer electronics industry. Its economic impact is colossal, as DDICs are crucial components in smartphones, TVs, automotive displays, and computing devices, fueling the growth of multinational tech giants and creating countless skilled manufacturing and design jobs, especially in Asia-Pacific. Socially, the proliferation of advanced DDICs facilitates access to high-resolution, vibrant, and energy-efficient displays, which are essential for digital education, remote work, telemedicine, and entertainment, thereby bridging the digital divide and enhancing global communication and information access.
Segmental Analysis:
Within driver types, source drivers play a pivotal role in controlling the voltage or current applied to each pixel column, directly impacting display performance and resolution. The demand for higher-resolution displays, particularly in OLED and Mini-LED panels, has driven the adoption of advanced source drivers. Foundries are investing in precision manufacturing and smaller process nodes to deliver high-performance, energy-efficient source drivers, which are essential for next-generation display applications.
OEMs remain the dominant end-user segment, accounting for the majority of DDIC demand. They rely on foundries to supply high-performance, custom, and large-volume ICs that meet stringent quality and performance standards. The growing complexity of displays in smartphones, TVs, and automotive systems has further strengthened the dependence of OEMs on specialized DDIC foundry services.
The North America region is projected to experience the highest growth in the Global Display Driver Integrated Circuit (DDIC) Foundry Market over the forecast period. This growth is driven by the increasing adoption of advanced display technologies in consumer electronics, automotive displays, and industrial applications. Rapid technological advancements, particularly in OLED, Mini-LED, and MicroLED displays, require high-performance DDICs, prompting foundries to expand capacity and upgrade manufacturing processes in the region.
Additionally, the strong presence of leading semiconductor companies, supportive government policies, and the rising demand for high-resolution and flexible displays contribute to North America’s prominent growth trajectory. For instance, in August 2025, Lightium AG, MPI Corporation, and Axiomatic_AI Inc. signed a Memorandum of Understanding (MoU) to jointly develop the world’s first Intelligent, Autonomous, and Integrated Test Solution (IAITS) for photonic devices. This strategic partnership aimed to transform the testing and qualification of photonic integrated circuit (PIC) devices by combining advanced artificial intelligence, next-generation hardware, and deep industry expertise. The IAITS platform promised to deliver exceptional efficiency, accuracy, and scalability in testing workflows to address the growing demands of the photonics sector. This collaboration accelerated innovation in testing solutions for photonic devices, which are integral to display technologies. By enhancing test precision and scalability, it supported faster development and higher-quality production of display driver ICs, driving growth and competitiveness in the global foundry market for display driver integrated circuits.
The expansion of automotive infotainment systems, digital dashboards, and smart devices further accelerates the need for specialized DDICs, positioning North America as a key growth hub for the market.
| Report Matrics | Details |
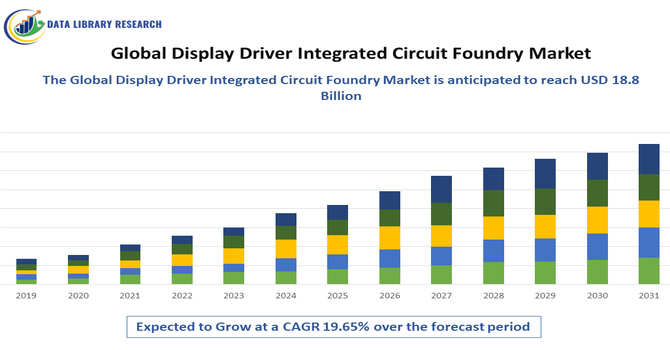
| Market Size Value | USD 18.8 billion |
| Growth Rate | CAGR of 19.65% |
| Forecast | 2026-2033 |
| Historical data | 2021-2024 |
| Base Year | 2025 |
| Report Coverage | Forecasted revenue, company rating, competitive environment, growth drivers, and trends |
| Segment Coverage | Type, Application, End-User, Geography |
| Regional Scope | North America, Europe, Asia Pacific, Middle East |
| Customized scope | Free customization of reports (With 3 months Analysis Support ) |
| To Learn More About This Report | Request a Free Sample Copy |
The global DDIC foundry market is characterized by intense competition among several key players who specialize in manufacturing and supplying display driver ICs for various applications, including consumer electronics, automotive displays, and industrial equipment. These companies are at the forefront of technological advancements, focusing on developing high-performance, energy-efficient, and cost-effective solutions to meet the growing demand for advanced display technologies such as OLED, MicroLED, and Mini-LED.
Key Players in the DDIC Foundry Market
Recent Development
Q1. What the main growth driving factors for this market?
The primary growth driver is the explosive demand for high-resolution, energy-efficient displays across consumer electronics, especially smartphones, smart TVs, and wearables. The relentless adoption of advanced display technologies like AMOLED/OLED and Mini-LED, which require more sophisticated and specialized DDICs, significantly fuels the foundry market. Furthermore, the proliferation of large, high-performance displays in emerging sectors like the automotive industry (infotainment, digital cockpits) and AR/VR devices creates a sustained high-volume demand for foundry services to manufacture these specialized chips.
Q2. What are the main restraining factors for this market?
The market faces constraints from high capital investment required for advanced process nodes (e.g., 28nm and below) necessary for high-performance DDICs, posing a significant barrier to entry. Intense competition among existing foundries and the associated pressure on profit margins also acts as a restraint. Furthermore, geopolitical uncertainties and potential supply chain disruptions, particularly concerning the concentration of manufacturing capacity in Asia-Pacific, can impact production stability and overall market growth.
Q3. Which segment is expected to witness high growth?
The AMOLED/OLED DDIC segment is expected to witness the highest growth. This is driven by the rapid adoption of OLED technology in premium smartphones, high-end TVs, and smartwatches due to its superior contrast, color, and thinner form factor. From an application perspective, the Automotive Displays segment is also showing a substantial growth trajectory as vehicles increasingly integrate large, high-resolution screens for infotainment and safety systems, demanding AEC-Q100 qualified, specialized DDICs.
Q4. Who are the top major players for this market?
The top major players in the DDIC Foundry market include key semiconductor contract manufacturers and integrated device manufacturers (IDMs). Prominent names are Samsung Electronics (with its foundry arm, particularly strong in AMOLED DDIC), TSMC (Taiwan Semiconductor Manufacturing Company), UMC (United Microelectronics Corporation), and the emerging Chinese foundry, NexChip. Key fabless DDIC design houses that are major customers include Novatek Microelectronics and Himax Technologies.
Q5. Which country is the largest player?
China is identified as the largest player in terms of both demand and future supply capacity for the global Display Driver IC market. It commands a significant share of the total market revenue, driven by its massive consumer electronics manufacturing ecosystem and substantial government investment in panel and semiconductor production. Closely following are South Korea (with Samsung) and Taiwan (with TSMC and UMC), which collectively dominate the advanced manufacturing nodes for DDICs.
Data Library Research are conducted by industry experts who offer insight on industry structure, market segmentations technology assessment and competitive landscape (CL), and penetration, as well as on emerging trends. Their analysis is based on primary interviews (~ 80%) and secondary research (~ 20%) as well as years of professional expertise in their respective industries. Adding to this, by analysing historical trends and current market positions, our analysts predict where the market will be headed for the next five years. Furthermore, the varying trends of segment & categories geographically presented are also studied and the estimated based on the primary & secondary research.
In this particular report from the supply side Data Library Research has conducted primary surveys (interviews) with the key level executives (VP, CEO’s, Marketing Director, Business Development Manager and SOFT) of the companies that active & prominent as well as the midsized organization
FIGURE 1: DLR RESEARH PROCESS
Extensive primary research was conducted to gain a deeper insight of the market and industry performance. The analysis is based on both primary and secondary research as well as years of professional expertise in the respective industries.
In addition to analysing current and historical trends, our analysts predict where the market is headed over the next five years.
It varies by segment for these categories geographically presented in the list of market tables. Speaking about this particular report we have conducted primary surveys (interviews) with the key level executives (VP, CEO’s, Marketing Director, Business Development Manager and many more) of the major players active in the market.
Secondary ResearchSecondary research was mainly used to collect and identify information useful for the extensive, technical, market-oriented, and Friend’s study of the Global Extra Neutral Alcohol. It was also used to obtain key information about major players, market classification and segmentation according to the industry trends, geographical markets, and developments related to the market and technology perspectives. For this study, analysts have gathered information from various credible sources, such as annual reports, sec filings, journals, white papers, SOFT presentations, and company web sites.
Market Size EstimationBoth, top-down and bottom-up approaches were used to estimate and validate the size of the Global market and to estimate the size of various other dependent submarkets in the overall Extra Neutral Alcohol. The key players in the market were identified through secondary research and their market contributions in the respective geographies were determined through primary and secondary research.
Forecast Model