Driver Fatigue and Distraction Monitoring System Market Overview and Analysis
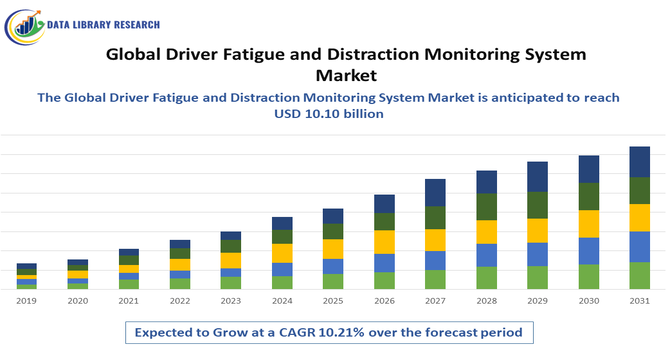
- The Global Driver Fatigue and Distraction Monitoring Systems Market size was estimated at USD 4.22 billion in 2025 and is projected to reach USD 10.10 billion by 2032, growing with a CAGR of 10.21% from 2025-2034.
Get Complete Analysis Of The Report - Download Updated Free Sample PDF
The Global Driver Fatigue and Distraction Monitoring Systems Market is witnessing strong growth driven by increasing emphasis on road safety, stringent government regulations mandating advanced driver-assistance systems (ADAS), and rising adoption of driver monitoring technologies across automotive and commercial fleets. The growing incidence of road accidents caused by drowsiness, impaired attention, and distracted driving is boosting demand for intelligent in-cabin sensing solutions. Automotive OEMs are integrating AI-powered eye-tracking, head-movement analysis, and behavioral monitoring systems to comply with evolving safety standards and enhance passenger protection.
Driver Fatigue and Distraction Monitoring System Market Latest Trends
The Global Driver Fatigue and Distraction Monitoring Systems Market is witnessing rapid advancements driven by the integration of artificial intelligence, machine learning, and computer vision-based sensing to enhance real-time recognition of drowsiness and distracted driving behaviors. Automotive OEMs are shifting from basic eyelid-closure and head-nod detection toward comprehensive in-cabin human-monitoring systems that analyze eye movement, facial expressions, head position, and even heart-rate patterns for deeper behavioral insights. Increasing regulatory mandates, especially across Europe and North America, are accelerating embedded DMS installation in new vehicles, while commercial logistics fleets are adopting driver-monitoring platforms to improve safety, reduce insurance costs, and optimize fleet performance.
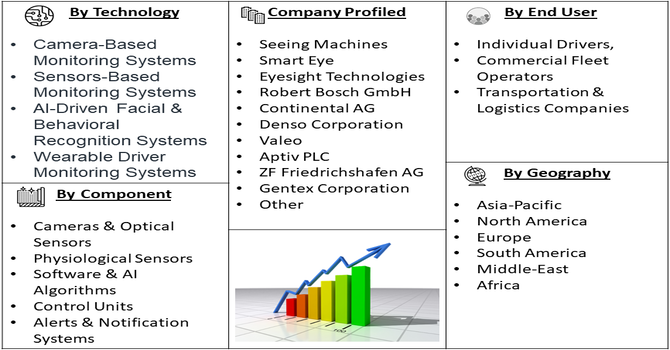
Segmentation: Global Driver Fatigue and Distraction Monitoring Systems Market is segmented By Type (Fatigue Monitoring Systems, Distraction Monitoring Systems, Combined Fatigue & Distraction Monitoring Systems), Technology (Camera-Based Monitoring Systems, Sensors-Based Monitoring Systems, AI-Driven Facial & Behavioral Recognition Systems, Wearable Driver Monitoring Systems), Component (Cameras & Optical Sensors, Physiological Sensors, Software & AI Algorithms, Control Units, Alerts & Notification Systems), End-User (Individual Drivers, Commercial Fleet Operators, Transportation & Logistics Companies), and Geography (North America, Europe, Asia-Pacific, Middle East and Africa, and South America). The report provides the value (in USD million) for the above segments.
For Detailed Market Segmentation - Get a Free Sample PDF
Market Drivers:
- Rising Road Accidents Due to Driver Fatigue & Distraction
A major market driver is the increasing incidence of road accidents linked to fatigue, drowsiness, and distracted driving. With growing use of in-vehicle infotainment systems and mobile devices, driver inattention has become a significant safety concern globally. Government bodies, insurance companies, and fleet operators are prioritizing advanced monitoring technologies to reduce collision risks and improve passenger safety.
In 2024, Teletrac Navman, a Vontier company, enhanced its IQ Camera AI-powered dashcam with driver distraction, cell phone usage, and drowsiness detection features. This upgrade improves fleet safety, supports proactive risk management, and is expected to drive growth in the Global Driver Fatigue and Distraction Monitoring System Market. These systems help detect micro-sleep, lack of focus, and cognitive distraction in real time, thereby preventing accidents and saving lives. As awareness of human-error-related crashes rises, demand for driver fatigue and distraction monitoring solutions continues to accelerate.
- Government Safety Regulations and ADAS Mandates
Stringent safety policies and regulatory frameworks mandating driver monitoring systems in new vehicles are fueling market growth. Regions such as Europe and North America have introduced mandatory safety standards requiring fatigue-monitoring and distraction-alert systems in commercial fleets and passenger cars as part of ADAS compliance. Similar initiatives are emerging across Asia-Pacific to enhance road safety and align with global transportation standards. As automakers aim to meet regulatory expectations and qualify for safety ratings, adoption of in-cabin monitoring technology is rapidly increasing across OEM vehicle models, driving strong market demand.
Market Restraints
- High Implementation Costs and Integration Complexity
The Global Driver Fatigue and Distraction Monitoring Systems Market faces key restraints, primarily related to high implementation costs and integration complexity, especially for advanced AI-powered camera and sensor-based systems. Many automakers and fleet operators in developing markets are hesitant to adopt these solutions due to expensive in-cabin hardware, calibration needs, and additional software processing requirements. Privacy concerns also pose a significant challenge, as continuous monitoring of driver behavior and facial expressions raises data protection and surveillance issues, leading to resistance from end-users and stricter regulatory scrutiny. Moreover, system accuracy can be affected by varying lighting conditions, skin tones, facial hair, eyewear, and driver posture, which may lead to false alerts and reduced driver trust.
Socio Economic Impact on Driver Fatigue and Distraction Monitoring System Market
The Global Driver Fatigue and Distraction Monitoring System Market has significant socioeconomic implications. By reducing accidents caused by drowsy or inattentive driving, these systems enhance road safety, lowering fatalities and healthcare costs associated with traffic collisions. Improved driver monitoring increases productivity in commercial fleets, minimizes vehicle downtime, and reduces insurance claims, contributing to economic efficiency. Widespread adoption also fosters technological innovation in AI, computer vision, and telematics, creating high-skilled employment opportunities and supporting infrastructure development. Socially, enhanced monitoring promotes safer commuting for both professional drivers and the general public, reducing emotional and financial burdens on families affected by accidents.
Segmental Analysis
- Combined Fatigue & Distraction Monitoring Systems segment is expected to witness highest growth over the forecast period
The combined fatigue and distraction monitoring systems segment is expected to dominate as automakers shift from single-purpose systems toward integrated platforms that monitor multiple behavioral parameters simultaneously. These systems use advanced vision sensors and AI models to detect drowsiness indicators like eyelid closure and yawning while also identifying distraction cues such as gaze deviation and mobile device usage. Their ability to provide comprehensive safety insights and comply with evolving global safety regulations makes them increasingly preferred in new-generation vehicles.
- Software & AI Algorithms segment is expected to witness highest growth over the forecast period
Software and AI algorithms represent the fastest-growing component segment as real-time data interpretation, behavioral prediction, and deep-learning-based pattern recognition become crucial to system performance. AI algorithms enhance accuracy by learning unique driver patterns and minimizing false alerts. With continuous advancements in cognitive vision models and cloud-connected driver analytics, software is emerging as the core value-driver in driver monitoring ecosystems.
- Commercial Fleet Operators segment is expected to witness highest growth over the forecast period
Commercial fleet operators form a prominent end-user segment due to rising adoption across logistics, trucking, mining, and public transportation fleets. Fleet managers rely on DMS to reduce accident rates, improve driver safety, and lower insurance premiums.
Real-time monitoring, telematics integration, and remote alert systems help companies enforce safe driving behavior and optimize driver scheduling to mitigate fatigue-related risks, accelerating commercial fleet adoption globally. For instance, June 2025, The Tamil Nadu government announced plans to enhance passenger safety and operational efficiency by equipping 4,000 buses with 360-degree surveillance camera systems, valued at Rs 15 crore. Additionally, a Rs 2 crore pilot project will introduce AI-based Driver Monitoring Systems (DMS) in 500 buses. This large-scale initiative is expected to drive significant growth in the Driver Fatigue and Distraction Monitoring System Market by accelerating adoption of advanced monitoring technologies in public transportation. It reflects rising government focus on road safety and operational oversight, which will boost demand for AI-powered safety solutions, fostering innovation and market expansion across India and similar regions.
- North America region is expected to witness highest growth over the forecast period
North America leads the market owing to strong regulatory frameworks, high automotive safety awareness, and rapid adoption of advanced driver-assistance technologies.
The U.S. is a key growth driver due to federal and state-level road-safety initiatives and growing implementation of fatigue and distraction monitoring in commercial fleets. For instance, in September 2025, Seeing Machines introduced an advanced capability for its Driver Monitoring System (DMS), enabling detection of non-drowsy driver impairments, including alcohol-related impairment. This innovation enhances road safety across North America by addressing a critical factor in traffic accidents—impaired driving beyond fatigue. By providing real-time alerts and intervention possibilities, the technology helps reduce collisions, injuries, and fatalities, benefiting both public safety and commercial fleet operations. Its deployment supports insurance cost reductions, compliance with regulatory standards, and operational efficiency for transportation companies. The advancement strengthens the North American Driver Fatigue and Distraction Monitoring System market, driving adoption of AI-powered safety solutions across automotive and fleet sectors.
Expansion of connected trucking networks, insurance incentives for fleet safety, and early adoption by luxury and EV manufacturers further support regional market leadership.
| Report Matrics |
Details |
| Market Size Value |
USD 10.10billion |
| Growth Rate |
CAGR of 10.21% |
| Forecast |
2026-2033 |
| Historical data |
2021-2024 |
| Base Year |
2025 |
| Report Coverage |
Forecasted revenue, company rating, competitive environment, growth drivers, and trends |
| Segment Coverage |
Type, Application, End-User, Geography |
| Regional Scope |
North America, Europe, Asia Pacific, Middle East |
| Customized scope |
Free customization of reports (With 3 months Analysis Support ) |
| To Learn More About This Report |
Request a Free Sample Copy |
Driver Fatigue and Distraction Monitoring System Market Competitive Landscape:
The market is led by a mix of automotive Tier-1s, semiconductor/platform providers, specialist DMS vendors and telematics/video-safety firms competing on detection accuracy, AI models, sensor fusion, and OEM partnerships.
- Seeing Machines
- Smart Eye
- Eyesight Technologies
- Robert Bosch GmbH
- Continental AG
- Denso Corporation
- Valeo
- Aptiv PLC
- ZF Friedrichshafen AG
- Gentex Corporation
- Mobileye (Intel)
- NXP Semiconductors
- Qualcomm Technologies
- Autoliv Inc.
- Veoneer Inc.
- HELLA GmbH & Co. KGaA
- Panasonic Automotive Systems
- Hyundai Mobis
- Nauto SmartDrive Systems
Recent Development
- In September 2025, Volvo upgraded its Driver Alert Support system with dual cameras, including a new eye-tracking camera, to detect drowsiness and inattention, alerting drivers via visual and audio signals. This innovation enhanced road safety and is expected to drive growth in the Global Driver Fatigue and Distraction Monitoring System Market.
- In June 2025, Roadzen Inc. secured an Indian patent for its DrivebuddyAI platform, featuring an AI-driven system that monitors 92+ real-time eye and facial cues to detect driver drowsiness and issue instant alerts. This advancement enhances road safety and is poised to boost adoption in the Global Driver Fatigue and Distraction Monitoring System Market.
Frequently Asked Questions (FAQ) :
Q1. What are the main growth driving factors for this market?
The market is primarily driven by strict government regulations worldwide, especially in commercial vehicle fleets, mandating safety features to reduce accidents caused by fatigue and distraction. The increasing integration of these systems as a core component of Advanced Driver-Assistance Systems (ADAS) in passenger vehicles is crucial. Furthermore, advancements in AI and machine learning are creating highly accurate, real-time monitoring solutions that accelerate adoption.
Q2. What are the main restraining factors for this market?
Major obstacles include the high implementation cost of sophisticated camera- and sensor-based systems, which raises the final vehicle price. Significant data privacy concerns regarding the collection and use of in-cabin driver data must be addressed with complex security measures. Additionally, the challenge of maintaining consistent system accuracy across diverse real-world driving conditions (like lighting or driver accessories) can diminish user trust.
Q3. Which segment is expected to witness high growth?
The Commercial Vehicles/Fleet Management segment is expected to witness high growth. This is due to stringent government mandates for monitoring heavy trucks and buses, coupled with fleet operators' intense focus on reducing high insurance costs, preventing accidents, and improving driver accountability for operational efficiency. By technology, Camera-Based Systems utilizing AI for precise facial and eye-gaze tracking also lead in growth.
Q4. Who are the top major players for this market?
The market is dominated by global automotive and technology suppliers. Key players include major automotive component manufacturers like Continental AG, Robert Bosch GmbH, and Valeo S.A. Dedicated technology specialists like Seeing Machines Limited and Smart Eye AB are also prominent. Their leadership is built on integrating advanced AI and sensor fusion into vehicles for accurate, real-time driver state detection.
Q5. Which country is the largest player?
The North American region, especially the United States, is typically cited as the largest market player by revenue share. This is attributed to stringent safety regulations, high technological adoption rates, and significant research and development investment in advanced automotive safety systems. However, the Asia Pacific region is poised to be the fastest-growing market due to escalating vehicle production and rapidly improving safety standards.
List of Figures
Figure 1: Global Driver Fatigue and Distraction Monitoring System Market Revenue Breakdown (USD Billion, %) by Region, 2022 & 2029
Figure 2: Global Driver Fatigue and Distraction Monitoring System Market Value Share (%), By Segment 1, 2022 & 2029
Figure 3: Global Driver Fatigue and Distraction Monitoring System Market Forecast (USD Billion), by Sub-Segment 1, 2018-2029
Figure 4: Global Driver Fatigue and Distraction Monitoring System Market Forecast (USD Billion), by Sub-Segment 2, 2018-2029
Figure 5: Global Driver Fatigue and Distraction Monitoring System Market Value Share (%), By Segment 2, 2022 & 2029
Figure 6: Global Driver Fatigue and Distraction Monitoring System Market Forecast (USD Billion), by Sub-Segment 1, 2018-2029
Figure 7: Global Driver Fatigue and Distraction Monitoring System Market Forecast (USD Billion), by Sub-Segment 2, 2018-2029
Figure 8: Global Driver Fatigue and Distraction Monitoring System Market Forecast (USD Billion), by Sub-Segment 3, 2018-2029
Figure 9: Global Driver Fatigue and Distraction Monitoring System Market Forecast (USD Billion), by Others, 2018-2029
Figure 10: Global Driver Fatigue and Distraction Monitoring System Market Value Share (%), By Segment 3, 2022 & 2029
Figure 11: Global Driver Fatigue and Distraction Monitoring System Market Forecast (USD Billion), by Sub-Segment 1, 2018-2029
Figure 12: Global Driver Fatigue and Distraction Monitoring System Market Forecast (USD Billion), by Sub-Segment 2, 2018-2029
Figure 13: Global Driver Fatigue and Distraction Monitoring System Market Forecast (USD Billion), by Sub-Segment 3, 2018-2029
Figure 14: Global Driver Fatigue and Distraction Monitoring System Market Forecast (USD Billion), by Others, 2018-2029
Figure 15: Global Driver Fatigue and Distraction Monitoring System Market Value (USD Billion), by Region, 2022 & 2029
Figure 16: North America Driver Fatigue and Distraction Monitoring System Market Value Share (%), By Segment 1, 2022 & 2029
Figure 17: North America Driver Fatigue and Distraction Monitoring System Market Forecast (USD Billion), by Sub-Segment 1, 2018-2029
Figure 18: North America Driver Fatigue and Distraction Monitoring System Market Forecast (USD Billion), by Sub-Segment 2, 2018-2029
Figure 19: North America Driver Fatigue and Distraction Monitoring System Market Value Share (%), By Segment 2, 2022 & 2029
Figure 20: North America Driver Fatigue and Distraction Monitoring System Market Forecast (USD Billion), by Sub-Segment 1, 2018-2029
Figure 21: North America Driver Fatigue and Distraction Monitoring System Market Forecast (USD Billion), by Sub-Segment 2, 2018-2029
Figure 22: North America Driver Fatigue and Distraction Monitoring System Market Forecast (USD Billion), by Sub-Segment 3, 2018-2029
Figure 23: North America Driver Fatigue and Distraction Monitoring System Market Forecast (USD Billion), by Others, 2018-2029
Figure 24: North America Driver Fatigue and Distraction Monitoring System Market Value Share (%), By Segment 3, 2022 & 2029
Figure 25: North America Driver Fatigue and Distraction Monitoring System Market Forecast (USD Billion), by Sub-Segment 1, 2018-2029
Figure 26: North America Driver Fatigue and Distraction Monitoring System Market Forecast (USD Billion), by Sub-Segment 2, 2018-2029
Figure 27: North America Driver Fatigue and Distraction Monitoring System Market Forecast (USD Billion), by Sub-Segment 3, 2018-2029
Figure 28: North America Driver Fatigue and Distraction Monitoring System Market Forecast (USD Billion), by Others, 2018-2029
Figure 29: North America Driver Fatigue and Distraction Monitoring System Market Forecast (USD Billion), by U.S., 2018-2029
Figure 30: North America Driver Fatigue and Distraction Monitoring System Market Forecast (USD Billion), by Canada, 2018-2029
Figure 31: Latin America Driver Fatigue and Distraction Monitoring System Market Value Share (%), By Segment 1, 2022 & 2029
Figure 32: Latin America Driver Fatigue and Distraction Monitoring System Market Forecast (USD Billion), by Sub-Segment 1, 2018-2029
Figure 33: Latin America Driver Fatigue and Distraction Monitoring System Market Forecast (USD Billion), by Sub-Segment 2, 2018-2029
Figure 34: Latin America Driver Fatigue and Distraction Monitoring System Market Value Share (%), By Segment 2, 2022 & 2029
Figure 35: Latin America Driver Fatigue and Distraction Monitoring System Market Forecast (USD Billion), by Sub-Segment 1, 2018-2029
Figure 36: Latin America Driver Fatigue and Distraction Monitoring System Market Forecast (USD Billion), by Sub-Segment 2, 2018-2029
Figure 37: Latin America Driver Fatigue and Distraction Monitoring System Market Forecast (USD Billion), by Sub-Segment 3, 2018-2029
Figure 38: Latin America Driver Fatigue and Distraction Monitoring System Market Forecast (USD Billion), by Others, 2018-2029
Figure 39: Latin America Driver Fatigue and Distraction Monitoring System Market Value Share (%), By Segment 3, 2022 & 2029
Figure 40: Latin America Driver Fatigue and Distraction Monitoring System Market Forecast (USD Billion), by Sub-Segment 1, 2018-2029
Figure 41: Latin America Driver Fatigue and Distraction Monitoring System Market Forecast (USD Billion), by Sub-Segment 2, 2018-2029
Figure 42: Latin America Driver Fatigue and Distraction Monitoring System Market Forecast (USD Billion), by Sub-Segment 3, 2018-2029
Figure 43: Latin America Driver Fatigue and Distraction Monitoring System Market Forecast (USD Billion), by Others, 2018-2029
Figure 44: Latin America Driver Fatigue and Distraction Monitoring System Market Forecast (USD Billion), by Brazil, 2018-2029
Figure 45: Latin America Driver Fatigue and Distraction Monitoring System Market Forecast (USD Billion), by Mexico, 2018-2029
Figure 46: Latin America Driver Fatigue and Distraction Monitoring System Market Forecast (USD Billion), by Rest of Latin America, 2018-2029
Figure 47: Europe Driver Fatigue and Distraction Monitoring System Market Value Share (%), By Segment 1, 2022 & 2029
Figure 48: Europe Driver Fatigue and Distraction Monitoring System Market Forecast (USD Billion), by Sub-Segment 1, 2018-2029
Figure 49: Europe Driver Fatigue and Distraction Monitoring System Market Forecast (USD Billion), by Sub-Segment 2, 2018-2029
Figure 50: Europe Driver Fatigue and Distraction Monitoring System Market Value Share (%), By Segment 2, 2022 & 2029
Figure 51: Europe Driver Fatigue and Distraction Monitoring System Market Forecast (USD Billion), by Sub-Segment 1, 2018-2029
Figure 52: Europe Driver Fatigue and Distraction Monitoring System Market Forecast (USD Billion), by Sub-Segment 2, 2018-2029
Figure 53: Europe Driver Fatigue and Distraction Monitoring System Market Forecast (USD Billion), by Sub-Segment 3, 2018-2029
Figure 54: Europe Driver Fatigue and Distraction Monitoring System Market Forecast (USD Billion), by Others, 2018-2029
Figure 55: Europe Driver Fatigue and Distraction Monitoring System Market Value Share (%), By Segment 3, 2022 & 2029
Figure 56: Europe Driver Fatigue and Distraction Monitoring System Market Forecast (USD Billion), by Sub-Segment 1, 2018-2029
Figure 57: Europe Driver Fatigue and Distraction Monitoring System Market Forecast (USD Billion), by Sub-Segment 2, 2018-2029
Figure 58: Europe Driver Fatigue and Distraction Monitoring System Market Forecast (USD Billion), by Sub-Segment 3, 2018-2029
Figure 59: Europe Driver Fatigue and Distraction Monitoring System Market Forecast (USD Billion), by Others, 2018-2029
Figure 60: Europe Driver Fatigue and Distraction Monitoring System Market Forecast (USD Billion), by U.K., 2018-2029
Figure 61: Europe Driver Fatigue and Distraction Monitoring System Market Forecast (USD Billion), by Germany, 2018-2029
Figure 62: Europe Driver Fatigue and Distraction Monitoring System Market Forecast (USD Billion), by France, 2018-2029
Figure 63: Europe Driver Fatigue and Distraction Monitoring System Market Forecast (USD Billion), by Italy, 2018-2029
Figure 64: Europe Driver Fatigue and Distraction Monitoring System Market Forecast (USD Billion), by Spain, 2018-2029
Figure 65: Europe Driver Fatigue and Distraction Monitoring System Market Forecast (USD Billion), by Russia, 2018-2029
Figure 66: Europe Driver Fatigue and Distraction Monitoring System Market Forecast (USD Billion), by Rest of Europe, 2018-2029
Figure 67: Asia Pacific Driver Fatigue and Distraction Monitoring System Market Value Share (%), By Segment 1, 2022 & 2029
Figure 68: Asia Pacific Driver Fatigue and Distraction Monitoring System Market Forecast (USD Billion), by Sub-Segment 1, 2018-2029
Figure 69: Asia Pacific Driver Fatigue and Distraction Monitoring System Market Forecast (USD Billion), by Sub-Segment 2, 2018-2029
Figure 70: Asia Pacific Driver Fatigue and Distraction Monitoring System Market Value Share (%), By Segment 2, 2022 & 2029
Figure 71: Asia Pacific Driver Fatigue and Distraction Monitoring System Market Forecast (USD Billion), by Sub-Segment 1, 2018-2029
Figure 72: Asia Pacific Driver Fatigue and Distraction Monitoring System Market Forecast (USD Billion), by Sub-Segment 2, 2018-2029
Figure 73: Asia Pacific Driver Fatigue and Distraction Monitoring System Market Forecast (USD Billion), by Sub-Segment 3, 2018-2029
Figure 74: Asia Pacific Driver Fatigue and Distraction Monitoring System Market Forecast (USD Billion), by Others, 2018-2029
Figure 75: Asia Pacific Driver Fatigue and Distraction Monitoring System Market Value Share (%), By Segment 3, 2022 & 2029
Figure 76: Asia Pacific Driver Fatigue and Distraction Monitoring System Market Forecast (USD Billion), by Sub-Segment 1, 2018-2029
Figure 77: Asia Pacific Driver Fatigue and Distraction Monitoring System Market Forecast (USD Billion), by Sub-Segment 2, 2018-2029
Figure 78: Asia Pacific Driver Fatigue and Distraction Monitoring System Market Forecast (USD Billion), by Sub-Segment 3, 2018-2029
Figure 79: Asia Pacific Driver Fatigue and Distraction Monitoring System Market Forecast (USD Billion), by Others, 2018-2029
Figure 80: Asia Pacific Driver Fatigue and Distraction Monitoring System Market Forecast (USD Billion), by China, 2018-2029
Figure 81: Asia Pacific Driver Fatigue and Distraction Monitoring System Market Forecast (USD Billion), by India, 2018-2029
Figure 82: Asia Pacific Driver Fatigue and Distraction Monitoring System Market Forecast (USD Billion), by Japan, 2018-2029
Figure 83: Asia Pacific Driver Fatigue and Distraction Monitoring System Market Forecast (USD Billion), by Australia, 2018-2029
Figure 84: Asia Pacific Driver Fatigue and Distraction Monitoring System Market Forecast (USD Billion), by Southeast Asia, 2018-2029
Figure 85: Asia Pacific Driver Fatigue and Distraction Monitoring System Market Forecast (USD Billion), by Rest of Asia Pacific, 2018-2029
Figure 86: Middle East & Africa Driver Fatigue and Distraction Monitoring System Market Value Share (%), By Segment 1, 2022 & 2029
Figure 87: Middle East & Africa Driver Fatigue and Distraction Monitoring System Market Forecast (USD Billion), by Sub-Segment 1, 2018-2029
Figure 88: Middle East & Africa Driver Fatigue and Distraction Monitoring System Market Forecast (USD Billion), by Sub-Segment 2, 2018-2029
Figure 89: Middle East & Africa Driver Fatigue and Distraction Monitoring System Market Value Share (%), By Segment 2, 2022 & 2029
Figure 90: Middle East & Africa Driver Fatigue and Distraction Monitoring System Market Forecast (USD Billion), by Sub-Segment 1, 2018-2029
Figure 91: Middle East & Africa Driver Fatigue and Distraction Monitoring System Market Forecast (USD Billion), by Sub-Segment 2, 2018-2029
Figure 92: Middle East & Africa Driver Fatigue and Distraction Monitoring System Market Forecast (USD Billion), by Sub-Segment 3, 2018-2029
Figure 93: Middle East & Africa Driver Fatigue and Distraction Monitoring System Market Forecast (USD Billion), by Others, 2018-2029
Figure 94: Middle East & Africa Driver Fatigue and Distraction Monitoring System Market Value Share (%), By Segment 3, 2022 & 2029
Figure 95: Middle East & Africa Driver Fatigue and Distraction Monitoring System Market Forecast (USD Billion), by Sub-Segment 1, 2018-2029
Figure 96: Middle East & Africa Driver Fatigue and Distraction Monitoring System Market Forecast (USD Billion), by Sub-Segment 2, 2018-2029
Figure 97: Middle East & Africa Driver Fatigue and Distraction Monitoring System Market Forecast (USD Billion), by Sub-Segment 3, 2018-2029
Figure 98: Middle East & Africa Driver Fatigue and Distraction Monitoring System Market Forecast (USD Billion), by Others, 2018-2029
Figure 99: Middle East & Africa Driver Fatigue and Distraction Monitoring System Market Forecast (USD Billion), by GCC, 2018-2029
Figure 100: Middle East & Africa Driver Fatigue and Distraction Monitoring System Market Forecast (USD Billion), by South Africa, 2018-2029
Figure 101: Middle East & Africa Driver Fatigue and Distraction Monitoring System Market Forecast (USD Billion), by Rest of Middle East & Africa, 2018-2029
List of Tables
Table 1: Global Driver Fatigue and Distraction Monitoring System Market Revenue (USD Billion) Forecast, by Segment 1, 2018-2029
Table 2: Global Driver Fatigue and Distraction Monitoring System Market Revenue (USD Billion) Forecast, by Segment 2, 2018-2029
Table 3: Global Driver Fatigue and Distraction Monitoring System Market Revenue (USD Billion) Forecast, by Segment 3, 2018-2029
Table 4: Global Driver Fatigue and Distraction Monitoring System Market Revenue (USD Billion) Forecast, by Region, 2018-2029
Table 5: North America Driver Fatigue and Distraction Monitoring System Market Revenue (USD Billion) Forecast, by Segment 1, 2018-2029
Table 6: North America Driver Fatigue and Distraction Monitoring System Market Revenue (USD Billion) Forecast, by Segment 2, 2018-2029
Table 7: North America Driver Fatigue and Distraction Monitoring System Market Revenue (USD Billion) Forecast, by Segment 3, 2018-2029
Table 8: North America Driver Fatigue and Distraction Monitoring System Market Revenue (USD Billion) Forecast, by Country, 2018-2029
Table 9: Europe Driver Fatigue and Distraction Monitoring System Market Revenue (USD Billion) Forecast, by Segment 1, 2018-2029
Table 10: Europe Driver Fatigue and Distraction Monitoring System Market Revenue (USD Billion) Forecast, by Segment 2, 2018-2029
Table 11: Europe Driver Fatigue and Distraction Monitoring System Market Revenue (USD Billion) Forecast, by Segment 3, 2018-2029
Table 12: Europe Driver Fatigue and Distraction Monitoring System Market Revenue (USD Billion) Forecast, by Country, 2018-2029
Table 13: Latin America Driver Fatigue and Distraction Monitoring System Market Revenue (USD Billion) Forecast, by Segment 1, 2018-2029
Table 14: Latin America Driver Fatigue and Distraction Monitoring System Market Revenue (USD Billion) Forecast, by Segment 2, 2018-2029
Table 15: Latin America Driver Fatigue and Distraction Monitoring System Market Revenue (USD Billion) Forecast, by Segment 3, 2018-2029
Table 16: Latin America Driver Fatigue and Distraction Monitoring System Market Revenue (USD Billion) Forecast, by Country, 2018-2029
Table 17: Asia Pacific Driver Fatigue and Distraction Monitoring System Market Revenue (USD Billion) Forecast, by Segment 1, 2018-2029
Table 18: Asia Pacific Driver Fatigue and Distraction Monitoring System Market Revenue (USD Billion) Forecast, by Segment 2, 2018-2029
Table 19: Asia Pacific Driver Fatigue and Distraction Monitoring System Market Revenue (USD Billion) Forecast, by Segment 3, 2018-2029
Table 20: Asia Pacific Driver Fatigue and Distraction Monitoring System Market Revenue (USD Billion) Forecast, by Country, 2018-2029
Table 21: Middle East & Africa Driver Fatigue and Distraction Monitoring System Market Revenue (USD Billion) Forecast, by Segment 1, 2018-2029
Table 22: Middle East & Africa Driver Fatigue and Distraction Monitoring System Market Revenue (USD Billion) Forecast, by Segment 2, 2018-2029
Table 23: Middle East & Africa Driver Fatigue and Distraction Monitoring System Market Revenue (USD Billion) Forecast, by Segment 3, 2018-2029
Table 24: Middle East & Africa Driver Fatigue and Distraction Monitoring System Market Revenue (USD Billion) Forecast, by Country, 2018-2029
Research Process
Data Library Research are conducted by industry experts who offer insight on
industry structure, market segmentations technology assessment and competitive landscape (CL), and penetration, as well as on emerging trends. Their analysis is based on primary interviews (~ 80%) and secondary research (~ 20%) as well as years of professional expertise in their respective industries. Adding to this, by analysing historical trends and current market positions, our analysts predict where the market will be headed for the next five years. Furthermore, the varying trends of segment & categories geographically presented are also studied and the estimated based on the primary & secondary research.
In this particular report from the supply side Data Library Research has conducted primary surveys (interviews) with the key level executives (VP, CEO’s, Marketing Director, Business Development Manager
and SOFT) of the companies that active & prominent as well as the midsized organization
FIGURE 1: DLR RESEARH PROCESS
![research-methodology1]()
Primary Research
Extensive primary research was conducted to gain a deeper insight of the market and industry performance. The analysis is based on both primary and secondary research as well as years of professional expertise in the respective industries.
In addition to analysing current and historical trends, our analysts predict where the market is headed over the next five years.
It varies by segment for these categories geographically presented in the list of market tables. Speaking about this particular report we have conducted primary surveys (interviews) with the key level executives (VP, CEO’s, Marketing Director, Business Development Manager and many more) of the major players active in the market.
Secondary Research
Secondary research was mainly used to collect and identify information useful for the extensive, technical, market-oriented, and Friend’s study of the Global Extra Neutral Alcohol. It was also used to obtain key information about major players, market classification and segmentation according to the industry trends, geographical markets, and developments related to the market and technology perspectives. For this study, analysts have gathered information from various credible sources, such as annual reports, sec filings, journals, white papers, SOFT presentations, and company web sites.
Market Size Estimation
Both, top-down and bottom-up approaches were used to estimate and validate the size of the Global market and to estimate the size of various other dependent submarkets in the overall Extra Neutral Alcohol. The key players in the market were identified through secondary research and their market contributions in the respective geographies were determined through primary and secondary research.
Forecast Model
![research-methodology2]()