Drugs For External Use Market Overview and Analysis

  • The Global Drugs for External Use Market grew from USD 7.9 billion in 2025 to USD 21.75 billion in 2032 and is projected to expand at a CAGR of 6.90% from 2025-2032.

Drugs For External Use Market

Get Complete Analysis Of The Report - Download Updated Free Sample PDF

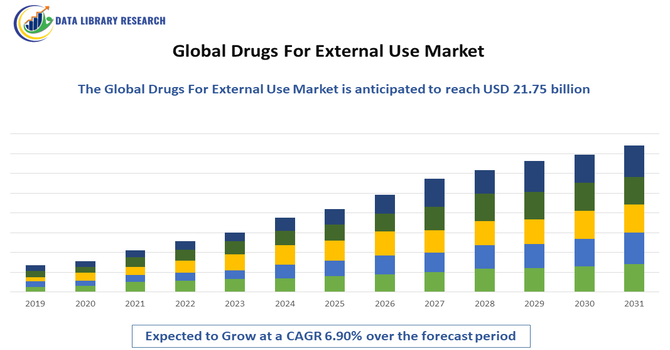
The Global Drugs for External Use Market refers to the worldwide industry focused on pharmaceuticals applied topically or externally to treat medical conditions. It includes creams, ointments, gels, lotions, sprays, and patches used for dermatological, musculoskeletal, and other localized treatments. Market growth is driven by increasing prevalence of skin disorders, rising awareness of self-care therapies, advancements in formulation technologies, and expanding geriatric populations. The market serves pharmaceutical companies, hospitals, and retail pharmacies, with regulatory compliance and innovative delivery systems shaping competitive dynamics globally.

Drugs For External Use Market Latest Trends

The global drugs for external use market is experiencing robust growth driven by rising prevalence of dermatological conditions, chronic pain, and musculoskeletal disorders. Innovations in topical formulations, such as enhanced skin absorption, nano-carriers, and combination therapies, are gaining traction. Increasing consumer preference for self-administered, non-invasive treatments has fueled demand for over-the-counter products. Additionally, the integration of natural and herbal ingredients, alongside conventional pharmaceuticals, reflects a trend toward holistic and personalized healthcare.

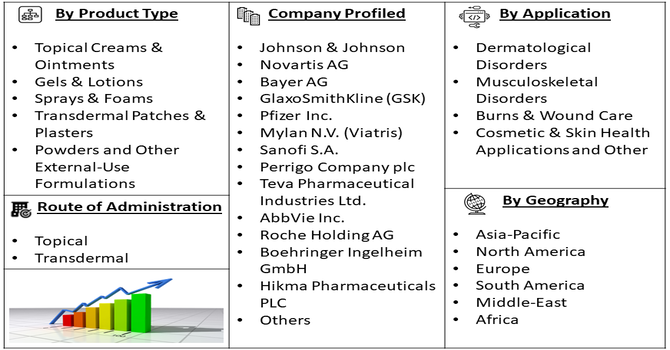
Segmentation: The Global Drugs for External Use Market is segmented by Product Type (Topical Creams & Ointments, Gels & Lotions, Sprays & Foams, Transdermal Patches & Plasters, Powders and Other External-Use Formulations), Therapeutic Application (Dermatological Disorders, Musculoskeletal Disorders, Burns & Wound Care, Cosmetic & Skin Health Applications and Other Applications), Route of Administration (Topical and Transdermal), and Geography (North America, Europe, Asia-Pacific, Middle East and Africa, and South America). The report provides the value (in USD million) for the above segments.

Drugs For External Use Market Segment

For Detailed Market Segmentation - Get a Free Sample PDF

Market Drivers:

  • Rising Prevalence of Skin and Musculoskeletal Disorders

The increasing incidence of dermatological conditions such as eczema, psoriasis, acne, and fungal infections, alongside musculoskeletal disorders like arthritis and localized pain, has significantly driven demand for drugs for external use. For instance, WHO reported that approximately 1.71 billion people have musculoskeletal conditions worldwide. Chronic conditions like musculoskeletal conditions requires long-term management have boosted repeat usage, encouraging manufacturers to develop innovative formulations with enhanced efficacy, penetration, and patient compliance. This trend has expanded both prescription and over-the-counter markets globally.

  • Technological Advancements and Innovative Formulations

Advances in pharmaceutical technologies, including enhanced absorption systems, nano-carrier delivery, and combination therapies, have driven the growth of the drugs for external use market. Innovations such as transdermal patches, medicated gels, creams with controlled release, and natural or herbal-infused formulations have improved efficacy and patient adherence. These developments enable precise targeting of affected areas, reduce systemic exposure, and expand the therapeutic potential of topical drugs. Additionally, companies increasingly leverage digital platforms and e-commerce for product distribution, further boosting accessibility. Continuous R&D investments have thus strengthened the market by meeting evolving consumer demands for safer and more effective topical treatments.

Market Restraints:

  • Regulatory Challenges and High Costs

The market faces significant restraints due to stringent regulatory requirements for safety, efficacy, and quality compliance, which vary across regions. Approval processes for new topical formulations can be time-consuming and costly, limiting rapid product launches, particularly for smaller manufacturers. Compliance with labeling, testing, and clinical trial standards further increases operational costs. Additionally, stringent regulations for herbal and natural products create barriers in some markets. These factors may hinder innovation, limit accessibility, and slow market expansion. Consequently, high regulatory burdens and associated costs restrict the entry of new players and the introduction of novel external-use therapies in the global market.

Socioeconomic Impact on Drugs For External Use Market

The market for drugs for external use contributes significantly to public health by providing effective, localized treatment options that reduce systemic side effects. Increased accessibility to topical therapies has improved quality of life for patients with chronic conditions, such as arthritis or eczema. The sector stimulates economic growth by generating employment in pharmaceutical manufacturing, R&D, and retail distribution. Rising healthcare spending and growing health awareness among aging populations have expanded market reach. However, affordability and insurance coverage remain challenges in some regions. Overall, the market promotes self-care, reduces hospitalization rates, and strengthens healthcare infrastructure globally.

Segmental Analysis:

  • Transdermal Patches & Plasters segment is expected to witness highest growth over the forecast period

The Transdermal Patches & Plasters segment is expected to witness the highest growth over the forecast period due to their convenience, sustained drug release, and targeted delivery. These systems improve patient compliance by reducing dosing frequency and minimizing systemic side effects. Rising adoption for pain management, hormone therapy, and anti-inflammatory treatments has driven demand. Innovations in patch technology, such as microneedles and advanced adhesives, further enhance therapeutic efficiency. Growing awareness among healthcare providers and patients, coupled with increasing availability in retail and online channels, supports rapid market expansion globally.

  • Musculoskeletal Disorders segment is expected to witness the highest growth over the forecast period

The Musculoskeletal Disorders segment is projected to experience the highest growth due to increasing prevalence of arthritis, back pain, joint disorders, and sports-related injuries. Topical and transdermal drugs provide effective localized relief with fewer systemic side effects compared to oral medications. Rising geriatric populations, sedentary lifestyles, and awareness of self-care therapies have accelerated market demand. Pharmaceutical companies are developing novel anti-inflammatory gels, creams, and patches tailored to these conditions. Expansion of retail pharmacy networks, online sales, and inclusion in public healthcare programs further enhance access, driving steady growth in this therapeutic segment globally.

  • Topical segment is expected to witness the highest growth over the forecast period

The Topical segment is expected to witness significant growth owing to its widespread use for dermatological and localized treatments. Topical formulations such as creams, gels, and ointments offer convenience, ease of application, and minimal systemic exposure. Rising incidences of skin disorders like eczema, acne, psoriasis, and fungal infections drive demand. Advancements in formulation technologies, including enhanced absorption, medicated gels, and combination therapies, improve efficacy and patient compliance. Over-the-counter availability, growing health awareness, and the preference for self-administered treatments in homecare settings have further fueled adoption, supporting strong market growth throughout the forecast period.

  • North American Region is expected to witness the highest growth over the forecast period

North America is anticipated to witness the highest growth in the drugs for external use market due to well-established healthcare infrastructure, high healthcare spending, and strong regulatory frameworks. The region has a large patient base with dermatological and musculoskeletal disorders, coupled with rising adoption of OTC and prescription topical therapies.

Advanced R&D, presence of major pharmaceutical companies, and innovations in transdermal and topical drug delivery systems further boost market expansion. For instance, in July 2025, Alvogen’s voluntary recall of Fentanyl Transdermal System patches highlighted safety and quality challenges in North America’s drugs for external use market. The incident emphasized the need for stringent manufacturing controls, regulatory compliance, and robust quality assurance in transdermal products, which impacted market trust and prompted stricter oversight across the region.

E-commerce and retail pharmacy penetration enhance accessibility, while stringent FDA approvals ensure safety and efficacy, making North America a leading growth region in the global drugs for external use market. For instance, Walmart’s widespread same-day delivery and Amazon’s RxPass subscription have significantly boosted North America’s e-commerce and retail pharmacy accessibility. By integrating prescription refills with everyday shopping and offering affordable, convenient access to generic drugs, these innovations have expanded reach, improved patient adherence, and driven growth in the drugs for external use market. Thus, together these factors are driving this region’s growth.

Drugs For External Use Market table

To Learn More About This Report - Request a Free Sample Copy

Drugs For External Use Market Competitive Landscape

The competitive landscape of the drugs for external use market is moderately consolidated, with major global and regional pharmaceutical companies competing through product innovation, mergers, and strategic partnerships. Key players include Johnson & Johnson, Novartis, Bayer, GlaxoSmithKline, Pfizer, Mylan, Sanofi, and Perrigo. Companies differentiate through advanced topical formulations, natural ingredient integration, and targeted therapies for dermatological or musculoskeletal conditions. Emerging players focus on cost-effective, OTC products and niche therapeutic areas. The market is shaped by regulatory compliance, patent portfolios, and the ability to scale production. Strategic alliances and acquisitions also play a crucial role in expanding geographic presence.

The major players for the above market are:

  • Johnson & Johnson
  • Novartis AG
  • Bayer AG
  • GlaxoSmithKline (GSK)
  • Pfizer Inc.
  • Mylan N.V. (Viatris)
  • Sanofi S.A.
  • Perrigo Company plc
  • Teva Pharmaceutical Industries Ltd.
  • AbbVie Inc.
  • Roche Holding AG
  • Boehringer Ingelheim GmbH
  • Hikma Pharmaceuticals PLC
  • Sun Pharmaceutical Industries Ltd.
  • Glenmark Pharmaceuticals Ltd.
  • Dr. Reddy’s Laboratories Ltd.
  • Cipla Ltd.
  • Lupin Pharmaceuticals Inc.
  • Aurobindo Pharma Ltd.
  • Dermira, Inc.

Recent Development

  • In April 2025, Luye Pharma’s launched Rotigotine Luye in the UK strengthened the global drugs for external use market by boosting the transdermal patch segment. The product’s generic, bioequivalent formulation for Parkinson’s disease and restless legs syndrome highlighted growing demand for convenient, targeted, and cost-effective external-use therapies worldwide.


  • In March 2025, Corsair Pharma’s successful preclinical development of the TRX-248 transdermal system advanced the global drugs for external use market by emphasizing innovation in once-daily patch therapies. Its progression toward human trials highlighted growing investment in targeted, convenient, and patient-friendly external-use treatments for chronic conditions like pulmonary arterial hypertension.


Frequently Asked Questions (FAQ) :

Q1. What are the main growth-driving factors for this market?

The market is growing because more people are dealing with chronic skin conditions like eczema, psoriasis, and acne. As the global population ages, there is also a higher demand for topical pain-relief creams and wound-healing ointments. Additionally, consumers increasingly prefer "localized" treatments that act directly on the affected area, reducing the risk of side effects associated with pills.

Q2. What are the main restraining factors for this market?

Growth is limited by the rising cost of high-quality active ingredients and strict safety regulations for new dermatological products. Many patients also struggle with the messiness or inconvenience of applying creams multiple times a day. Furthermore, the availability of cheaper, non-prescription generic products can make it difficult for premium, patented brands to maintain high profit margins.

Q3. Which segment is expected to witness high growth?

The Transdermal Patches segment is expected to see the highest growth. These patches are becoming popular because they provide a steady, controlled release of medication through the skin over several days. They are highly convenient for managing chronic pain, hormone replacement, or nicotine addiction, as they eliminate the need for frequent dosing or swallowing difficult pills.

Q4. Who are the top major players for this market?

The market is led by global pharmaceutical leaders who specialize in skin health and topical delivery systems. Key players include Johnson & Johnson, L'Oréal (La Roche-Posay), Galderma, Bayer, and GlaxoSmithKline (GSK). These companies dominate by developing advanced formulas that penetrate the skin more effectively and by maintaining massive global distribution networks through pharmacies.

Q5. Which country is the largest player?

The United States is the largest player in the drugs for external use market. This is driven by a high prevalence of skin disorders and a strong culture of self-care and aesthetic medicine. The presence of world-leading pharmaceutical research centers and high consumer spending on advanced dermatological treatments ensures that the U.S. remains the primary global market.

Drugs For External Use MARKET STUDY GLOBAL MARKET ANALYSIS, INSIGHTS AND FORECAST, 2022-2029

    1. Introduction

    • 1.1. Research Scope
    • 1.2. Market Segmentation
    • 1.3. Research Methodology
    • 1.4. Definitions and Assumptions

    2. Executive Summary

      3. Market Dynamics

      • 3.1. Market Drivers
      • 3.2. Market Restraints
      • 3.3. Market Opportunities

      4. Key Insights

      • 4.1. Key Emerging Trends – For Major Countries
      • 4.2. Latest Technological Advancement
      • 4.3. Regulatory Landscape
      • 4.4. Industry SWOT Analysis
      • 4.5. Porters Five Forces Analysis

      5. Global Drugs For External Use Market Analysis (USD Billion), Insights and Forecast, 2018-2029

      • 5.1. Key Findings / Summary
      • 5.2. Market Analysis, Insights and Forecast – By Segment 1
        • 5.2.1. Sub-Segment 1
        • 5.2.2. Sub-Segment 2
      • 5.3. Market Analysis, Insights and Forecast – By Segment 2
        • 5.3.1. Sub-Segment 1
        • 5.3.2. Sub-Segment 2
        • 5.3.3. Sub-Segment 3
        • 5.3.4. Others
      • 5.4. Market Analysis, Insights and Forecast – By Segment 3
        • 5.4.1. Sub-Segment 1
        • 5.4.2. Sub-Segment 2
        • 5.4.3. Sub-Segment 3
        • 5.4.4. Others
      • 5.5. Market Analysis, Insights and Forecast – By Region
        • 5.5.1. North America
        • 5.5.2. Latin America
        • 5.5.3. Europe
        • 5.5.4. Asia Pacific
        • 5.5.5. Middle East and Africa

      6. North America Drugs For External Use Market Analysis (USD Billion), Insights and Forecast, 2018-2029

      • 6.1. Key Findings / Summary
      • 6.2. Market Analysis, Insights and Forecast – By Segment 1
        • 6.2.1. Sub-Segment 1
        • 6.2.2. Sub-Segment 2
      • 6.3. Market Analysis, Insights and Forecast – By Segment 2
        • 6.3.1. Sub-Segment 1
        • 6.3.2. Sub-Segment 2
        • 6.3.3. Sub-Segment 3
        • 6.3.4. Others
      • 6.4. Market Analysis, Insights and Forecast – By Segment 3
        • 6.4.1. Sub-Segment 1
        • 6.4.2. Sub-Segment 2
        • 6.4.3. Sub-Segment 3
        • 6.4.4. Others
      • 6.5. Market Analysis, Insights and Forecast – By Country
        • 6.5.1. U.S.
        • 6.5.2. Canada

      7. Latin America Drugs For External Use Market Analysis (USD Billion), Insights and Forecast, 2018-2029

      • 7.1. Key Findings / Summary
      • 7.2. Market Analysis, Insights and Forecast – By Segment 1
        • 7.2.1. Sub-Segment 1
        • 7.2.2. Sub-Segment 2
      • 7.3. Market Analysis, Insights and Forecast – By Segment 2
        • 7.3.1. Sub-Segment 1
        • 7.3.2. Sub-Segment 2
        • 7.3.3. Sub-Segment 3
        • 7.3.4. Others
      • 7.4. Market Analysis, Insights and Forecast – By Segment 3
        • 7.4.1. Sub-Segment 1
        • 7.4.2. Sub-Segment 2
        • 7.4.3. Sub-Segment 3
        • 7.4.4. Others
      • 7.5. Insights and Forecast – By Country
        • 7.5.1. Brazil
        • 7.5.2. Mexico
        • 7.5.3. Rest of Latin America

      8. Europe Drugs For External Use Market Analysis (USD Billion), Insights and Forecast, 2018-2029

      • 8.1. Key Findings / Summary
      • 8.2. Market Analysis, Insights and Forecast – By Segment 1
        • 8.2.1. Sub-Segment 1
        • 8.2.2. Sub-Segment 2
      • 8.3. Market Analysis, Insights and Forecast – By Segment 2
        • 8.3.1. Sub-Segment 1
        • 8.3.2. Sub-Segment 2
        • 8.3.3. Sub-Segment 3
        • 8.3.4. Others
      • 8.4. Market Analysis, Insights and Forecast – By Segment 3
        • 8.4.1. Sub-Segment 1
        • 8.4.2. Sub-Segment 2
        • 8.4.3. Sub-Segment 3
        • 8.4.4. Others
      • 8.5. Market Analysis, Insights and Forecast – By Country
        • 8.5.1. UK
        • 8.5.2. Germany
        • 8.5.3. France
        • 8.5.4. Italy
        • 8.5.5. Spain
        • 8.5.6. Russia
        • 8.5.7. Rest of Europe

      9. Asia Pacific Drugs For External Use Market Analysis (USD Billion), Insights and Forecast, 2018-2029

      • 9.1. Key Findings / Summary
      • 9.2. Market Analysis, Insights and Forecast – By Segment 1
        • 9.2.1. Sub-Segment 1
        • 9.2.2. Sub-Segment 2
      • 9.3. Market Analysis, Insights and Forecast – By Segment 2
        • 9.3.1. Sub-Segment 1
        • 9.3.2. Sub-Segment 2
        • 9.3.3. Sub-Segment 3
        • 9.3.4. Others
      • 9.4. Market Analysis, Insights and Forecast – By Segment 3
        • 9.4.1. Sub-Segment 1
        • 9.4.2. Sub-Segment 2
        • 9.4.3. Sub-Segment 3
        • 9.4.4. Others
      • 9.5. Market Analysis, Insights and Forecast – By Country
        • 9.5.1. China
        • 9.5.2. India
        • 9.5.3. Japan
        • 9.5.4. Australia
        • 9.5.5. South East Asia
        • 9.5.6. Rest of Asia Pacific

      10. Middle East & Africa Drugs For External Use Market Analysis (USD Billion), Insights and Forecast, 2018-2029

      • 10.1. Key Findings / Summary
      • 10.2. Market Analysis, Insights and Forecast – By Segment 1
        • 10.2.1. Sub-Segment 1
        • 10.2.2. Sub-Segment 2
      • 10.3. Market Analysis, Insights and Forecast – By Segment 2
        • 10.3.1. Sub-Segment 1
        • 10.3.2. Sub-Segment 2
        • 10.3.3. Sub-Segment 3
        • 10.3.4. Others
      • 10.4. Market Analysis, Insights and Forecast – By Segment 3
        • 10.4.1. Sub-Segment 1
        • 10.4.2. Sub-Segment 2
        • 10.4.3. Sub-Segment 3
        • 10.4.4. Others
      • 10.5. Market Analysis, Insights and Forecast – By Country
        • 10.5.1. GCC
        • 10.5.2. South Africa
        • 10.5.3. Rest of Middle East & Africa

      11. Competitive Analysis

      • 11.1. Company Market Share Analysis, 2018
      • 11.2. Key Industry Developments
      • 11.3. Company Profile
        • 11.3.1. Company 1
          • 11.3.1.1. Business Overview
          • 11.3.1.2. Segment 1 & Service Offering
          • 11.3.1.3. Overall Revenue
          • 11.3.1.4. Geographic Presence
          • 11.3.1.5. Recent Development
        *Similar details will be provided for the following companies
        • 11.3.2. Company 2
        • 11.3.3. Company 3
        • 11.3.4. Company 4
        • 11.3.5. Company 5
        • 11.3.6. Company 6
        • 11.3.7. Company 7
        • 11.3.8. Company 8
        • 11.3.9. Company 9
        • 11.3.10. Company 10
        • 11.3.11. Company 11
        • 11.3.12. Company 12
      List of Figures

      Figure 1: Global Drugs For External Use Market Revenue Breakdown (USD Billion, %) by Region, 2022 & 2029
      Figure 2: Global Drugs For External Use Market Value Share (%), By Segment 1, 2022 & 2029
      Figure 3: Global Drugs For External Use Market Forecast (USD Billion), by Sub-Segment 1, 2018-2029
      Figure 4: Global Drugs For External Use Market Forecast (USD Billion), by Sub-Segment 2, 2018-2029
      Figure 5: Global Drugs For External Use Market Value Share (%), By Segment 2, 2022 & 2029
      Figure 6: Global Drugs For External Use Market Forecast (USD Billion), by Sub-Segment 1, 2018-2029
      Figure 7: Global Drugs For External Use Market Forecast (USD Billion), by Sub-Segment 2, 2018-2029
      Figure 8: Global Drugs For External Use Market Forecast (USD Billion), by Sub-Segment 3, 2018-2029
      Figure 9: Global Drugs For External Use Market Forecast (USD Billion), by Others, 2018-2029
      Figure 10: Global Drugs For External Use Market Value Share (%), By Segment 3, 2022 & 2029
      Figure 11: Global Drugs For External Use Market Forecast (USD Billion), by Sub-Segment 1, 2018-2029
      Figure 12: Global Drugs For External Use Market Forecast (USD Billion), by Sub-Segment 2, 2018-2029
      Figure 13: Global Drugs For External Use Market Forecast (USD Billion), by Sub-Segment 3, 2018-2029
      Figure 14: Global Drugs For External Use Market Forecast (USD Billion), by Others, 2018-2029
      Figure 15: Global Drugs For External Use Market Value (USD Billion), by Region, 2022 & 2029
      Figure 16: North America Drugs For External Use Market Value Share (%), By Segment 1, 2022 & 2029
      Figure 17: North America Drugs For External Use Market Forecast (USD Billion), by Sub-Segment 1, 2018-2029
      Figure 18: North America Drugs For External Use Market Forecast (USD Billion), by Sub-Segment 2, 2018-2029
      Figure 19: North America Drugs For External Use Market Value Share (%), By Segment 2, 2022 & 2029
      Figure 20: North America Drugs For External Use Market Forecast (USD Billion), by Sub-Segment 1, 2018-2029
      Figure 21: North America Drugs For External Use Market Forecast (USD Billion), by Sub-Segment 2, 2018-2029
      Figure 22: North America Drugs For External Use Market Forecast (USD Billion), by Sub-Segment 3, 2018-2029
      Figure 23: North America Drugs For External Use Market Forecast (USD Billion), by Others, 2018-2029
      Figure 24: North America Drugs For External Use Market Value Share (%), By Segment 3, 2022 & 2029
      Figure 25: North America Drugs For External Use Market Forecast (USD Billion), by Sub-Segment 1, 2018-2029
      Figure 26: North America Drugs For External Use Market Forecast (USD Billion), by Sub-Segment 2, 2018-2029
      Figure 27: North America Drugs For External Use Market Forecast (USD Billion), by Sub-Segment 3, 2018-2029
      Figure 28: North America Drugs For External Use Market Forecast (USD Billion), by Others, 2018-2029
      Figure 29: North America Drugs For External Use Market Forecast (USD Billion), by U.S., 2018-2029
      Figure 30: North America Drugs For External Use Market Forecast (USD Billion), by Canada, 2018-2029
      Figure 31: Latin America Drugs For External Use Market Value Share (%), By Segment 1, 2022 & 2029
      Figure 32: Latin America Drugs For External Use Market Forecast (USD Billion), by Sub-Segment 1, 2018-2029
      Figure 33: Latin America Drugs For External Use Market Forecast (USD Billion), by Sub-Segment 2, 2018-2029
      Figure 34: Latin America Drugs For External Use Market Value Share (%), By Segment 2, 2022 & 2029
      Figure 35: Latin America Drugs For External Use Market Forecast (USD Billion), by Sub-Segment 1, 2018-2029
      Figure 36: Latin America Drugs For External Use Market Forecast (USD Billion), by Sub-Segment 2, 2018-2029
      Figure 37: Latin America Drugs For External Use Market Forecast (USD Billion), by Sub-Segment 3, 2018-2029
      Figure 38: Latin America Drugs For External Use Market Forecast (USD Billion), by Others, 2018-2029
      Figure 39: Latin America Drugs For External Use Market Value Share (%), By Segment 3, 2022 & 2029
      Figure 40: Latin America Drugs For External Use Market Forecast (USD Billion), by Sub-Segment 1, 2018-2029
      Figure 41: Latin America Drugs For External Use Market Forecast (USD Billion), by Sub-Segment 2, 2018-2029
      Figure 42: Latin America Drugs For External Use Market Forecast (USD Billion), by Sub-Segment 3, 2018-2029
      Figure 43: Latin America Drugs For External Use Market Forecast (USD Billion), by Others, 2018-2029
      Figure 44: Latin America Drugs For External Use Market Forecast (USD Billion), by Brazil, 2018-2029
      Figure 45: Latin America Drugs For External Use Market Forecast (USD Billion), by Mexico, 2018-2029
      Figure 46: Latin America Drugs For External Use Market Forecast (USD Billion), by Rest of Latin America, 2018-2029
      Figure 47: Europe Drugs For External Use Market Value Share (%), By Segment 1, 2022 & 2029
      Figure 48: Europe Drugs For External Use Market Forecast (USD Billion), by Sub-Segment 1, 2018-2029
      Figure 49: Europe Drugs For External Use Market Forecast (USD Billion), by Sub-Segment 2, 2018-2029
      Figure 50: Europe Drugs For External Use Market Value Share (%), By Segment 2, 2022 & 2029
      Figure 51: Europe Drugs For External Use Market Forecast (USD Billion), by Sub-Segment 1, 2018-2029
      Figure 52: Europe Drugs For External Use Market Forecast (USD Billion), by Sub-Segment 2, 2018-2029
      Figure 53: Europe Drugs For External Use Market Forecast (USD Billion), by Sub-Segment 3, 2018-2029
      Figure 54: Europe Drugs For External Use Market Forecast (USD Billion), by Others, 2018-2029
      Figure 55: Europe Drugs For External Use Market Value Share (%), By Segment 3, 2022 & 2029
      Figure 56: Europe Drugs For External Use Market Forecast (USD Billion), by Sub-Segment 1, 2018-2029
      Figure 57: Europe Drugs For External Use Market Forecast (USD Billion), by Sub-Segment 2, 2018-2029
      Figure 58: Europe Drugs For External Use Market Forecast (USD Billion), by Sub-Segment 3, 2018-2029
      Figure 59: Europe Drugs For External Use Market Forecast (USD Billion), by Others, 2018-2029
      Figure 60: Europe Drugs For External Use Market Forecast (USD Billion), by U.K., 2018-2029
      Figure 61: Europe Drugs For External Use Market Forecast (USD Billion), by Germany, 2018-2029
      Figure 62: Europe Drugs For External Use Market Forecast (USD Billion), by France, 2018-2029
      Figure 63: Europe Drugs For External Use Market Forecast (USD Billion), by Italy, 2018-2029
      Figure 64: Europe Drugs For External Use Market Forecast (USD Billion), by Spain, 2018-2029
      Figure 65: Europe Drugs For External Use Market Forecast (USD Billion), by Russia, 2018-2029
      Figure 66: Europe Drugs For External Use Market Forecast (USD Billion), by Rest of Europe, 2018-2029
      Figure 67: Asia Pacific Drugs For External Use Market Value Share (%), By Segment 1, 2022 & 2029
      Figure 68: Asia Pacific Drugs For External Use Market Forecast (USD Billion), by Sub-Segment 1, 2018-2029
      Figure 69: Asia Pacific Drugs For External Use Market Forecast (USD Billion), by Sub-Segment 2, 2018-2029
      Figure 70: Asia Pacific Drugs For External Use Market Value Share (%), By Segment 2, 2022 & 2029
      Figure 71: Asia Pacific Drugs For External Use Market Forecast (USD Billion), by Sub-Segment 1, 2018-2029
      Figure 72: Asia Pacific Drugs For External Use Market Forecast (USD Billion), by Sub-Segment 2, 2018-2029
      Figure 73: Asia Pacific Drugs For External Use Market Forecast (USD Billion), by Sub-Segment 3, 2018-2029
      Figure 74: Asia Pacific Drugs For External Use Market Forecast (USD Billion), by Others, 2018-2029
      Figure 75: Asia Pacific Drugs For External Use Market Value Share (%), By Segment 3, 2022 & 2029
      Figure 76: Asia Pacific Drugs For External Use Market Forecast (USD Billion), by Sub-Segment 1, 2018-2029
      Figure 77: Asia Pacific Drugs For External Use Market Forecast (USD Billion), by Sub-Segment 2, 2018-2029
      Figure 78: Asia Pacific Drugs For External Use Market Forecast (USD Billion), by Sub-Segment 3, 2018-2029
      Figure 79: Asia Pacific Drugs For External Use Market Forecast (USD Billion), by Others, 2018-2029
      Figure 80: Asia Pacific Drugs For External Use Market Forecast (USD Billion), by China, 2018-2029
      Figure 81: Asia Pacific Drugs For External Use Market Forecast (USD Billion), by India, 2018-2029
      Figure 82: Asia Pacific Drugs For External Use Market Forecast (USD Billion), by Japan, 2018-2029
      Figure 83: Asia Pacific Drugs For External Use Market Forecast (USD Billion), by Australia, 2018-2029
      Figure 84: Asia Pacific Drugs For External Use Market Forecast (USD Billion), by Southeast Asia, 2018-2029
      Figure 85: Asia Pacific Drugs For External Use Market Forecast (USD Billion), by Rest of Asia Pacific, 2018-2029
      Figure 86: Middle East & Africa Drugs For External Use Market Value Share (%), By Segment 1, 2022 & 2029
      Figure 87: Middle East & Africa Drugs For External Use Market Forecast (USD Billion), by Sub-Segment 1, 2018-2029
      Figure 88: Middle East & Africa Drugs For External Use Market Forecast (USD Billion), by Sub-Segment 2, 2018-2029
      Figure 89: Middle East & Africa Drugs For External Use Market Value Share (%), By Segment 2, 2022 & 2029
      Figure 90: Middle East & Africa Drugs For External Use Market Forecast (USD Billion), by Sub-Segment 1, 2018-2029
      Figure 91: Middle East & Africa Drugs For External Use Market Forecast (USD Billion), by Sub-Segment 2, 2018-2029
      Figure 92: Middle East & Africa Drugs For External Use Market Forecast (USD Billion), by Sub-Segment 3, 2018-2029
      Figure 93: Middle East & Africa Drugs For External Use Market Forecast (USD Billion), by Others, 2018-2029
      Figure 94: Middle East & Africa Drugs For External Use Market Value Share (%), By Segment 3, 2022 & 2029
      Figure 95: Middle East & Africa Drugs For External Use Market Forecast (USD Billion), by Sub-Segment 1, 2018-2029
      Figure 96: Middle East & Africa Drugs For External Use Market Forecast (USD Billion), by Sub-Segment 2, 2018-2029
      Figure 97: Middle East & Africa Drugs For External Use Market Forecast (USD Billion), by Sub-Segment 3, 2018-2029
      Figure 98: Middle East & Africa Drugs For External Use Market Forecast (USD Billion), by Others, 2018-2029
      Figure 99: Middle East & Africa Drugs For External Use Market Forecast (USD Billion), by GCC, 2018-2029
      Figure 100: Middle East & Africa Drugs For External Use Market Forecast (USD Billion), by South Africa, 2018-2029
      Figure 101: Middle East & Africa Drugs For External Use Market Forecast (USD Billion), by Rest of Middle East & Africa, 2018-2029 
      List of Tables
      Table 1: Global Drugs For External Use Market Revenue (USD Billion) Forecast, by Segment 1, 2018-2029
      Table 2: Global Drugs For External Use Market Revenue (USD Billion) Forecast, by Segment 2, 2018-2029
      Table 3: Global Drugs For External Use Market Revenue (USD Billion) Forecast, by Segment 3, 2018-2029
      Table 4: Global Drugs For External Use Market Revenue (USD Billion) Forecast, by Region, 2018-2029
      Table 5: North America Drugs For External Use Market Revenue (USD Billion) Forecast, by Segment 1, 2018-2029
      Table 6: North America Drugs For External Use Market Revenue (USD Billion) Forecast, by Segment 2, 2018-2029
      Table 7: North America Drugs For External Use Market Revenue (USD Billion) Forecast, by Segment 3, 2018-2029
      Table 8: North America Drugs For External Use Market Revenue (USD Billion) Forecast, by Country, 2018-2029
      Table 9: Europe Drugs For External Use Market Revenue (USD Billion) Forecast, by Segment 1, 2018-2029
      Table 10: Europe Drugs For External Use Market Revenue (USD Billion) Forecast, by Segment 2, 2018-2029
      Table 11: Europe Drugs For External Use Market Revenue (USD Billion) Forecast, by Segment 3, 2018-2029
      Table 12: Europe Drugs For External Use Market Revenue (USD Billion) Forecast, by Country, 2018-2029
      Table 13: Latin America Drugs For External Use Market Revenue (USD Billion) Forecast, by Segment 1, 2018-2029
      Table 14: Latin America Drugs For External Use Market Revenue (USD Billion) Forecast, by Segment 2, 2018-2029
      Table 15: Latin America Drugs For External Use Market Revenue (USD Billion) Forecast, by Segment 3, 2018-2029
      Table 16: Latin America Drugs For External Use Market Revenue (USD Billion) Forecast, by Country, 2018-2029
      Table 17: Asia Pacific Drugs For External Use Market Revenue (USD Billion) Forecast, by Segment 1, 2018-2029
      Table 18: Asia Pacific Drugs For External Use Market Revenue (USD Billion) Forecast, by Segment 2, 2018-2029
      Table 19: Asia Pacific Drugs For External Use Market Revenue (USD Billion) Forecast, by Segment 3, 2018-2029
      Table 20: Asia Pacific Drugs For External Use Market Revenue (USD Billion) Forecast, by Country, 2018-2029
      Table 21: Middle East & Africa Drugs For External Use Market Revenue (USD Billion) Forecast, by Segment 1, 2018-2029
      Table 22: Middle East & Africa Drugs For External Use Market Revenue (USD Billion) Forecast, by Segment 2, 2018-2029
      Table 23: Middle East & Africa Drugs For External Use Market Revenue (USD Billion) Forecast, by Segment 3, 2018-2029
      Table 24: Middle East & Africa Drugs For External Use Market Revenue (USD Billion) Forecast, by Country, 2018-2029
      Research Process

      Data Library Research are conducted by industry experts who offer insight on industry structure, market segmentations technology assessment and competitive landscape (CL), and penetration, as well as on emerging trends. Their analysis is based on primary interviews (~ 80%) and secondary research (~ 20%) as well as years of professional expertise in their respective industries. Adding to this, by analysing historical trends and current market positions, our analysts predict where the market will be headed for the next five years. Furthermore, the varying trends of segment & categories geographically presented are also studied and the estimated based on the primary & secondary research.

      In this particular report from the supply side Data Library Research has conducted primary surveys (interviews) with the key level executives (VP, CEO’s, Marketing Director, Business Development Manager and SOFT) of the companies that active & prominent as well as the midsized organization

      FIGURE 1: DLR RESEARH PROCESS

      research-methodology1

      Primary Research

      Extensive primary research was conducted to gain a deeper insight of the market and industry performance. The analysis is based on both primary and secondary research as well as years of professional expertise in the respective industries.

      In addition to analysing current and historical trends, our analysts predict where the market is headed over the next five years.

      It varies by segment for these categories geographically presented in the list of market tables. Speaking about this particular report we have conducted primary surveys (interviews) with the key level executives (VP, CEO’s, Marketing Director, Business Development Manager and many more) of the major players active in the market.

      Secondary Research

      Secondary research was mainly used to collect and identify information useful for the extensive, technical, market-oriented, and Friend’s study of the Global Extra Neutral Alcohol. It was also used to obtain key information about major players, market classification and segmentation according to the industry trends, geographical markets, and developments related to the market and technology perspectives. For this study, analysts have gathered information from various credible sources, such as annual reports, sec filings, journals, white papers, SOFT presentations, and company web sites.

      Market Size Estimation

      Both, top-down and bottom-up approaches were used to estimate and validate the size of the Global market and to estimate the size of various other dependent submarkets in the overall Extra Neutral Alcohol. The key players in the market were identified through secondary research and their market contributions in the respective geographies were determined through primary and secondary research.

      Forecast Model

      research-methodology2