DataLibraryResearch is tracking the market dynamics of the crisis in the Automobile & Transportation industry amid lock-down changes in the supply chain.
Get detailed analysis of the COVID-19 impact on the E-drive for Automotive Market
Global Smart e-drive for Automotive Market Opportunities and Forecast 2020-2027
Global Smart e-Drive for Automotive Market, By Component (Battery, Motor Generator, Power Electronics, E-Brake Booster), By Vehicle Type (Passenger Vehicle [Hatchback, Sedan, Utility Vehicles], Commercial Vehicle, Trucks), By Electric Vehicle Type (Battery Electric Vehicles, Plug-In Hybrid Electric vehicles, Hybrid Electric Vehicles, Electric Bus), By Drive Type (Front Wheel Drive, Rear Wheel Drive, Others), By Application (E-axle, Wheel Drive), By Battery Type (Lithium-ion, Nickel-based, Lead Acid and Solid State Battery), and opportunities and forecast 2020-2027
Smart e-Drive for Automotive Market Overview
A smart e-drive is a more complex variant of a traditional electric drive system. Smart e-drive uses the vehicle's battery as a power source and delivers direct transmission, resulting in a smooth and safe driving experience. The global Smart e-Drive for Automotive market is expected to grow at a significant rate in the forecast period. An increase in demand for hybrid and electric vehicles to reduce carbon emissions is a key factor that boosts the growth of the global Smart e-Drive for Automotive market. Furthermore, the development of truck platooning and integrated mobility solutions, which make use of hybrid and electric vehicles for optimal performance, is likely to increase demand for smart e-drive systems. This, in turn, propels the smart e-drive for the global automotive market. In addition, the implementation of strict pollution and safety regulations on the automobile industry by worldwide regulatory organizations is also expected to boost the smart e-Drive for automotive market. Further, during the forecast period, an increase in demand for electric vehicles, strategic activities by numerous key players, and government initiatives to enhance the sale of electric vehicles are projected to boost demand for smart e-drive for automotive. Eventually, it rises the growth of the market.
Additionally, the development of urbanization is accelerating, resulting in an increase in the average income of urban residents, allowing them to improve their lifestyles. Furthermore, increased demand for passenger cars is encouraging manufacturers to enhance vehicle production, which is increasing the growth of the global smart e-drive for automotive market.
On the downside, stringent norms and restrictions established by numerous governments for the development and manufacture of electric vehicles have resulted in the production of electric vehicles in some countries, which is expected to limit the growth of the global smart e-drive for automotive market.
Report Metric
Details
Market size available for years
2019–2027
Base year considered
2019
Forecast period
2020–2027
Forecast unit
Value (USD Million)
Segments covered
Component, Vehicle Type, Electric Vehicle Type, Drive Type, Application, Battery Type, and Region
Regions covered
North America (the U.S. and Canada), Europe (UK, Germany, France, Italy, Spain, Russia, Rest of Europe), Asia-Pacific (China, India, Japan, Australia, South East Asia, Rest of Asia Pacific), Latin America and the Middle East and Africa (Brazil, Saudi Arabia, UAE, Rest of LAMEA)
Companies covered
Robert Bosch GmBH, ZF Friedrichshafen AG, Siemens AG, GKN PLC, Hitachi, Ltd., Magna International Inc., AISIN SEIKI Co., Ltd., Continental AG, Schaeffler AG, SMR, Magnetic Systems Technology, ACTIA Group, BorgWarner, ABM Greiffenberger, AVL List Gmbh.
Covid-19 Impact on Smart e-Drive for Automotive Market
The outbreak of the covid-19 has a severe and swift impact on the automobile and transportation industry. This is majorly due to the shutdown of assembly plants in the US, interruptions across Europe in large-scale manufacturing, and disruption in the export of Chinese parts. In addition to this, the industry is dealing with reduced demand across the globe due to changes in customer behavior and shifts in a supply-demand chain. A recent study shows a 39% decline in sales of automotive all over the world. Moreover, the nationwide lockdowns have substantially affected the transportation sector. Restrictions on transportation accounted for a 45 to 55% decline in public as well as private transport sectors.
Smart e-Drive for Automotive Market Segment Overview
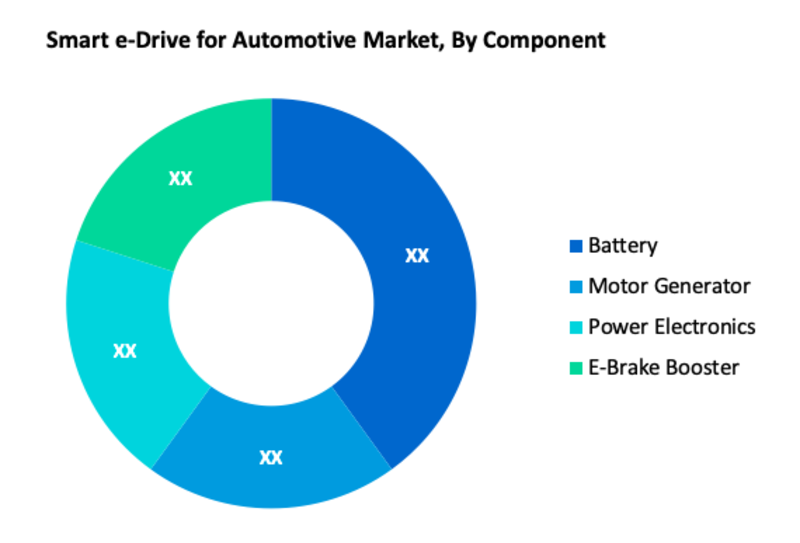
According to Component, the Battery segment leads with the largest share in the global Smart e-Drive for Automotive market. This is due to the increased demand for the product from electric vehicle manufacturers. Also, this segment is anticipated to grow at an impressive CAGR during the forecast period. By electric vehicle type, Hybrid electric vehicles is the largest segment in the market. This is because this vehicle type possesses a combination of better and internal combustion engine systems. Additionally, manufacturers offer an extensive variety of models under hybrid vehicles, and as such, the segment is projected to grow at the fastest rate in the forecast period.
Smart e-Drive for Automotive Market, By Component · Battery · Motor Generator · Power Electronics · E-Brake Booster
Smart e-Drive for Automotive Market, By Vehicle Type
Passenger Vehicle
Hatchback
Sedan
Utility Vehicles
Commercial Vehicle
Trucks
Smart e-Drive for Automotive Market, By Electric Vehicle Type · Battery Electric Vehicles · Plug-In Hybrid Electric vehicles · Hybrid Electric Vehicles · Electric Bus
Smart e-Drive for Automotive Market, By Drive Type · Front Wheel Drive · Rear Wheel Drive · Others
Smart e-Drive for Automotive Market, By Application · E-axle · Wheel Drive
Smart e-Drive for Automotive Market, By Battery Type · Lithium-ion · Nickel-based · Lead Acid and Solid State Battery
Smart e-Drive for Automotive Regional Overview
In terms of region, Europe holds a major share of the global smart e-drive for automotive market. This is because of the region's high rate of smart e-drive adoption and infrastructural upgrades. Due to fast technological advancements in the region, the automobile sector has been booming in the region, particularly in Germany, the United Kingdom, France, and Italy. Due to government subsidies on electric vehicles in the region, the smart e-drive market is expected to grow throughout the forecast period. Similarly, North America is also one of the major regions for the global market. Again, the market in the Asia Pacific is projected to rise at a considerable rate in the coming years. China, mainly, has contributed significantly to Asia-Pacific's leading market position. Countries such as India and Indonesia are anticipated to present several opportunities for growth of the market during the forecast period.
Smart e-Drive for Automotive Market, By Geography
· North America (US & Canada) · Europe (UK, Germany, France, Italy, Spain, Russia & Rest of Europe) · Asia-Pacific (Japan, China, India, Australia, & South Korea, & Rest of Asia-Pacific) · LAMEA (Brazil, Saudi Arabia, UAE & Rest of LAMEA)
Smart e-Drive for Automotive Market, Key Players
· Robert Bosch GmBH · ZF Friedrichshafen AG · Siemens AG · GKN PLC · Hitachi, Ltd. · Magna International Inc. · AISIN SEIKI Co., Ltd. · Continental AG · Schaeffler AG · SMR · Magnetic Systems Technology · ACTIA Group · BorgWarner · ABM Greiffenberger · AVL List Gmbh
Frequently Asked Questions (FAQ) :
Q1. What are the driving factors for the Smart e-Drive for Automotive market?
A. An increase in demand for hybrid and electric vehicles to reduce carbon emissions is a key factor that boosts the growth of the global Smart e-Drive for Automotive market.
Q2. What are the restraining factors for the Smart e-Drive for Automotive market?
A. stringent norms and restrictions established by numerous governments for the development and manufacture of electric vehicles have resulted in the production of electric vehicles in some countries, which is expected to limit the growth of the global smart e-drive for automotive market.
Q3. Which segment is projected to hold the largest share in the Smart e-Drive for Automotive Market?
A. The battery segment is projected to hold the largest share in the Smart e-Drive for Automotive Market.
Q4. Which region holds the largest share in the Smart e-Drive for Automotive market?
A. Europe holds the largest share in the Smart e-Drive for Automotive market.
Q5. Which are the prominent players in the Smart e-Drive for Automotive Market?
A. Robert Bosch GmBH, ZF Friedrichshafen AG, Siemens AG, GKN PLC, Hitachi, Ltd., Magna International Inc., AISIN SEIKI Co., Ltd., Continental AG, Schaeffler AG, SMR, Magnetic Systems Technology, ACTIA Group, BorgWarner, ABM Greiffenberger, AVL List Gmbh. are some key players in the Smart e-Drive for Automotive Market.
Smart e-Drive for Automotive Market Study Global Market Analysis, Insights and Forecast, 2020-2027
1. Introduction
1.1. Research Scope
1.2. Market Segmentation
1.3. Research Methodology
1.4. Definitions and Assumptions
2. Executive Summary
3. Market Dynamics
3.1. Market Drivers
3.2. Market Restraints
3.3. Market Opportunities
4. Key Insights
4.1. Key Emerging Trends – For Major Countries
4.2. Latest Technological Advancement
4.3. Regulatory Landscape
4.4. Industry SWOT Analysis
4.5. Porters Five Forces Analysis
5. Global Smart e-Drive for Automotive Market Analysis (USD Billion), Insights and Forecast, 2020-2027
5.1. Key Findings / Summary
5.2. Market Analysis, Insights and Forecast – By Component
5.2.1. Battery
5.2.2. Motor Generator
5.2.3. Power Electronics
5.2.4. E-Brake Booster
5.3. Market Analysis, Insights and Forecast – By Vehicle Type
5.3.1. Passenger Vehicle
5.3.1.1. Hatchback
5.3.1.2. Sedan
5.3.1.3. Utility Vehicles
5.3.2. Commercial Vehicle
5.3.3. Trucks
5.4. Market Analysis, Insights and Forecast – By Electric Vehicle Type
5.4.1. Battery Electric Vehicles
5.4.2. Plug-In Hybrid Electric vehicles
5.4.3. Hybrid Electric Vehicles
5.4.4. Electric Bus
5.5. Market Analysis, Insights and Forecast – By Drive Type
5.5.1. Front Wheel Drive
5.5.2. Rear Wheel Drive
5.5.3. Others
5.6. Market Analysis, Insights and Forecast – By Application
5.6.1. E-axle
5.6.2. Wheel Drive
5.7. Market Analysis, Insights and Forecast – By Battery Type
5.7.1. Lithium-ion
5.7.2. Nickel-based
5.7.3. Lead Acid and Solid State Battery
5.8. Market Analysis, Insights and Forecast – By Region
5.8.1. North America
5.8.2. Europe
5.8.3. Asia Pacific
5.8.4. Latin America, Middle East and Africa
6. North America Smart e-Drive for Automotive Market Analysis (USD Billion), Insights and Forecast, 2020-2027
6.1. Key Findings / Summary
6.2. Market Analysis, Insights and Forecast – By Component
6.2.1. Battery
6.2.2. Motor Generator
6.2.3. Power Electronics
6.2.4. E-Brake Booster
6.3. Market Analysis, Insights and Forecast – By Vehicle Type
6.3.1. Passenger Vehicle
6.3.1.1. Hatchback
6.3.1.2. Sedan
6.3.1.3. Utility Vehicles
6.3.2. Commercial Vehicle
6.3.3. Trucks
6.4. Market Analysis, Insights and Forecast – By Electric Vehicle Type
6.4.1. Battery Electric Vehicles
6.4.2. Plug-In Hybrid Electric vehicles
6.4.3. Hybrid Electric Vehicles
6.4.4. Electric Bus
6.5. Market Analysis, Insights and Forecast – By Drive Type
6.5.1. Front Wheel Drive
6.5.2. Rear Wheel Drive
6.5.3. Others
6.6. Market Analysis, Insights and Forecast – By Application
6.6.1. E-axle
6.6.2. Wheel Drive
6.7. Market Analysis, Insights and Forecast – By Battery Type
6.7.1. Lithium-ion
6.7.2. Nickel-based
6.7.3. Lead Acid and Solid State Battery
6.8. Market Analysis, Insights and Forecast – By Country
6.8.1. U.S.
6.8.2. Canada
7. Europe Smart e-Drive for Automotive Market Analysis (USD Billion), Insights and Forecast, 2020-2027
7.1. Key Findings / Summary
7.2. Market Analysis, Insights and Forecast – By Component
7.2.1. Battery
7.2.2. Motor Generator
7.2.3. Power Electronics
7.2.4. E-Brake Booster
7.3. Market Analysis, Insights and Forecast – By Vehicle Type
7.3.1. Passenger Vehicle
7.3.1.1. Hatchback
7.3.1.2. Sedan
7.3.1.3. Utility Vehicles
7.3.2. Commercial Vehicle
7.3.3. Trucks
7.4. Market Analysis, Insights and Forecast – By Electric Vehicle Type
7.4.1. Battery Electric Vehicles
7.4.2. Plug-In Hybrid Electric vehicles
7.4.3. Hybrid Electric Vehicles
7.4.4. Electric Bus
7.5. Market Analysis, Insights and Forecast – By Drive Type
7.5.1. Front Wheel Drive
7.5.2. Rear Wheel Drive
7.5.3. Others
7.6. Market Analysis, Insights and Forecast – By Application
7.6.1. E-axle
7.6.2. Wheel Drive
7.7. Market Analysis, Insights and Forecast – By Battery Type
7.7.1. Lithium-ion
7.7.2. Nickel-based
7.7.3. Lead Acid and Solid State Battery
7.8. Market Analysis, Insights and Forecast – By Country
7.8.1. UK
7.8.2. Germany
7.8.3. France
7.8.4. Italy
7.8.5. Spain
7.8.6. Russia
7.8.7. Rest of Europe
8. Asia Pacific Smart e-Drive for Automotive Market Analysis (USD Billion), Insights and Forecast, 2020-2027
8.1. Key Findings / Summary
8.2. Market Analysis, Insights and Forecast – By Component
8.2.1. Battery
8.2.2. Motor Generator
8.2.3. Power Electronics
8.2.4. E-Brake Booster
8.3. Market Analysis, Insights and Forecast – By Vehicle Type
8.3.1. Passenger Vehicle
8.3.1.1. Hatchback
8.3.1.2. Sedan
8.3.1.3. Utility Vehicles
8.3.2. Commercial Vehicle
8.3.3. Trucks
8.4. Market Analysis, Insights and Forecast – By Electric Vehicle Type
8.4.1. Battery Electric Vehicles
8.4.2. Plug-In Hybrid Electric vehicles
8.4.3. Hybrid Electric Vehicles
8.4.4. Electric Bus
8.5. Market Analysis, Insights and Forecast – By Drive Type
8.5.1. Front Wheel Drive
8.5.2. Rear Wheel Drive
8.5.3. Others
8.6. Market Analysis, Insights and Forecast – By Application
8.6.1. E-axle
8.6.2. Wheel Drive
8.7. Market Analysis, Insights and Forecast – By Battery Type
8.7.1. Lithium-ion
8.7.2. Nickel-based
8.7.3. Lead Acid and Solid State Battery
8.8. Market Analysis, Insights and Forecast – By Country
8.8.1. China
8.8.2. India
8.8.3. Japan
8.8.4. Australia
8.8.5. South East Asia
8.8.6. Rest of Asia Pacific
9. Latin America, Middle East and Africa Smart e-Drive for Automotive Market Analysis (USD Billion), Insights and Forecast, 2020-2027
9.1. Key Findings / Summary
9.2. Market Analysis, Insights and Forecast – By Component
9.2.1. Battery
9.2.2. Motor Generator
9.2.3. Power Electronics
9.2.4. E-Brake Booster
9.3. Market Analysis, Insights and Forecast – By Vehicle Type
9.3.1. Passenger Vehicle
9.3.1.1. Hatchback
9.3.1.2. Sedan
9.3.1.3. Utility Vehicles
9.3.2. Commercial Vehicle
9.3.3. Trucks
9.4. Market Analysis, Insights and Forecast – By Electric Vehicle Type
9.4.1. Battery Electric Vehicles
9.4.2. Plug-In Hybrid Electric vehicles
9.4.3. Hybrid Electric Vehicles
9.4.4. Electric Bus
9.5. Market Analysis, Insights and Forecast – By Drive Type
9.5.1. Front Wheel Drive
9.5.2. Rear Wheel Drive
9.5.3. Others
9.6. Market Analysis, Insights and Forecast – By Application
9.6.1. E-axle
9.6.2. Wheel Drive
9.7. Market Analysis, Insights and Forecast – By Battery Type
9.7.1. Lithium-ion
9.7.2. Nickel-based
9.7.3. Lead Acid and Solid State Battery
9.8. Market Analysis, Insights and Forecast – By Country
9.8.1. Brazil
9.8.2. Saudi Arabia
9.8.3. UAE
9.8.4. Rest of LAMEA
10. Competitive Analysis
10.1. Company Market Share Analysis, 2018
10.2. Key Industry Developments
10.3. Company Profile
10.4. Robert Bosch GmBH
10.4.1. Business Overview
10.4.2. Segment 1 & Service Offering
10.4.3. Overall Revenue
10.4.4. Geographic Presence
10.4.5. Recent Development
*Similar details will be provided for the following companies
10.5. ZF Friedrichshafen AG
10.6. Siemens AG
10.7. GKN PLC
10.8. Hitachi, Ltd.
10.9. Magna International Inc.
10.10. AISIN SEIKI Co., Ltd.
10.11. Continental AG
10.12. Schaeffler AG
10.13. SMR
10.14. Magnetic Systems Technology
10.15. ACTIA Group
10.16. BorgWarner
10.17. ABM Greiffenberger
List of Figures
Figure 1: Global Smart E-drive for Automotive Market Revenue Breakdown (USD Billion, %) by Region, 2019 & 2027
Figure 2: Global Market Value Share (%), By Segment 1, 2019 & 2027
Figure 3: Global Market Forecast (USD Billion), by Sub-Segment 1, 2016-2027
Figure 4: Global Market Forecast (USD Billion), by Sub-Segment 2, 2016-2027
Figure 5: Global Market Value Share (%), By Segment 2, 2019 & 2027
Figure 6: Global Market Forecast (USD Billion), by Sub-Segment 1, 2016-2027
Figure 7: Global Market Forecast (USD Billion), by Sub-Segment 2, 2016-2027
Figure 8: Global Market Forecast (USD Billion), by Sub-Segment 3, 2016-2027
Figure 9: Global Smart E-drive for Automotive Market Forecast (USD Billion), by Others, 2016-2027
Figure 10: Global Market Value Share (%), By Segment 3, 2019 & 2027
Figure 11: Global Market Forecast (USD Billion), by Sub-Segment 1, 2016-2027
Figure 12: Global Market Forecast (USD Billion), by Sub-Segment 2, 2016-2027
Figure 13: Global Market Forecast (USD Billion), by Sub-Segment 3, 2016-2027
Figure 14: Global Market Forecast (USD Billion), by Others, 2016-2027
Figure 15: Global Market Value (USD Billion), by Region, 2019 & 2027
Figure 16: North America Smart E-drive for Automotive Market Value Share (%), By Segment 1, 2019 & 2027
Figure 17: North America Market Forecast (USD Billion), by Sub-Segment 1, 2016-2027
Figure 18: North America Market Forecast (USD Billion), by Sub-Segment 2, 2016-2027
Figure 19: North America Market Value Share (%), By Segment 2, 2019 & 2027
Figure 20: North America Market Forecast (USD Billion), by Sub-Segment 1, 2016-2027
Figure 21: North America Market Forecast (USD Billion), by Sub-Segment 2, 2016-2027
Figure 22: North America Market Forecast (USD Billion), by Sub-Segment 3, 2016-2027
Figure 23: North America Market Forecast (USD Billion), by Others, 2016-2027
Figure 24: North America Market Value Share (%), By Segment 3, 2019 & 2027
Figure 25: North America Market Forecast (USD Billion), by Sub-Segment 1, 2016-2027
Figure 26: North America Market Forecast (USD Billion), by Sub-Segment 2, 2016-2027
Figure 27: North America Market Forecast (USD Billion), by Sub-Segment 3, 2016-2027
Figure 28: North America Market Forecast (USD Billion), by Others, 2016-2027
Figure 29: North America Market Forecast (USD Billion), by U.S., 2016-2027
Figure 30: North America Market Forecast (USD Billion), by Canada, 2016-2027
Figure 31: Latin America Smart E-drive for Automotive Market Value Share (%), By Segment 1, 2019 & 2027
Figure 32: Latin America Market Forecast (USD Billion), by Sub-Segment 1, 2016-2027
Figure 33: Latin America Market Forecast (USD Billion), by Sub-Segment 2, 2016-2027
Figure 34: Latin America Market Value Share (%), By Segment 2, 2019 & 2027
Figure 35: Latin America Market Forecast (USD Billion), by Sub-Segment 1, 2016-2027
Figure 36: Latin America Market Forecast (USD Billion), by Sub-Segment 2, 2016-2027
Figure 37: Latin America Market Forecast (USD Billion), by Sub-Segment 3, 2016-2027
Figure 38: Latin America Market Forecast (USD Billion), by Others, 2016-2027
Figure 39: Latin America Market Value Share (%), By Segment 3, 2019 & 2027
Figure 40: Latin America Market Forecast (USD Billion), by Sub-Segment 1, 2016-2027
Figure 41: Latin America Market Forecast (USD Billion), by Sub-Segment 2, 2016-2027
Figure 42: Latin America Market Forecast (USD Billion), by Sub-Segment 3, 2016-2027
Figure 43: Latin America Market Forecast (USD Billion), by Others, 2016-2027
Figure 44: Latin America Market Forecast (USD Billion), by Brazil, 2016-2027
Figure 45: Latin America Market Forecast (USD Billion), by Mexico, 2016-2027
Figure 46: Latin America Market Forecast (USD Billion), by Rest of Latin America, 2016-2027
Figure 47: Europe Smart E-drive for Automotive Market Value Share (%), By Segment 1, 2019 & 2027
Figure 48: Europe Market Forecast (USD Billion), by Sub-Segment 1, 2016-2027
Figure 49: Europe Market Forecast (USD Billion), by Sub-Segment 2, 2016-2027
Figure 50: Europe Market Value Share (%), By Segment 2, 2019 & 2027
Figure 51: Europe Market Forecast (USD Billion), by Sub-Segment 1, 2016-2027
Figure 52: Europe Market Forecast (USD Billion), by Sub-Segment 2, 2016-2027
Figure 53: Europe Market Forecast (USD Billion), by Sub-Segment 3, 2016-2027
Figure 54: Europe Market Forecast (USD Billion), by Others, 2016-2027
Figure 55: Europe Market Value Share (%), By Segment 3, 2019 & 2027
Figure 56: Europe Market Forecast (USD Billion), by Sub-Segment 1, 2016-2027
Figure 57: Europe Market Forecast (USD Billion), by Sub-Segment 2, 2016-2027
Figure 58: Europe Market Forecast (USD Billion), by Sub-Segment 3, 2016-2027
Figure 59: Europe Market Forecast (USD Billion), by Others, 2016-2027
Figure 60: Europe Market Forecast (USD Billion), by U.K., 2016-2027
Figure 61: Europe Market Forecast (USD Billion), by Germany, 2016-2027
Figure 62: Europe Market Forecast (USD Billion), by France, 2016-2027
Figure 63: Europe Market Forecast (USD Billion), by Italy, 2016-2027
Figure 64: Europe Market Forecast (USD Billion), by Spain, 2016-2027
Figure 65: Europe Market Forecast (USD Billion), by Russia, 2016-2027
Figure 66: Europe Market Forecast (USD Billion), by Rest of Europe, 2016-2027
Figure 67: Asia Pacific Smart E-drive for Automotive Market Value Share (%), By Segment 1, 2019 & 2027
Figure 68: Asia Pacific Market Forecast (USD Billion), by Sub-Segment 1, 2016-2027
Figure 69: Asia Pacific Market Forecast (USD Billion), by Sub-Segment 2, 2016-2027
Figure 70: Asia Pacific Market Value Share (%), By Segment 2, 2019 & 2027
Figure 71: Asia Pacific Market Forecast (USD Billion), by Sub-Segment 1, 2016-2027
Figure 72: Asia Pacific Market Forecast (USD Billion), by Sub-Segment 2, 2016-2027
Figure 73: Asia Pacific Market Forecast (USD Billion), by Sub-Segment 3, 2016-2027
Figure 74: Asia Pacific Market Forecast (USD Billion), by Others, 2016-2027
Figure 75: Asia Pacific Market Value Share (%), By Segment 3, 2019 & 2027
Figure 76: Asia Pacific Market Forecast (USD Billion), by Sub-Segment 1, 2016-2027
Figure 77: Asia Pacific Market Forecast (USD Billion), by Sub-Segment 2, 2016-2027
Figure 78: Asia Pacific Market Forecast (USD Billion), by Sub-Segment 3, 2016-2027
Figure 79: Asia Pacific Market Forecast (USD Billion), by Others, 2016-2027
Figure 80: Asia Pacific Market Forecast (USD Billion), by China, 2016-2027
Figure 81: Asia Pacific Market Forecast (USD Billion), by India, 2016-2027
Figure 82: Asia Pacific Market Forecast (USD Billion), by Japan, 2016-2027
Figure 83: Asia Pacific Market Forecast (USD Billion), by Australia, 2016-2027
Figure 84: Asia Pacific Market Forecast (USD Billion), by Southeast Asia, 2016-2027
Figure 85: Asia Pacific Market Forecast (USD Billion), by Rest of Asia Pacific, 2016-2027
Figure 86: Middle East & Africa Smart E-drive for Automotive Market Value Share (%), By Segment 1, 2019 & 2027
Figure 87: Middle East & Africa Market Forecast (USD Billion), by Sub-Segment 1, 2016-2027
Figure 88: Middle East & Africa Market Forecast (USD Billion), by Sub-Segment 2, 2016-2027
Figure 89: Middle East & Africa Market Value Share (%), By Segment 2, 2019 & 2027
Figure 90: Middle East & Africa Market Forecast (USD Billion), by Sub-Segment 1, 2016-2027
Figure 91: Middle East & Africa Market Forecast (USD Billion), by Sub-Segment 2, 2016-2027
Figure 92: Middle East & Africa Market Forecast (USD Billion), by Sub-Segment 3, 2016-2027
Figure 93: Middle East & Africa Market Forecast (USD Billion), by Others, 2016-2027
Figure 94: Middle East & Africa Market Value Share (%), By Segment 3, 2019 & 2027
Figure 95: Middle East & Africa Market Forecast (USD Billion), by Sub-Segment 1, 2016-2027
Figure 96: Middle East & Africa Market Forecast (USD Billion), by Sub-Segment 2, 2016-2027
Figure 97: Middle East & Africa Market Forecast (USD Billion), by Sub-Segment 3, 2016-2027
Figure 98: Middle East & Africa Market Forecast (USD Billion), by Others, 2016-2027
Figure 99: Middle East & Africa Market Forecast (USD Billion), by GCC, 2016-2027
Figure 100: Middle East & Africa Market Forecast (USD Billion), by South Africa, 2016-2027
Figure 101: Middle East & Africa Market Forecast (USD Billion), by Rest of Middle East & Africa, 2016-2027
List of Tables
Table 1: Global Smart E-drive for Automotive Market Revenue (USD Billion) Forecast, by Segment 1, 2016-2027
Table 2: Global Market Revenue (USD Billion) Forecast, by Segment 2, 2016-2027
Table 3: Global Market Revenue (USD Billion) Forecast, by Segment 3, 2016-2027
Table 4: Global Market Revenue (USD Billion) Forecast, by Region, 2016-2027
Table 5: North America Smart E-drive for Automotive Market Revenue (USD Billion) Forecast, by Segment 1, 2016-2027
Table 6: North America Market Revenue (USD Billion) Forecast, by Segment 2, 2016-2027
Table 7: North America Market Revenue (USD Billion) Forecast, by Segment 3, 2016-2027
Table 8: North America Market Revenue (USD Billion) Forecast, by Country, 2016-2027
Table 9: Europe Smart E-drive for Automotive Market Revenue (USD Billion) Forecast, by Segment 1, 2016-2027
Table 10: Europe Market Revenue (USD Billion) Forecast, by Segment 2, 2016-2027
Table 11: Europe Market Revenue (USD Billion) Forecast, by Segment 3, 2016-2027
Table 12: Europe Market Revenue (USD Billion) Forecast, by Country, 2016-2027
Table 13: Latin America Smart E-drive for Automotive Market Revenue (USD Billion) Forecast, by Segment 1, 2016-2027
Table 14: Latin America Market Revenue (USD Billion) Forecast, by Segment 2, 2016-2027
Table 15: Latin America Market Revenue (USD Billion) Forecast, by Segment 3, 2016-2027
Table 16: Latin America Market Revenue (USD Billion) Forecast, by Country, 2016-2027
Table 17: Asia Pacific Smart E-drive for Automotive Market Revenue (USD Billion) Forecast, by Segment 1, 2016-2027
Table 18: Asia Pacific Market Revenue (USD Billion) Forecast, by Segment 2, 2016-2027
Table 19: Asia Pacific Market Revenue (USD Billion) Forecast, by Segment 3, 2016-2027
Table 20: Asia Pacific Market Revenue (USD Billion) Forecast, by Country, 2016-2027
Table 21: Middle East & Africa Smart E-drive for Automotive Market Revenue (USD Billion) Forecast, by Segment 1, 2016-2027
Table 22: Middle East & Africa Market Revenue (USD Billion) Forecast, by Segment 2, 2016-2027
Table 23: Middle East & Africa Market Revenue (USD Billion) Forecast, by Segment 3, 2016-2027
Table 24: Middle East & Africa Market Revenue (USD Billion) Forecast, by Country, 2016-2027