Electric Capacitors Market Overview and Analysis

The global electric capacitor market was valued at USD 25.3 billion in 2025 and is estimated to grow at a CAGR of 10.4% from 2025 to 2032, reaching USD 37.87 billion 2032.

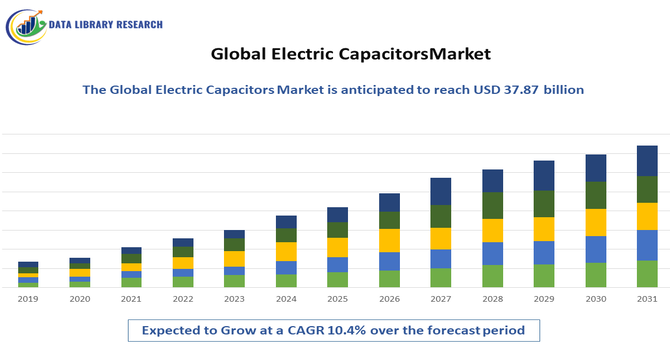
The global electric capacitors market encompasses the production and sale of components that store and release electrical energy in circuits. Driven by demand from consumer electronics, automotive, and renewable energy sectors, the market includes various types—ceramic, electrolytic, and film capacitors—offering performance, reliability, and energy efficiency across applications.

The electric capacitors market is primarily driven by the rapid growth of consumer electronics, electric vehicles, and renewable energy systems, which require efficient energy storage and power management solutions. Rising demand for miniaturized, high-performance capacitors in smartphones, laptops, and industrial automation, along with advancements in capacitor materials and technologies, further propels market growth.

Electric Capacitors Market Latest Trends

The electric capacitors market is witnessing trends such as the adoption of high-capacitance, low-equivalent series resistance (ESR) capacitors, and the integration of advanced dielectric materials like ceramic, tantalum, and polymer. Increasing miniaturization and energy-efficient designs are shaping component selection, while applications in electric vehicles, renewable energy storage, consumer electronics, and IoT devices are driving demand for specialized, high-performance capacitors. Additionally, manufacturers are focusing on improving reliability, thermal stability, and lifecycle performance to meet evolving industry standards and enhance integration into compact, high-frequency electronic circuits.

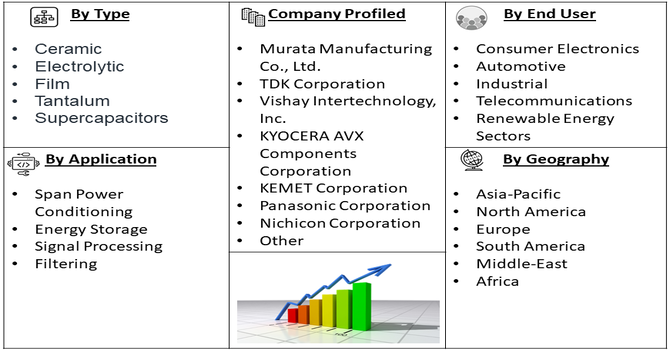
Segmentation: The Global Electric Capacitor Market is segmented based on Type (Ceramic, Electrolytic, Film, Tantalum, and Supercapacitors), Applications (Span Power Conditioning, Energy Storage, Signal Processing, and Filtering), End-Users (Consumer Electronics, Automotive, Industrial, Telecommunications, and Renewable Energy Sectors) and Geography (North America, Europe, Asia-Pacific, Middle East and Africa, and South America). The report provides the value (in USD million) for the above segments.

Market Drivers:

  • Growing Demand in Electric Vehicles and Renewable Energy Applications

The rising adoption of electric vehicles (EVs) and renewable energy systems has significantly fueled the demand for high-performance capacitors. Electric vehicles require capacitors for power management, voltage stabilization, and fast energy storage to ensure efficient battery operation and reduced charging times. Similarly, renewable energy installations, including solar and wind power systems, rely on capacitors for energy conversion, storage, and grid stabilization. The push for greener energy solutions, government incentives for EV adoption, and increasing consumer awareness regarding sustainable technologies have all contributed to this trend. Consequently, manufacturers are investing in advanced ceramic and electrolytic capacitors capable of withstanding higher voltages and temperatures, further accelerating market growth globally.

  • Technological Advancements in Capacitor Materials and Designs

Continuous innovations in capacitor technology, such as multilayer ceramic capacitors (MLCCs), polymeric film capacitors, and high-energy-density supercapacitors, have driven market expansion. Advances in material science, including doping, nanostructures, and hybrid composites, have improved capacitance, voltage tolerance, and operational longevity. Manufacturers are also developing compact, high-performance capacitors suitable for miniaturized electronics, aerospace, and industrial automation. These innovations enable higher efficiency, reduced heat generation, and better reliability in high-frequency and high-power applications. As industries demand smaller yet more powerful components, technological progress in capacitor design supports their integration across consumer electronics, automotive, and renewable energy sectors, propelling the global electric capacitors market forward.

Market Restraints:

  • Volatility in Raw Material Prices and Supply Chain Challenges

Fluctuating costs of essential raw materials, including tantalum, aluminum, and specialty ceramics, pose significant challenges for capacitor manufacturers. Sudden price increases affect production costs and profitability, particularly for high-performance capacitors requiring rare or engineered materials. Additionally, global supply chain disruptions, such as semiconductor shortages, logistics delays, and geopolitical tensions, further complicate procurement and production schedules. These uncertainties hinder consistent manufacturing, slow product launches, and may lead end-users to seek alternative technologies. The combined effect of raw material volatility and supply chain instability restrains market growth, particularly for small and medium-scale capacitor producers dependent on steady, cost-effective material supply.

Socio Economic Impact on Electric Capacitors Market

The global electric capacitors market has had a significant socioeconomic impact by enabling advancements in consumer electronics, electric vehicles, renewable energy, and industrial automation, driving technological progress and efficiency. Increased adoption of high-performance capacitors supports sustainable energy solutions, reduces carbon emissions, and enhances power reliability. The market has also created employment opportunities in manufacturing, R&D, and distribution, while fostering innovation in emerging economies. Improved electronic infrastructure enhances productivity across industries, contributing to economic growth and supporting societal shifts toward cleaner, energy-efficient technologies worldwide.

Segmental Analysis:

  • Ceramic segment is expected to witness highest growth over the forecast period

The ceramic capacitor segment dominated the electric capacitors market due to its high stability, low loss, and reliability in high-frequency applications. These capacitors are widely used in automotive electronics, consumer electronics, and industrial machinery for power filtering, energy storage, and decoupling purposes. Increasing demand for miniaturized and high-performance electronic devices, coupled with their long service life and ability to withstand extreme temperatures, has driven significant adoption. Technological advancements in multi-layer ceramic capacitors (MLCCs) have further enhanced capacitance density and efficiency. As electronic devices continue to become more compact and complex, ceramic capacitors are expected to witness the highest growth over the forecast period, reinforcing their critical role in modern electronics.

  • Span Power Conditioning segment is expected to witness highest growth over the forecast period

The power conditioning application segment is anticipated to lead growth in the electric capacitors market due to the increasing demand for efficient energy management and stable power supply. Capacitors play a vital role in maintaining voltage stability, filtering harmonics, and improving power factor in renewable energy systems, industrial machinery, and data centers. The rise in renewable energy adoption, including solar and wind energy, has created the need for capacitors capable of handling fluctuating loads and stabilizing electrical networks. Furthermore, smart grid initiatives and energy storage systems rely heavily on capacitors for efficient energy flow. As industries and utilities seek sustainable and reliable power solutions, the power conditioning segment is poised for significant expansion.

  • Consumer Electronics segment is expected to witness highest growth over the forecast period

The consumer electronics end-user segment is expected to drive substantial growth in the electric capacitors market due to the rapid proliferation of smartphones, tablets, laptops, wearable devices, and smart home products. Capacitors are critical in these devices for energy storage, filtering, decoupling, and voltage stabilization, ensuring optimal performance and longevity. Increasing consumer preference for high-performance, miniaturized, and energy-efficient devices is boosting demand for advanced capacitor technologies, particularly multi-layer ceramic capacitors (MLCCs). Moreover, rising disposable income and technology adoption in emerging economies further fuel market growth. With continuous innovations in electronics and increasing reliance on portable and connected devices, consumer electronics will remain a dominant end-user segment throughout the forecast period.

  • Asia Pacific region is expected to witness highest growth over the forecast period

The Asia Pacific region is projected to witness the highest growth in the electric capacitors market due to rapid industrialization, urbanization, and increasing electronics manufacturing in countries such as China, Japan, South Korea, and India. The region serves as a global hub for consumer electronics, automotive, and renewable energy production, driving strong demand for high-performance capacitors. Government initiatives to promote smart infrastructure, electric vehicles, and renewable energy projects further support market expansion.

Additionally, the presence of key capacitor manufacturers and ongoing R&D in advanced technologies enhances product availability and innovation. For instance, in September 2025, SK Keyfoundry, an 8-inch pure-play foundry in Korea, launched its Multi-Level Thick IMD process for capacitors, enabling up to three stacked inter-metal dielectric layers with a total thickness of 18 μm. The process achieved high breakdown voltage of 19,000 V and improved capacitance, enhancing device safety, reliability, and noise immunity. This innovation strengthened capacitor performance, driving adoption in digital isolation and electronic circuits, and is expected to boost growth in the Asia Pacific electric capacitors market.

Also, all above factors coupled with growing industrial automation and rising adoption of electronic devices among consumers are expected to sustain robust market growth in Asia Pacific.

Electric Capacitors Market Competitive Landscape

The global electric capacitor market is highly competitive, characterized by the presence of major multinational manufacturers and innovative regional players. Key companies focus on continuous R&D, product innovation, and strategic partnerships to strengthen their market positions. Industry leaders like Murata Manufacturing, TDK Corporation, KEMET Corporation, Panasonic Corporation, and Vishay Intertechnology emphasize advanced capacitor technologies such as multi-layer ceramic capacitors (MLCCs), high-voltage film capacitors, and energy-efficient solutions. Companies also adopt mergers, acquisitions, and geographic expansion strategies to enhance production capabilities and meet growing demand across automotive, consumer electronics, industrial, and renewable energy sectors. The competitive environment encourages technological advancement, product differentiation, and cost optimization to capture market share.

The 20 major players for above market are:

  • Murata Manufacturing Co., Ltd.
  • TDK Corporation
  • Vishay Intertechnology, Inc.
  • KYOCERA AVX Components Corporation
  • KEMET Corporation
  • Panasonic Corporation
  • Nichicon Corporation
  • Samsung Electro Mechanics Co., Ltd.
  • Taiyo Yuden Co., Ltd.
  • Rubycon Corporation
  • Nippon Chemi Con Corporation
  • Cornell Dubilier Electronics, Inc.
  • Illinois Capacitor Inc.
  • Yageo Corporation
  • Walsin Technology Corporation
  • EPCOS AG
  • ELNA Co., Ltd.
  • Maxwell Technologies, Inc.
  • Hitachi AIC, Inc.
  • Eaton Corporation PLC

Recent Development

  • In July 2025, Ministry of Science and Technology, reported that Indian scientists from Bengaluru, in collaboration with Aligarh Muslim University, developed a next-generation supercapacitor material by doping silver niobate (AgNbO₃) nanoparticles with lanthanum. This reduced particle size, increased surface area, and enhanced electrical conductivity, enabling faster charge-discharge cycles. The material achieved 118% capacity retention and 100% coulombic efficiency after extensive use. This breakthrough is expected to drive demand for high-performance supercapacitors, boosting innovation and adoption in the Global Electric Capacitors Market.


  • In January 2025, TDK Corporation expanded its CGA and C series multilayer ceramic capacitors (MLCCs) to 10 nF at 1,250 V in 3225 size with C0G characteristics, achieving the industry’s highest capacitance for this voltage and size. These high-voltage, temperature-stable capacitors supported SiC MOSFET circuits, reduced series MLCCs, minimized heat generation, and enabled space-saving designs. Mass production began in December 2024. This innovation is expected to drive adoption of high-performance MLCCs, boosting growth in the Global Electric Capacitors Market.


Frequently Asked Questions (FAQ) :

Q1. What are the main growth-driving factors for this market?

The electric capacitors market is primarily driven by the massive expansion of the consumer electronics industry and the global shift toward automotive electrification (EVs). The demand for smaller, more functional devices, like smartphones and IoT gadgets, necessitates compact, high-performance capacitors. For EVs, high-voltage capacitors are critical for energy management in inverters and battery systems. Furthermore, advancements in 5G technology and the integration of renewable energy sources require reliable capacitor solutions for power stability and filtering.

Q2. What are the main restraining factors for this market?

The market faces significant restraints primarily related to the supply chain and cost. Volatile prices of raw materials, such as nickel, palladium, and specialized ceramic powders, lead to high and fluctuating production costs for manufacturers. Additionally, traditional capacitors have a lower energy density compared to batteries, limiting their application as primary energy sources in long-duration devices. Global supply chain disruptions can also cause material shortages and delays, impacting market stability.

Q3. Which segment is expected to witness high growth?

The Supercapacitors/Electric Double-Layer Capacitors (EDLCs) segment is projected to witness the highest growth. This is due to their exceptional power density, fast charge/discharge capabilities, and long cycle life, making them ideal for applications requiring quick bursts of power. By end-use, the Automotive sector, driven by the increasing production of electric and hybrid vehicles which utilize thousands of high-performance capacitors for power electronics, will continue its exponential demand.

Q4. Who are the top major players for this market?

The global market is dominated by large, established Asian and European component manufacturers. Top major players include Japanese giants Murata Manufacturing Co., Ltd., TDK Corporation, and Taiyo Yuden Co., Ltd.; South Korean conglomerate Samsung Electro-Mechanics Co., Ltd.; and key players like Kyocera AVX Components Corporation (formerly AVX/KEMET). These companies are leaders in Multilayer Ceramic Capacitors (MLCCs) and constantly invest in miniaturization technology.

Q5. Which country is the largest player?

The Asia-Pacific region holds the largest market share globally, primarily driven by China. China dominates due to its status as the world's largest manufacturing hub for consumer electronics, coupled with massive government and private investment in electric vehicle production and advanced telecommunications (5G). The strong regional presence of major capacitor manufacturers in China, Japan, and South Korea further solidifies APAC's leading position in terms of both production and consumption.

Electric Capacitors MARKET STUDY GLOBAL MARKET ANALYSIS, INSIGHTS AND FORECAST, 2022-2029

    1. Introduction

    • 1.1. Research Scope
    • 1.2. Market Segmentation
    • 1.3. Research Methodology
    • 1.4. Definitions and Assumptions

    2. Executive Summary

      3. Market Dynamics

      • 3.1. Market Drivers
      • 3.2. Market Restraints
      • 3.3. Market Opportunities

      4. Key Insights

      • 4.1. Key Emerging Trends – For Major Countries
      • 4.2. Latest Technological Advancement
      • 4.3. Regulatory Landscape
      • 4.4. Industry SWOT Analysis
      • 4.5. Porters Five Forces Analysis

      5. Global Electric Capacitors Market Analysis (USD Billion), Insights and Forecast, 2018-2029

      • 5.1. Key Findings / Summary
      • 5.2. Market Analysis, Insights and Forecast – By Segment 1
        • 5.2.1. Sub-Segment 1
        • 5.2.2. Sub-Segment 2
      • 5.3. Market Analysis, Insights and Forecast – By Segment 2
        • 5.3.1. Sub-Segment 1
        • 5.3.2. Sub-Segment 2
        • 5.3.3. Sub-Segment 3
        • 5.3.4. Others
      • 5.4. Market Analysis, Insights and Forecast – By Segment 3
        • 5.4.1. Sub-Segment 1
        • 5.4.2. Sub-Segment 2
        • 5.4.3. Sub-Segment 3
        • 5.4.4. Others
      • 5.5. Market Analysis, Insights and Forecast – By Region
        • 5.5.1. North America
        • 5.5.2. Latin America
        • 5.5.3. Europe
        • 5.5.4. Asia Pacific
        • 5.5.5. Middle East and Africa

      6. North America Electric Capacitors Market Analysis (USD Billion), Insights and Forecast, 2018-2029

      • 6.1. Key Findings / Summary
      • 6.2. Market Analysis, Insights and Forecast – By Segment 1
        • 6.2.1. Sub-Segment 1
        • 6.2.2. Sub-Segment 2
      • 6.3. Market Analysis, Insights and Forecast – By Segment 2
        • 6.3.1. Sub-Segment 1
        • 6.3.2. Sub-Segment 2
        • 6.3.3. Sub-Segment 3
        • 6.3.4. Others
      • 6.4. Market Analysis, Insights and Forecast – By Segment 3
        • 6.4.1. Sub-Segment 1
        • 6.4.2. Sub-Segment 2
        • 6.4.3. Sub-Segment 3
        • 6.4.4. Others
      • 6.5. Market Analysis, Insights and Forecast – By Country
        • 6.5.1. U.S.
        • 6.5.2. Canada

      7. Latin America Electric Capacitors Market Analysis (USD Billion), Insights and Forecast, 2018-2029

      • 7.1. Key Findings / Summary
      • 7.2. Market Analysis, Insights and Forecast – By Segment 1
        • 7.2.1. Sub-Segment 1
        • 7.2.2. Sub-Segment 2
      • 7.3. Market Analysis, Insights and Forecast – By Segment 2
        • 7.3.1. Sub-Segment 1
        • 7.3.2. Sub-Segment 2
        • 7.3.3. Sub-Segment 3
        • 7.3.4. Others
      • 7.4. Market Analysis, Insights and Forecast – By Segment 3
        • 7.4.1. Sub-Segment 1
        • 7.4.2. Sub-Segment 2
        • 7.4.3. Sub-Segment 3
        • 7.4.4. Others
      • 7.5. Insights and Forecast – By Country
        • 7.5.1. Brazil
        • 7.5.2. Mexico
        • 7.5.3. Rest of Latin America

      8. Europe Electric Capacitors Market Analysis (USD Billion), Insights and Forecast, 2018-2029

      • 8.1. Key Findings / Summary
      • 8.2. Market Analysis, Insights and Forecast – By Segment 1
        • 8.2.1. Sub-Segment 1
        • 8.2.2. Sub-Segment 2
      • 8.3. Market Analysis, Insights and Forecast – By Segment 2
        • 8.3.1. Sub-Segment 1
        • 8.3.2. Sub-Segment 2
        • 8.3.3. Sub-Segment 3
        • 8.3.4. Others
      • 8.4. Market Analysis, Insights and Forecast – By Segment 3
        • 8.4.1. Sub-Segment 1
        • 8.4.2. Sub-Segment 2
        • 8.4.3. Sub-Segment 3
        • 8.4.4. Others
      • 8.5. Market Analysis, Insights and Forecast – By Country
        • 8.5.1. UK
        • 8.5.2. Germany
        • 8.5.3. France
        • 8.5.4. Italy
        • 8.5.5. Spain
        • 8.5.6. Russia
        • 8.5.7. Rest of Europe

      9. Asia Pacific Electric Capacitors Market Analysis (USD Billion), Insights and Forecast, 2018-2029

      • 9.1. Key Findings / Summary
      • 9.2. Market Analysis, Insights and Forecast – By Segment 1
        • 9.2.1. Sub-Segment 1
        • 9.2.2. Sub-Segment 2
      • 9.3. Market Analysis, Insights and Forecast – By Segment 2
        • 9.3.1. Sub-Segment 1
        • 9.3.2. Sub-Segment 2
        • 9.3.3. Sub-Segment 3
        • 9.3.4. Others
      • 9.4. Market Analysis, Insights and Forecast – By Segment 3
        • 9.4.1. Sub-Segment 1
        • 9.4.2. Sub-Segment 2
        • 9.4.3. Sub-Segment 3
        • 9.4.4. Others
      • 9.5. Market Analysis, Insights and Forecast – By Country
        • 9.5.1. China
        • 9.5.2. India
        • 9.5.3. Japan
        • 9.5.4. Australia
        • 9.5.5. South East Asia
        • 9.5.6. Rest of Asia Pacific

      10. Middle East & Africa Electric Capacitors Market Analysis (USD Billion), Insights and Forecast, 2018-2029

      • 10.1. Key Findings / Summary
      • 10.2. Market Analysis, Insights and Forecast – By Segment 1
        • 10.2.1. Sub-Segment 1
        • 10.2.2. Sub-Segment 2
      • 10.3. Market Analysis, Insights and Forecast – By Segment 2
        • 10.3.1. Sub-Segment 1
        • 10.3.2. Sub-Segment 2
        • 10.3.3. Sub-Segment 3
        • 10.3.4. Others
      • 10.4. Market Analysis, Insights and Forecast – By Segment 3
        • 10.4.1. Sub-Segment 1
        • 10.4.2. Sub-Segment 2
        • 10.4.3. Sub-Segment 3
        • 10.4.4. Others
      • 10.5. Market Analysis, Insights and Forecast – By Country
        • 10.5.1. GCC
        • 10.5.2. South Africa
        • 10.5.3. Rest of Middle East & Africa

      11. Competitive Analysis

      • 11.1. Company Market Share Analysis, 2018
      • 11.2. Key Industry Developments
      • 11.3. Company Profile
        • 11.3.1. Company 1
          • 11.3.1.1. Business Overview
          • 11.3.1.2. Segment 1 & Service Offering
          • 11.3.1.3. Overall Revenue
          • 11.3.1.4. Geographic Presence
          • 11.3.1.5. Recent Development
        *Similar details will be provided for the following companies
        • 11.3.2. Company 2
        • 11.3.3. Company 3
        • 11.3.4. Company 4
        • 11.3.5. Company 5
        • 11.3.6. Company 6
        • 11.3.7. Company 7
        • 11.3.8. Company 8
        • 11.3.9. Company 9
        • 11.3.10. Company 10
        • 11.3.11. Company 11
        • 11.3.12. Company 12
      List of Figures

      Figure 1: Global Electric Capacitors Market Revenue Breakdown (USD Billion, %) by Region, 2022 & 2029
      Figure 2: Global Electric Capacitors Market Value Share (%), By Segment 1, 2022 & 2029
      Figure 3: Global Electric Capacitors Market Forecast (USD Billion), by Sub-Segment 1, 2018-2029
      Figure 4: Global Electric Capacitors Market Forecast (USD Billion), by Sub-Segment 2, 2018-2029
      Figure 5: Global Electric Capacitors Market Value Share (%), By Segment 2, 2022 & 2029
      Figure 6: Global Electric Capacitors Market Forecast (USD Billion), by Sub-Segment 1, 2018-2029
      Figure 7: Global Electric Capacitors Market Forecast (USD Billion), by Sub-Segment 2, 2018-2029
      Figure 8: Global Electric Capacitors Market Forecast (USD Billion), by Sub-Segment 3, 2018-2029
      Figure 9: Global Electric Capacitors Market Forecast (USD Billion), by Others, 2018-2029
      Figure 10: Global Electric Capacitors Market Value Share (%), By Segment 3, 2022 & 2029
      Figure 11: Global Electric Capacitors Market Forecast (USD Billion), by Sub-Segment 1, 2018-2029
      Figure 12: Global Electric Capacitors Market Forecast (USD Billion), by Sub-Segment 2, 2018-2029
      Figure 13: Global Electric Capacitors Market Forecast (USD Billion), by Sub-Segment 3, 2018-2029
      Figure 14: Global Electric Capacitors Market Forecast (USD Billion), by Others, 2018-2029
      Figure 15: Global Electric Capacitors Market Value (USD Billion), by Region, 2022 & 2029
      Figure 16: North America Electric Capacitors Market Value Share (%), By Segment 1, 2022 & 2029
      Figure 17: North America Electric Capacitors Market Forecast (USD Billion), by Sub-Segment 1, 2018-2029
      Figure 18: North America Electric Capacitors Market Forecast (USD Billion), by Sub-Segment 2, 2018-2029
      Figure 19: North America Electric Capacitors Market Value Share (%), By Segment 2, 2022 & 2029
      Figure 20: North America Electric Capacitors Market Forecast (USD Billion), by Sub-Segment 1, 2018-2029
      Figure 21: North America Electric Capacitors Market Forecast (USD Billion), by Sub-Segment 2, 2018-2029
      Figure 22: North America Electric Capacitors Market Forecast (USD Billion), by Sub-Segment 3, 2018-2029
      Figure 23: North America Electric Capacitors Market Forecast (USD Billion), by Others, 2018-2029
      Figure 24: North America Electric Capacitors Market Value Share (%), By Segment 3, 2022 & 2029
      Figure 25: North America Electric Capacitors Market Forecast (USD Billion), by Sub-Segment 1, 2018-2029
      Figure 26: North America Electric Capacitors Market Forecast (USD Billion), by Sub-Segment 2, 2018-2029
      Figure 27: North America Electric Capacitors Market Forecast (USD Billion), by Sub-Segment 3, 2018-2029
      Figure 28: North America Electric Capacitors Market Forecast (USD Billion), by Others, 2018-2029
      Figure 29: North America Electric Capacitors Market Forecast (USD Billion), by U.S., 2018-2029
      Figure 30: North America Electric Capacitors Market Forecast (USD Billion), by Canada, 2018-2029
      Figure 31: Latin America Electric Capacitors Market Value Share (%), By Segment 1, 2022 & 2029
      Figure 32: Latin America Electric Capacitors Market Forecast (USD Billion), by Sub-Segment 1, 2018-2029
      Figure 33: Latin America Electric Capacitors Market Forecast (USD Billion), by Sub-Segment 2, 2018-2029
      Figure 34: Latin America Electric Capacitors Market Value Share (%), By Segment 2, 2022 & 2029
      Figure 35: Latin America Electric Capacitors Market Forecast (USD Billion), by Sub-Segment 1, 2018-2029
      Figure 36: Latin America Electric Capacitors Market Forecast (USD Billion), by Sub-Segment 2, 2018-2029
      Figure 37: Latin America Electric Capacitors Market Forecast (USD Billion), by Sub-Segment 3, 2018-2029
      Figure 38: Latin America Electric Capacitors Market Forecast (USD Billion), by Others, 2018-2029
      Figure 39: Latin America Electric Capacitors Market Value Share (%), By Segment 3, 2022 & 2029
      Figure 40: Latin America Electric Capacitors Market Forecast (USD Billion), by Sub-Segment 1, 2018-2029
      Figure 41: Latin America Electric Capacitors Market Forecast (USD Billion), by Sub-Segment 2, 2018-2029
      Figure 42: Latin America Electric Capacitors Market Forecast (USD Billion), by Sub-Segment 3, 2018-2029
      Figure 43: Latin America Electric Capacitors Market Forecast (USD Billion), by Others, 2018-2029
      Figure 44: Latin America Electric Capacitors Market Forecast (USD Billion), by Brazil, 2018-2029
      Figure 45: Latin America Electric Capacitors Market Forecast (USD Billion), by Mexico, 2018-2029
      Figure 46: Latin America Electric Capacitors Market Forecast (USD Billion), by Rest of Latin America, 2018-2029
      Figure 47: Europe Electric Capacitors Market Value Share (%), By Segment 1, 2022 & 2029
      Figure 48: Europe Electric Capacitors Market Forecast (USD Billion), by Sub-Segment 1, 2018-2029
      Figure 49: Europe Electric Capacitors Market Forecast (USD Billion), by Sub-Segment 2, 2018-2029
      Figure 50: Europe Electric Capacitors Market Value Share (%), By Segment 2, 2022 & 2029
      Figure 51: Europe Electric Capacitors Market Forecast (USD Billion), by Sub-Segment 1, 2018-2029
      Figure 52: Europe Electric Capacitors Market Forecast (USD Billion), by Sub-Segment 2, 2018-2029
      Figure 53: Europe Electric Capacitors Market Forecast (USD Billion), by Sub-Segment 3, 2018-2029
      Figure 54: Europe Electric Capacitors Market Forecast (USD Billion), by Others, 2018-2029
      Figure 55: Europe Electric Capacitors Market Value Share (%), By Segment 3, 2022 & 2029
      Figure 56: Europe Electric Capacitors Market Forecast (USD Billion), by Sub-Segment 1, 2018-2029
      Figure 57: Europe Electric Capacitors Market Forecast (USD Billion), by Sub-Segment 2, 2018-2029
      Figure 58: Europe Electric Capacitors Market Forecast (USD Billion), by Sub-Segment 3, 2018-2029
      Figure 59: Europe Electric Capacitors Market Forecast (USD Billion), by Others, 2018-2029
      Figure 60: Europe Electric Capacitors Market Forecast (USD Billion), by U.K., 2018-2029
      Figure 61: Europe Electric Capacitors Market Forecast (USD Billion), by Germany, 2018-2029
      Figure 62: Europe Electric Capacitors Market Forecast (USD Billion), by France, 2018-2029
      Figure 63: Europe Electric Capacitors Market Forecast (USD Billion), by Italy, 2018-2029
      Figure 64: Europe Electric Capacitors Market Forecast (USD Billion), by Spain, 2018-2029
      Figure 65: Europe Electric Capacitors Market Forecast (USD Billion), by Russia, 2018-2029
      Figure 66: Europe Electric Capacitors Market Forecast (USD Billion), by Rest of Europe, 2018-2029
      Figure 67: Asia Pacific Electric Capacitors Market Value Share (%), By Segment 1, 2022 & 2029
      Figure 68: Asia Pacific Electric Capacitors Market Forecast (USD Billion), by Sub-Segment 1, 2018-2029
      Figure 69: Asia Pacific Electric Capacitors Market Forecast (USD Billion), by Sub-Segment 2, 2018-2029
      Figure 70: Asia Pacific Electric Capacitors Market Value Share (%), By Segment 2, 2022 & 2029
      Figure 71: Asia Pacific Electric Capacitors Market Forecast (USD Billion), by Sub-Segment 1, 2018-2029
      Figure 72: Asia Pacific Electric Capacitors Market Forecast (USD Billion), by Sub-Segment 2, 2018-2029
      Figure 73: Asia Pacific Electric Capacitors Market Forecast (USD Billion), by Sub-Segment 3, 2018-2029
      Figure 74: Asia Pacific Electric Capacitors Market Forecast (USD Billion), by Others, 2018-2029
      Figure 75: Asia Pacific Electric Capacitors Market Value Share (%), By Segment 3, 2022 & 2029
      Figure 76: Asia Pacific Electric Capacitors Market Forecast (USD Billion), by Sub-Segment 1, 2018-2029
      Figure 77: Asia Pacific Electric Capacitors Market Forecast (USD Billion), by Sub-Segment 2, 2018-2029
      Figure 78: Asia Pacific Electric Capacitors Market Forecast (USD Billion), by Sub-Segment 3, 2018-2029
      Figure 79: Asia Pacific Electric Capacitors Market Forecast (USD Billion), by Others, 2018-2029
      Figure 80: Asia Pacific Electric Capacitors Market Forecast (USD Billion), by China, 2018-2029
      Figure 81: Asia Pacific Electric Capacitors Market Forecast (USD Billion), by India, 2018-2029
      Figure 82: Asia Pacific Electric Capacitors Market Forecast (USD Billion), by Japan, 2018-2029
      Figure 83: Asia Pacific Electric Capacitors Market Forecast (USD Billion), by Australia, 2018-2029
      Figure 84: Asia Pacific Electric Capacitors Market Forecast (USD Billion), by Southeast Asia, 2018-2029
      Figure 85: Asia Pacific Electric Capacitors Market Forecast (USD Billion), by Rest of Asia Pacific, 2018-2029
      Figure 86: Middle East & Africa Electric Capacitors Market Value Share (%), By Segment 1, 2022 & 2029
      Figure 87: Middle East & Africa Electric Capacitors Market Forecast (USD Billion), by Sub-Segment 1, 2018-2029
      Figure 88: Middle East & Africa Electric Capacitors Market Forecast (USD Billion), by Sub-Segment 2, 2018-2029
      Figure 89: Middle East & Africa Electric Capacitors Market Value Share (%), By Segment 2, 2022 & 2029
      Figure 90: Middle East & Africa Electric Capacitors Market Forecast (USD Billion), by Sub-Segment 1, 2018-2029
      Figure 91: Middle East & Africa Electric Capacitors Market Forecast (USD Billion), by Sub-Segment 2, 2018-2029
      Figure 92: Middle East & Africa Electric Capacitors Market Forecast (USD Billion), by Sub-Segment 3, 2018-2029
      Figure 93: Middle East & Africa Electric Capacitors Market Forecast (USD Billion), by Others, 2018-2029
      Figure 94: Middle East & Africa Electric Capacitors Market Value Share (%), By Segment 3, 2022 & 2029
      Figure 95: Middle East & Africa Electric Capacitors Market Forecast (USD Billion), by Sub-Segment 1, 2018-2029
      Figure 96: Middle East & Africa Electric Capacitors Market Forecast (USD Billion), by Sub-Segment 2, 2018-2029
      Figure 97: Middle East & Africa Electric Capacitors Market Forecast (USD Billion), by Sub-Segment 3, 2018-2029
      Figure 98: Middle East & Africa Electric Capacitors Market Forecast (USD Billion), by Others, 2018-2029
      Figure 99: Middle East & Africa Electric Capacitors Market Forecast (USD Billion), by GCC, 2018-2029
      Figure 100: Middle East & Africa Electric Capacitors Market Forecast (USD Billion), by South Africa, 2018-2029
      Figure 101: Middle East & Africa Electric Capacitors Market Forecast (USD Billion), by Rest of Middle East & Africa, 2018-2029 
      List of Tables
      Table 1: Global Electric Capacitors Market Revenue (USD Billion) Forecast, by Segment 1, 2018-2029
      Table 2: Global Electric Capacitors Market Revenue (USD Billion) Forecast, by Segment 2, 2018-2029
      Table 3: Global Electric Capacitors Market Revenue (USD Billion) Forecast, by Segment 3, 2018-2029
      Table 4: Global Electric Capacitors Market Revenue (USD Billion) Forecast, by Region, 2018-2029
      Table 5: North America Electric Capacitors Market Revenue (USD Billion) Forecast, by Segment 1, 2018-2029
      Table 6: North America Electric Capacitors Market Revenue (USD Billion) Forecast, by Segment 2, 2018-2029
      Table 7: North America Electric Capacitors Market Revenue (USD Billion) Forecast, by Segment 3, 2018-2029
      Table 8: North America Electric Capacitors Market Revenue (USD Billion) Forecast, by Country, 2018-2029
      Table 9: Europe Electric Capacitors Market Revenue (USD Billion) Forecast, by Segment 1, 2018-2029
      Table 10: Europe Electric Capacitors Market Revenue (USD Billion) Forecast, by Segment 2, 2018-2029
      Table 11: Europe Electric Capacitors Market Revenue (USD Billion) Forecast, by Segment 3, 2018-2029
      Table 12: Europe Electric Capacitors Market Revenue (USD Billion) Forecast, by Country, 2018-2029
      Table 13: Latin America Electric Capacitors Market Revenue (USD Billion) Forecast, by Segment 1, 2018-2029
      Table 14: Latin America Electric Capacitors Market Revenue (USD Billion) Forecast, by Segment 2, 2018-2029
      Table 15: Latin America Electric Capacitors Market Revenue (USD Billion) Forecast, by Segment 3, 2018-2029
      Table 16: Latin America Electric Capacitors Market Revenue (USD Billion) Forecast, by Country, 2018-2029
      Table 17: Asia Pacific Electric Capacitors Market Revenue (USD Billion) Forecast, by Segment 1, 2018-2029
      Table 18: Asia Pacific Electric Capacitors Market Revenue (USD Billion) Forecast, by Segment 2, 2018-2029
      Table 19: Asia Pacific Electric Capacitors Market Revenue (USD Billion) Forecast, by Segment 3, 2018-2029
      Table 20: Asia Pacific Electric Capacitors Market Revenue (USD Billion) Forecast, by Country, 2018-2029
      Table 21: Middle East & Africa Electric Capacitors Market Revenue (USD Billion) Forecast, by Segment 1, 2018-2029
      Table 22: Middle East & Africa Electric Capacitors Market Revenue (USD Billion) Forecast, by Segment 2, 2018-2029
      Table 23: Middle East & Africa Electric Capacitors Market Revenue (USD Billion) Forecast, by Segment 3, 2018-2029
      Table 24: Middle East & Africa Electric Capacitors Market Revenue (USD Billion) Forecast, by Country, 2018-2029
      Research Process

      Data Library Research are conducted by industry experts who offer insight on industry structure, market segmentations technology assessment and competitive landscape (CL), and penetration, as well as on emerging trends. Their analysis is based on primary interviews (~ 80%) and secondary research (~ 20%) as well as years of professional expertise in their respective industries. Adding to this, by analysing historical trends and current market positions, our analysts predict where the market will be headed for the next five years. Furthermore, the varying trends of segment & categories geographically presented are also studied and the estimated based on the primary & secondary research.

      In this particular report from the supply side Data Library Research has conducted primary surveys (interviews) with the key level executives (VP, CEO’s, Marketing Director, Business Development Manager and SOFT) of the companies that active & prominent as well as the midsized organization

      FIGURE 1: DLR RESEARH PROCESS

      research-methodology1

      Primary Research

      Extensive primary research was conducted to gain a deeper insight of the market and industry performance. The analysis is based on both primary and secondary research as well as years of professional expertise in the respective industries.

      In addition to analysing current and historical trends, our analysts predict where the market is headed over the next five years.

      It varies by segment for these categories geographically presented in the list of market tables. Speaking about this particular report we have conducted primary surveys (interviews) with the key level executives (VP, CEO’s, Marketing Director, Business Development Manager and many more) of the major players active in the market.

      Secondary Research

      Secondary research was mainly used to collect and identify information useful for the extensive, technical, market-oriented, and Friend’s study of the Global Extra Neutral Alcohol. It was also used to obtain key information about major players, market classification and segmentation according to the industry trends, geographical markets, and developments related to the market and technology perspectives. For this study, analysts have gathered information from various credible sources, such as annual reports, sec filings, journals, white papers, SOFT presentations, and company web sites.

      Market Size Estimation

      Both, top-down and bottom-up approaches were used to estimate and validate the size of the Global market and to estimate the size of various other dependent submarkets in the overall Extra Neutral Alcohol. The key players in the market were identified through secondary research and their market contributions in the respective geographies were determined through primary and secondary research.

      Forecast Model

      research-methodology2

      Happy to Assist You

      If you have a question?

      info@datalibraryresearch.com

      IND : +91 955 279 0357

      Browse Related Reports