Electric Hydrofoil Water Taxi Market Overview and Analysis
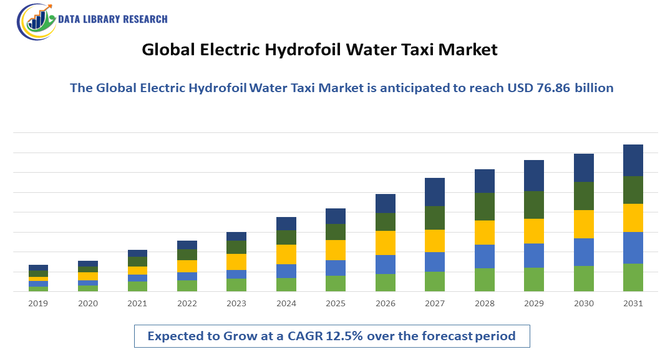
- The Global Electric Hydrofoil Water Taxi Market was estimated at USD 46.8 million in 2025, and forecasts indicate a robust 12.5% CAGR from 2025-2032, reaching USD 76.86 billion in 2032.
Get Complete Analysis Of The Report - Download Updated Free Sample PDF
The Global Electric Hydrofoil Water Taxi Market is experiencing rapid growth as cities and coastal regions seek sustainable, high-performance alternatives to conventional marine transport. Electric hydrofoil water taxis lift above the water using hydrofoil technology, reducing drag and enabling faster, quieter, and energy-efficient operations. Growing environmental awareness, stricter emission regulations, and the push for zero-emission urban mobility are driving adoption in metropolitan waterways, tourism hubs, and urban waterfronts.
Electric Hydrofoil Water Taxi Market Latest Trends
The electric hydrofoil water-taxi market is increasingly being driven by the global push toward sustainability and eco-friendly urban mobility, as cities and coastal areas look to reduce emissions, noise pollution, and congestion by replacing diesel-powered ferries with zero-emission electric hydrofoil taxis. Alongside this, rapid technological advancements — especially in battery technology, electric propulsion systems, and hydrofoil design — are making these water taxis more practical: higher energy density batteries, improved charging infrastructure, and more efficient foils allow for longer ranges, faster speeds, and greater energy efficiency than earlier generations.
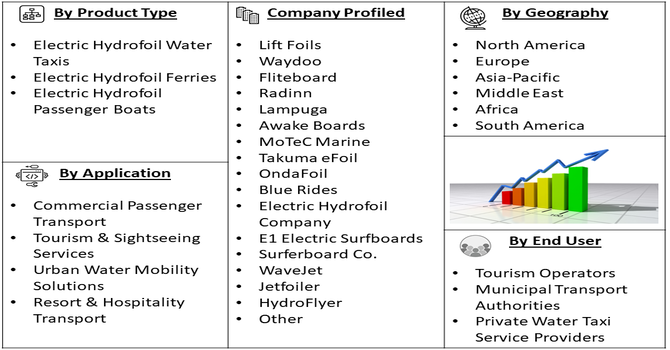
Segmentation: Global Electric Hydrofoil Water Taxi Market is segmented by Type (Electric Hydrofoil Water Taxis, Electric Hydrofoil Ferries, Electric Hydrofoil Passenger Boats), Material (Carbon Fiber, Fiberglass, Composite Materials), Application (Commercial Passenger Transport, Tourism & Sightseeing Services, Urban Water Mobility Solutions, Resort & Hospitality Transport), End User (Tourism Operators, Municipal Transport Authorities, Private Water Taxi Service Providers), and Geography (North America, Europe, Asia-Pacific, Middle East and Africa, and South America). The report provides the value (in USD million) for the above segments.
For Detailed Market Segmentation - Get a Free Sample PDF
Market Drivers:
- Rising Demand for Sustainable Urban Mobility
Urban waterways are facing pressure to reduce emissions, noise, and environmental impact. Electric hydrofoil water taxis provide a sustainable alternative to diesel or fuel-powered ferries, meeting regulatory requirements and supporting eco-friendly transport initiatives. For instance, in June 2024, the launch of the ‘Meri Bus, Meri Sadak’ initiative, supported by USAID and CEEW, highlighted India’s growing focus on cleaner, more efficient urban mobility. Rising demand for electric buses and strong emissions-reduction goals demonstrated the shift toward sustainable transport. This progress strengthened global momentum for low-emission mobility solutions, indirectly supporting adoption and investment in the global electric hydrofoil water taxi market.
- Technological Advancements in Batteries and Hydrofoil Design
Improved battery efficiency, lightweight composites, and intelligent stabilization systems are enhancing operational range, speed, and safety, making electric hydrofoil taxis a viable option for commercial passenger transport in urban waterways and tourism hotspots. For instance, in January 2023, the Candela C-8, powered by Polestar batteries, demonstrated a major technological leap in electric hydrofoil design, offering extended range and high-speed performance previously limited to combustion engine boats. This breakthrough in battery integration and vessel efficiency advanced electrification at sea, accelerating innovation and boosting adoption in the global electric hydrofoil water taxi market.
Market Restraints:
- Limited Battery Range and Charging Infrastructure
Another key restraint is the limited operational range of electric hydrofoils and the underdeveloped charging infrastructure in many regions. Although battery technologies have advanced significantly, electric hydrofoils still have lower endurance compared to fuel-powered boats, which can be a concern for commercial operators, tourism services, or long-distance water transport. Charging stations for marine electric vehicles are sparse, especially in developing countries and remote coastal areas, making it challenging to deploy electric hydrofoils for extended operations. In addition, long charging times and the need for specialized connectors or charging systems can reduce operational efficiency. These limitations on range and infrastructure hinder widespread adoption and restrict market growth in areas where reliable energy access is a concern.
Segmental Analysis:
- Electric Hydrofoil Water Taxis segment is expected to witness the highest growth over the forecast period
Electric Hydrofoil Water Taxis represent the leading segment as cities increasingly adopt them for short-distance public transport and commuter mobility along rivers, lakes, and coastal routes. Their ability to reduce drag by lifting above the water improves speed and energy efficiency while offering a smoother ride, making them ideal for high-frequency transport services. Rising interest in zero-emission urban mobility and smart transport integration is further accelerating demand for this segment.
- Carbon Fiber segment is expected to witness the highest growth over the forecast period
Carbon Fiber dominates the material segment due to its exceptional strength-to-weight ratio, which is critical for hydrofoil performance. Lightweight carbon fiber reduces the overall mass of the water taxi, enabling faster lift, greater stability, and improved battery efficiency. Its durability and corrosion resistance also extend the operational lifespan of hydrofoil vessels, making it the preferred material for next-generation electric water taxis.
- Commercial Passenger Transport segment is expected to witness the highest growth over the forecast period
Commercial Passenger Transport remains the most significant application segment as electric hydrofoil taxis are increasingly utilized for daily commuting, inter-city water routes, and short-distance ferry services. Their reduced environmental impact, minimal wake, and lower noise levels make them ideal for urban waterways. Governments and private operators are adopting these vessels to modernize water transport networks and meet sustainability goals.
- Municipal Transport Authorities segment is expected to witness the highest growth over the forecast period
Municipal Transport Authorities are the major end users, driven by the global push toward eco-friendly public transportation. Cities are integrating electric hydrofoil taxis into broader mobility networks to ease road congestion, reduce emissions, and enhance waterway connectivity. Public investments, pilot programs, and green mobility initiatives are contributing to the strong uptake of hydrofoil water taxis in urban transport fleets.
- North America segment is expected to witness the highest growth over the forecast period
North America leads the market due to significant advancements in marine electrification, robust infrastructure for waterway transport, and strong regulatory support for low-emission mobility solutions. The region has seen rapid adoption of electric hydrofoil taxis in cities and coastal areas, supported by technology innovators and sustainability-focused transport policies. For instance, in 2022, Artemis Technologies’ high-speed, zero-emission EF-24 ferries demonstrated how advanced foiling efficiency, long range, and low operating costs could reshape commercial water transport. Their minimal wake and smoother ride highlighted clear passenger benefits. These innovations strengthened confidence in next-generation electric vessels, positively influencing North America’s electric hydrofoil water taxi market and supporting faster regional adoption.
High tourism activity and investments in smart mobility projects further strengthen the region’s dominance. For instance, the WTTC’s 2024 report showing the U.S. as the world’s strongest travel and tourism market, generating a record USD 2.36 trillion, reinforced global confidence in advanced mobility solutions. High tourism activity and rising investment in smart transport projects strengthened demand for efficient water transport, positively influencing the global electric hydrofoil water taxi market and further solidifying North America’s regional leadership.
Thus, such factors together are driving the growth of this marker in this region.
| Report Matrics |
Details |
| Market Size Value |
USD 76.86 billion |
| Growth Rate |
CAGR of 12.5% |
| Forecast |
2026-2033 |
| Historical data |
2021-2024 |
| Base Year |
2025 |
| Report Coverage |
Forecasted revenue, company rating, competitive environment, growth drivers, and trends |
| Segment Coverage |
Type, Application, End-User, Geography |
| Regional Scope |
North America, Europe, Asia Pacific, Middle East |
| Customized scope |
Free customization of reports (With 3 months Analysis Support ) |
| To Learn More About This Report |
Request a Free Sample Copy |
Electric Hydrofoil Water Taxi Market Competitive Landscape
The Global Electric Hydrofoil Water Taxi Market is highly competitive, with players focusing on technological innovation, partnerships with municipalities and tourism operators, and expansion into emerging urban waterways. Companies are emphasizing enhanced battery technology, hydrofoil efficiency, passenger safety, and integration with smart urban mobility networks to differentiate themselves.
Key Companies:
- Lift Foils
- Waydoo
- Fliteboard
- Radinn
- Lampuga
- Awake Boards
- MoTeC Marine
- Takuma eFoil
- OndaFoil
- Blue Rides
- Electric Hydrofoil Company
- E1 Electric Surfboards
- Surferboard Co.
- WaveJet
- Jetfoiler
- HydroFlyer
- Waterblade eFoil
- FoilBoard Innovations
- SeaBird Electric
- eFoil World
Recent Development
- In October 2024, the launch of Stockholm’s electric foiling ship “Nova,” the first Candela P-12 in service, showcased a major leap in fast, energy-efficient urban water transport. Its ability to cut commute times and reduce energy use by 80% demonstrated the practicality of hydrofoil technology, accelerating global interest, investment, and adoption in the electric hydrofoil water taxi market.
- In July 2024, ABB’s contract to supply propulsion systems for Washington State Ferries’ new hybrid electric vessels demonstrated growing confidence in advanced electric maritime technology. This progress supported broader industry momentum toward cleaner, high-efficiency transport solutions, indirectly boosting innovation, investment, and adoption in the global electric hydrofoil water taxi market by validating scalable hybrid-electric propulsion capabilities.
Frequently Asked Questions (FAQ) :
Q1. What are the main growth-driving factors for this market?
The market is growing quickly because urban traffic congestion in coastal cities is getting worse, pushing demand for fast water transport. Also, strong government interest in sustainable, zero-emission transportation solutions is driving new investments and subsidies for electric marine technologies, making hydrofoils an attractive, green option.
Q2. What are the main restraining factors for this market?
The high initial purchase cost of electric hydrofoil water taxis, which use specialized materials and advanced technology, is a key barrier. Additionally, the widespread adoption is limited by a lack of necessary infrastructure, such as dedicated docking stations and fast-charging points, especially in developing metropolitan areas.
Q3. Which segment is expected to witness high growth?
The Commercial Passenger Transport segment is expected to witness the highest growth. This involves large-scale fleet operations for daily commuters and tourists. As electric hydrofoils offer faster travel times, better efficiency, and a smoother ride than traditional ferries, cities are increasingly adopting them for public transit networks.
Q4. Who are the top major players for this market?
The market is led by companies focused purely on electric hydrofoil innovation. Key players include Candela Technology AB, a Swedish pioneer known for their C-8 model, along with companies like SeaBubble and Navier Mobility. These companies are rapidly developing high-speed, long-range electric vessels for commercial use.
Q5. Which country is the largest player?
North America, driven by the United States and Canada, currently holds the largest revenue share in the market. This is due to existing government support for green marine technology and severe congestion in coastal hubs like New York and Seattle, which are actively exploring and implementing water taxi solutions.
List of Figures
Figure 1: Global Electric Hydrofoil Water Taxi Market Revenue Breakdown (USD Billion, %) by Region, 2022 & 2029
Figure 2: Global Electric Hydrofoil Water Taxi Market Value Share (%), By Segment 1, 2022 & 2029
Figure 3: Global Electric Hydrofoil Water Taxi Market Forecast (USD Billion), by Sub-Segment 1, 2018-2029
Figure 4: Global Electric Hydrofoil Water Taxi Market Forecast (USD Billion), by Sub-Segment 2, 2018-2029
Figure 5: Global Electric Hydrofoil Water Taxi Market Value Share (%), By Segment 2, 2022 & 2029
Figure 6: Global Electric Hydrofoil Water Taxi Market Forecast (USD Billion), by Sub-Segment 1, 2018-2029
Figure 7: Global Electric Hydrofoil Water Taxi Market Forecast (USD Billion), by Sub-Segment 2, 2018-2029
Figure 8: Global Electric Hydrofoil Water Taxi Market Forecast (USD Billion), by Sub-Segment 3, 2018-2029
Figure 9: Global Electric Hydrofoil Water Taxi Market Forecast (USD Billion), by Others, 2018-2029
Figure 10: Global Electric Hydrofoil Water Taxi Market Value Share (%), By Segment 3, 2022 & 2029
Figure 11: Global Electric Hydrofoil Water Taxi Market Forecast (USD Billion), by Sub-Segment 1, 2018-2029
Figure 12: Global Electric Hydrofoil Water Taxi Market Forecast (USD Billion), by Sub-Segment 2, 2018-2029
Figure 13: Global Electric Hydrofoil Water Taxi Market Forecast (USD Billion), by Sub-Segment 3, 2018-2029
Figure 14: Global Electric Hydrofoil Water Taxi Market Forecast (USD Billion), by Others, 2018-2029
Figure 15: Global Electric Hydrofoil Water Taxi Market Value (USD Billion), by Region, 2022 & 2029
Figure 16: North America Electric Hydrofoil Water Taxi Market Value Share (%), By Segment 1, 2022 & 2029
Figure 17: North America Electric Hydrofoil Water Taxi Market Forecast (USD Billion), by Sub-Segment 1, 2018-2029
Figure 18: North America Electric Hydrofoil Water Taxi Market Forecast (USD Billion), by Sub-Segment 2, 2018-2029
Figure 19: North America Electric Hydrofoil Water Taxi Market Value Share (%), By Segment 2, 2022 & 2029
Figure 20: North America Electric Hydrofoil Water Taxi Market Forecast (USD Billion), by Sub-Segment 1, 2018-2029
Figure 21: North America Electric Hydrofoil Water Taxi Market Forecast (USD Billion), by Sub-Segment 2, 2018-2029
Figure 22: North America Electric Hydrofoil Water Taxi Market Forecast (USD Billion), by Sub-Segment 3, 2018-2029
Figure 23: North America Electric Hydrofoil Water Taxi Market Forecast (USD Billion), by Others, 2018-2029
Figure 24: North America Electric Hydrofoil Water Taxi Market Value Share (%), By Segment 3, 2022 & 2029
Figure 25: North America Electric Hydrofoil Water Taxi Market Forecast (USD Billion), by Sub-Segment 1, 2018-2029
Figure 26: North America Electric Hydrofoil Water Taxi Market Forecast (USD Billion), by Sub-Segment 2, 2018-2029
Figure 27: North America Electric Hydrofoil Water Taxi Market Forecast (USD Billion), by Sub-Segment 3, 2018-2029
Figure 28: North America Electric Hydrofoil Water Taxi Market Forecast (USD Billion), by Others, 2018-2029
Figure 29: North America Electric Hydrofoil Water Taxi Market Forecast (USD Billion), by U.S., 2018-2029
Figure 30: North America Electric Hydrofoil Water Taxi Market Forecast (USD Billion), by Canada, 2018-2029
Figure 31: Latin America Electric Hydrofoil Water Taxi Market Value Share (%), By Segment 1, 2022 & 2029
Figure 32: Latin America Electric Hydrofoil Water Taxi Market Forecast (USD Billion), by Sub-Segment 1, 2018-2029
Figure 33: Latin America Electric Hydrofoil Water Taxi Market Forecast (USD Billion), by Sub-Segment 2, 2018-2029
Figure 34: Latin America Electric Hydrofoil Water Taxi Market Value Share (%), By Segment 2, 2022 & 2029
Figure 35: Latin America Electric Hydrofoil Water Taxi Market Forecast (USD Billion), by Sub-Segment 1, 2018-2029
Figure 36: Latin America Electric Hydrofoil Water Taxi Market Forecast (USD Billion), by Sub-Segment 2, 2018-2029
Figure 37: Latin America Electric Hydrofoil Water Taxi Market Forecast (USD Billion), by Sub-Segment 3, 2018-2029
Figure 38: Latin America Electric Hydrofoil Water Taxi Market Forecast (USD Billion), by Others, 2018-2029
Figure 39: Latin America Electric Hydrofoil Water Taxi Market Value Share (%), By Segment 3, 2022 & 2029
Figure 40: Latin America Electric Hydrofoil Water Taxi Market Forecast (USD Billion), by Sub-Segment 1, 2018-2029
Figure 41: Latin America Electric Hydrofoil Water Taxi Market Forecast (USD Billion), by Sub-Segment 2, 2018-2029
Figure 42: Latin America Electric Hydrofoil Water Taxi Market Forecast (USD Billion), by Sub-Segment 3, 2018-2029
Figure 43: Latin America Electric Hydrofoil Water Taxi Market Forecast (USD Billion), by Others, 2018-2029
Figure 44: Latin America Electric Hydrofoil Water Taxi Market Forecast (USD Billion), by Brazil, 2018-2029
Figure 45: Latin America Electric Hydrofoil Water Taxi Market Forecast (USD Billion), by Mexico, 2018-2029
Figure 46: Latin America Electric Hydrofoil Water Taxi Market Forecast (USD Billion), by Rest of Latin America, 2018-2029
Figure 47: Europe Electric Hydrofoil Water Taxi Market Value Share (%), By Segment 1, 2022 & 2029
Figure 48: Europe Electric Hydrofoil Water Taxi Market Forecast (USD Billion), by Sub-Segment 1, 2018-2029
Figure 49: Europe Electric Hydrofoil Water Taxi Market Forecast (USD Billion), by Sub-Segment 2, 2018-2029
Figure 50: Europe Electric Hydrofoil Water Taxi Market Value Share (%), By Segment 2, 2022 & 2029
Figure 51: Europe Electric Hydrofoil Water Taxi Market Forecast (USD Billion), by Sub-Segment 1, 2018-2029
Figure 52: Europe Electric Hydrofoil Water Taxi Market Forecast (USD Billion), by Sub-Segment 2, 2018-2029
Figure 53: Europe Electric Hydrofoil Water Taxi Market Forecast (USD Billion), by Sub-Segment 3, 2018-2029
Figure 54: Europe Electric Hydrofoil Water Taxi Market Forecast (USD Billion), by Others, 2018-2029
Figure 55: Europe Electric Hydrofoil Water Taxi Market Value Share (%), By Segment 3, 2022 & 2029
Figure 56: Europe Electric Hydrofoil Water Taxi Market Forecast (USD Billion), by Sub-Segment 1, 2018-2029
Figure 57: Europe Electric Hydrofoil Water Taxi Market Forecast (USD Billion), by Sub-Segment 2, 2018-2029
Figure 58: Europe Electric Hydrofoil Water Taxi Market Forecast (USD Billion), by Sub-Segment 3, 2018-2029
Figure 59: Europe Electric Hydrofoil Water Taxi Market Forecast (USD Billion), by Others, 2018-2029
Figure 60: Europe Electric Hydrofoil Water Taxi Market Forecast (USD Billion), by U.K., 2018-2029
Figure 61: Europe Electric Hydrofoil Water Taxi Market Forecast (USD Billion), by Germany, 2018-2029
Figure 62: Europe Electric Hydrofoil Water Taxi Market Forecast (USD Billion), by France, 2018-2029
Figure 63: Europe Electric Hydrofoil Water Taxi Market Forecast (USD Billion), by Italy, 2018-2029
Figure 64: Europe Electric Hydrofoil Water Taxi Market Forecast (USD Billion), by Spain, 2018-2029
Figure 65: Europe Electric Hydrofoil Water Taxi Market Forecast (USD Billion), by Russia, 2018-2029
Figure 66: Europe Electric Hydrofoil Water Taxi Market Forecast (USD Billion), by Rest of Europe, 2018-2029
Figure 67: Asia Pacific Electric Hydrofoil Water Taxi Market Value Share (%), By Segment 1, 2022 & 2029
Figure 68: Asia Pacific Electric Hydrofoil Water Taxi Market Forecast (USD Billion), by Sub-Segment 1, 2018-2029
Figure 69: Asia Pacific Electric Hydrofoil Water Taxi Market Forecast (USD Billion), by Sub-Segment 2, 2018-2029
Figure 70: Asia Pacific Electric Hydrofoil Water Taxi Market Value Share (%), By Segment 2, 2022 & 2029
Figure 71: Asia Pacific Electric Hydrofoil Water Taxi Market Forecast (USD Billion), by Sub-Segment 1, 2018-2029
Figure 72: Asia Pacific Electric Hydrofoil Water Taxi Market Forecast (USD Billion), by Sub-Segment 2, 2018-2029
Figure 73: Asia Pacific Electric Hydrofoil Water Taxi Market Forecast (USD Billion), by Sub-Segment 3, 2018-2029
Figure 74: Asia Pacific Electric Hydrofoil Water Taxi Market Forecast (USD Billion), by Others, 2018-2029
Figure 75: Asia Pacific Electric Hydrofoil Water Taxi Market Value Share (%), By Segment 3, 2022 & 2029
Figure 76: Asia Pacific Electric Hydrofoil Water Taxi Market Forecast (USD Billion), by Sub-Segment 1, 2018-2029
Figure 77: Asia Pacific Electric Hydrofoil Water Taxi Market Forecast (USD Billion), by Sub-Segment 2, 2018-2029
Figure 78: Asia Pacific Electric Hydrofoil Water Taxi Market Forecast (USD Billion), by Sub-Segment 3, 2018-2029
Figure 79: Asia Pacific Electric Hydrofoil Water Taxi Market Forecast (USD Billion), by Others, 2018-2029
Figure 80: Asia Pacific Electric Hydrofoil Water Taxi Market Forecast (USD Billion), by China, 2018-2029
Figure 81: Asia Pacific Electric Hydrofoil Water Taxi Market Forecast (USD Billion), by India, 2018-2029
Figure 82: Asia Pacific Electric Hydrofoil Water Taxi Market Forecast (USD Billion), by Japan, 2018-2029
Figure 83: Asia Pacific Electric Hydrofoil Water Taxi Market Forecast (USD Billion), by Australia, 2018-2029
Figure 84: Asia Pacific Electric Hydrofoil Water Taxi Market Forecast (USD Billion), by Southeast Asia, 2018-2029
Figure 85: Asia Pacific Electric Hydrofoil Water Taxi Market Forecast (USD Billion), by Rest of Asia Pacific, 2018-2029
Figure 86: Middle East & Africa Electric Hydrofoil Water Taxi Market Value Share (%), By Segment 1, 2022 & 2029
Figure 87: Middle East & Africa Electric Hydrofoil Water Taxi Market Forecast (USD Billion), by Sub-Segment 1, 2018-2029
Figure 88: Middle East & Africa Electric Hydrofoil Water Taxi Market Forecast (USD Billion), by Sub-Segment 2, 2018-2029
Figure 89: Middle East & Africa Electric Hydrofoil Water Taxi Market Value Share (%), By Segment 2, 2022 & 2029
Figure 90: Middle East & Africa Electric Hydrofoil Water Taxi Market Forecast (USD Billion), by Sub-Segment 1, 2018-2029
Figure 91: Middle East & Africa Electric Hydrofoil Water Taxi Market Forecast (USD Billion), by Sub-Segment 2, 2018-2029
Figure 92: Middle East & Africa Electric Hydrofoil Water Taxi Market Forecast (USD Billion), by Sub-Segment 3, 2018-2029
Figure 93: Middle East & Africa Electric Hydrofoil Water Taxi Market Forecast (USD Billion), by Others, 2018-2029
Figure 94: Middle East & Africa Electric Hydrofoil Water Taxi Market Value Share (%), By Segment 3, 2022 & 2029
Figure 95: Middle East & Africa Electric Hydrofoil Water Taxi Market Forecast (USD Billion), by Sub-Segment 1, 2018-2029
Figure 96: Middle East & Africa Electric Hydrofoil Water Taxi Market Forecast (USD Billion), by Sub-Segment 2, 2018-2029
Figure 97: Middle East & Africa Electric Hydrofoil Water Taxi Market Forecast (USD Billion), by Sub-Segment 3, 2018-2029
Figure 98: Middle East & Africa Electric Hydrofoil Water Taxi Market Forecast (USD Billion), by Others, 2018-2029
Figure 99: Middle East & Africa Electric Hydrofoil Water Taxi Market Forecast (USD Billion), by GCC, 2018-2029
Figure 100: Middle East & Africa Electric Hydrofoil Water Taxi Market Forecast (USD Billion), by South Africa, 2018-2029
Figure 101: Middle East & Africa Electric Hydrofoil Water Taxi Market Forecast (USD Billion), by Rest of Middle East & Africa, 2018-2029
List of Tables
Table 1: Global Electric Hydrofoil Water Taxi Market Revenue (USD Billion) Forecast, by Segment 1, 2018-2029
Table 2: Global Electric Hydrofoil Water Taxi Market Revenue (USD Billion) Forecast, by Segment 2, 2018-2029
Table 3: Global Electric Hydrofoil Water Taxi Market Revenue (USD Billion) Forecast, by Segment 3, 2018-2029
Table 4: Global Electric Hydrofoil Water Taxi Market Revenue (USD Billion) Forecast, by Region, 2018-2029
Table 5: North America Electric Hydrofoil Water Taxi Market Revenue (USD Billion) Forecast, by Segment 1, 2018-2029
Table 6: North America Electric Hydrofoil Water Taxi Market Revenue (USD Billion) Forecast, by Segment 2, 2018-2029
Table 7: North America Electric Hydrofoil Water Taxi Market Revenue (USD Billion) Forecast, by Segment 3, 2018-2029
Table 8: North America Electric Hydrofoil Water Taxi Market Revenue (USD Billion) Forecast, by Country, 2018-2029
Table 9: Europe Electric Hydrofoil Water Taxi Market Revenue (USD Billion) Forecast, by Segment 1, 2018-2029
Table 10: Europe Electric Hydrofoil Water Taxi Market Revenue (USD Billion) Forecast, by Segment 2, 2018-2029
Table 11: Europe Electric Hydrofoil Water Taxi Market Revenue (USD Billion) Forecast, by Segment 3, 2018-2029
Table 12: Europe Electric Hydrofoil Water Taxi Market Revenue (USD Billion) Forecast, by Country, 2018-2029
Table 13: Latin America Electric Hydrofoil Water Taxi Market Revenue (USD Billion) Forecast, by Segment 1, 2018-2029
Table 14: Latin America Electric Hydrofoil Water Taxi Market Revenue (USD Billion) Forecast, by Segment 2, 2018-2029
Table 15: Latin America Electric Hydrofoil Water Taxi Market Revenue (USD Billion) Forecast, by Segment 3, 2018-2029
Table 16: Latin America Electric Hydrofoil Water Taxi Market Revenue (USD Billion) Forecast, by Country, 2018-2029
Table 17: Asia Pacific Electric Hydrofoil Water Taxi Market Revenue (USD Billion) Forecast, by Segment 1, 2018-2029
Table 18: Asia Pacific Electric Hydrofoil Water Taxi Market Revenue (USD Billion) Forecast, by Segment 2, 2018-2029
Table 19: Asia Pacific Electric Hydrofoil Water Taxi Market Revenue (USD Billion) Forecast, by Segment 3, 2018-2029
Table 20: Asia Pacific Electric Hydrofoil Water Taxi Market Revenue (USD Billion) Forecast, by Country, 2018-2029
Table 21: Middle East & Africa Electric Hydrofoil Water Taxi Market Revenue (USD Billion) Forecast, by Segment 1, 2018-2029
Table 22: Middle East & Africa Electric Hydrofoil Water Taxi Market Revenue (USD Billion) Forecast, by Segment 2, 2018-2029
Table 23: Middle East & Africa Electric Hydrofoil Water Taxi Market Revenue (USD Billion) Forecast, by Segment 3, 2018-2029
Table 24: Middle East & Africa Electric Hydrofoil Water Taxi Market Revenue (USD Billion) Forecast, by Country, 2018-2029
Research Process
Data Library Research are conducted by industry experts who offer insight on
industry structure, market segmentations technology assessment and competitive landscape (CL), and penetration, as well as on emerging trends. Their analysis is based on primary interviews (~ 80%) and secondary research (~ 20%) as well as years of professional expertise in their respective industries. Adding to this, by analysing historical trends and current market positions, our analysts predict where the market will be headed for the next five years. Furthermore, the varying trends of segment & categories geographically presented are also studied and the estimated based on the primary & secondary research.
In this particular report from the supply side Data Library Research has conducted primary surveys (interviews) with the key level executives (VP, CEO’s, Marketing Director, Business Development Manager
and SOFT) of the companies that active & prominent as well as the midsized organization
FIGURE 1: DLR RESEARH PROCESS
![research-methodology1]()
Primary Research
Extensive primary research was conducted to gain a deeper insight of the market and industry performance. The analysis is based on both primary and secondary research as well as years of professional expertise in the respective industries.
In addition to analysing current and historical trends, our analysts predict where the market is headed over the next five years.
It varies by segment for these categories geographically presented in the list of market tables. Speaking about this particular report we have conducted primary surveys (interviews) with the key level executives (VP, CEO’s, Marketing Director, Business Development Manager and many more) of the major players active in the market.
Secondary Research
Secondary research was mainly used to collect and identify information useful for the extensive, technical, market-oriented, and Friend’s study of the Global Extra Neutral Alcohol. It was also used to obtain key information about major players, market classification and segmentation according to the industry trends, geographical markets, and developments related to the market and technology perspectives. For this study, analysts have gathered information from various credible sources, such as annual reports, sec filings, journals, white papers, SOFT presentations, and company web sites.
Market Size Estimation
Both, top-down and bottom-up approaches were used to estimate and validate the size of the Global market and to estimate the size of various other dependent submarkets in the overall Extra Neutral Alcohol. The key players in the market were identified through secondary research and their market contributions in the respective geographies were determined through primary and secondary research.
Forecast Model
![research-methodology2]()