
Get Complete Analysis Of The Report - Download Updated Free Sample PDF
The Global Electric Tourist Vehicle Market refers to the industry focused on manufacturing and deploying electric vehicles designed for tourism activities, such as sightseeing shuttles, resort transport, guided tours, and eco-friendly mobility within tourist zones. These vehicles offer quiet, clean, and energy-efficient transportation, helping tourism destinations reduce emissions, enhance visitor experience, and support sustainable travel initiatives. The market includes electric buses, carts, vans, and specialty tour vehicles used in parks, cities, resorts, and heritage sites.
The growth of the Global Electric Tourist Vehicle Market is driven by rising demand for eco-friendly tourism, government policies promoting low-emission transport in tourist areas, and the global shift toward sustainable travel experiences. Increasing tourist footfall in national parks, heritage sites, and urban destinations is boosting the need for clean and quiet transport solutions. Advancements in battery technology, lower operating costs, and growing investments by resorts, theme parks, and city tourism boards further accelerate market expansion.
The Global Electric Tourist Vehicle Market is experiencing strong momentum driven by the rise of sustainable tourism, expanding adoption of electric fleets in resorts and sightseeing destinations, and increasing government mandates for low-emission mobility in protected areas. Trends such as battery-swapping technology, solar-assisted vehicles, and autonomous shuttles are gaining traction. Tourism operators are also prioritizing quieter, compact, and multi-terrain electric vehicles to enhance visitor experience while reducing operational costs and environmental footprint.
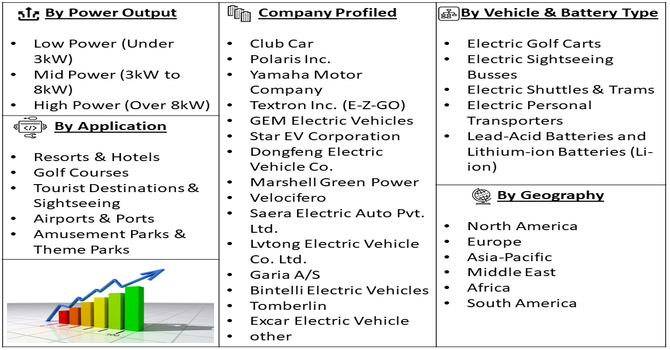
Segmentation: The Global Electric Tourist Vehicle (ETV) Market is segmented by Vehicle Type (Electric Golf Carts, Electric Sightseeing Busses, Electric Shuttles & Trams, and Electric Personal Transporters), Application (Resorts & Hotels, Golf Courses, Tourist Destinations & Sightseeing, Airports & Ports, and Amusement Parks & Theme Parks), Battery Type (Lead-Acid Batteries and Lithium-ion Batteries (Li-ion)), Power Output (Low Power (Under 3kW), Mid Power (3kW to 8kW) and High Power (Over 8kW)), and Geography (North America, Europe, Asia-Pacific, Middle East and Africa, and South America). The report provides the value (in USD million) for the above segments.
For Detailed Market Segmentation - Get a Free Sample PDF
Market Drivers:
The most significant catalyst for the ETV market is the rapidly accelerating shift towards sustainable and eco-friendly travel practices worldwide. Tourist destinations, including national parks, historical sites, and large resorts, are increasingly mandated or choosing to reduce their environmental impact to preserve their natural and cultural integrity.
In November 2025, an article published by Sustainable Bus, reported that Europe saw strong growth in battery-electric bus registrations, reaching over 5,300 units in early 2025—a 41% rise from 2024. Updated ACEA data showed registrations climbing to 9,346 units across the EU, UK, and EFTA, marking a 52% year-on-year increase. This surge reflected Europe’s accelerating shift toward clean transport. It positively impacted the Global Electric Tourist Vehicle Market by boosting demand for zero-emission travel options, supporting greener tourism, and encouraging wider adoption of electric sightseeing fleets. Electric vehicles offer a zero-tailpipe-emission solution, drastically lowering air and noise pollution in sensitive areas, which enhances the guest experience.
Fleet operators are increasingly motivated by the compelling long-term cost advantages of electric tourist vehicles compared to traditional gasoline or diesel fleets. ETVs possess significantly fewer moving parts, eliminating the need for regular oil changes, transmission servicing, and complex engine repairs, thereby drastically reducing maintenance requirements and associated labor costs.
In October 2024, Tata Motors expanded its electric mobility lineup with the launch of the Ace EV 1000, a zero-emission mini-truck offering a 1-tonne payload and a certified 161 km range. Designed with customer insights, it addressed evolving needs across FMCG, beverages, paints, LPG, and dairy sectors. This advancement supported superior operational economics and lower maintenance costs, indirectly benefiting the Global Electric Tourist Vehicle Market by promoting wider EV adoption, improved efficiency, and stronger confidence in electric transport solutions.
Market Restraints
The primary hurdle inhibiting widespread ETV adoption remains the high upfront capital investment required to acquire new electric vehicles compared to conventional combustion-engine models, particularly for small-to-mid-sized operators. This cost is compounded by the necessity of installing dedicated, high-power charging infrastructure. Developing tourist zones, in particular, often lack the necessary electrical grid capacity to support large-scale fleet charging operations. Furthermore, the limited standardized fast-charging network across remote or dispersed tourist locations introduces operational challenges, including range anxiety and lengthy downtime, negatively impacting vehicle utilization during busy seasons.
The market delivers significant socioeconomic benefits by supporting green tourism initiatives, improving air quality in high-traffic tourist destinations, and lowering noise pollution in nature-sensitive zones. It creates new employment opportunities in manufacturing, charging infrastructure, and fleet management, particularly for local communities. Reduced fuel dependency helps operators reinvest savings into local tourism infrastructure, while improved visitor mobility boosts overall tourist satisfaction and spending, ultimately contributing to regional economic growth.
Segmental Analysis:
The Electric Sightseeing Buses segment is expected to experience the highest growth as tourism destinations increasingly prioritize sustainable mobility and low-emission transport. Cities, theme parks, and heritage zones are shifting from diesel buses to electric fleets to reduce noise, enhance visitor comfort, and comply with tightening environmental rules.
Growing government support, subsidies, and investment in charging infrastructure further accelerate adoption. For instance, in September 2025, BMTC launched non-AC electric buses in Bengaluru, demonstrating wheelchair accessibility and introducing temple tour packages for tourists. This initiative enhanced inclusivity and improved the sightseeing experience, showcasing the practicality of electric buses for tourism purposes. The move positively impacted the Electric Sightseeing Buses segment and the Global Electric Tourist Vehicle Market by encouraging adoption of eco-friendly, accessible transport solutions, increasing passenger engagement, and promoting sustainable urban and tourist mobility options.
The Tourist Destinations & Sightseeing segment is poised to witness the strongest growth due to rising tourist numbers and increased focus on enhancing the overall visitor experience. National parks, coastal zones, zoos, resorts, and historical sites increasingly prefer electric vehicles for their quiet operation and zero emissions, helping preserve natural environments and cultural landmarks.
In October 2025, The Delhi government announced plans to promote tourism through weekly nature walks, wildlife awareness events, and the introduction of purple buses for popular site visits. Tourism Minister Kapil Mishra emphasized developing Delhi into an eco-tourism hub within three years. This initiative positively impacted the Tourist Destinations & Sightseeing segment and the Global Electric Tourist Vehicle Market by encouraging cleaner mobility, boosting demand for organized eco-tours, and supporting wider adoption of electric sightseeing transport solutions.
The Lithium-ion Batteries segment is anticipated to grow the fastest due to its superior energy density, longer lifespan, quick charging capabilities, and lightweight design compared to traditional lead-acid batteries. Electric tourist vehicles rely heavily on consistent performance and extended operating hours, making Li-ion the preferred choice for operators wanting higher efficiency and lower long-term maintenance costs.
Falling battery prices, steady technological advancements, and improved safety features further support adoption. These batteries enable longer travel routes, greater passenger loads, and reliable operation in both hot and cold climates—key factors for tourism environments worldwide. As fleets electrify rapidly, Li-ion batteries will dominate future power solutions in this market.
The Mid Power (3kW to 8kW) segment is set to see the highest growth because it offers the ideal balance between power, efficiency, and cost-effectiveness for most tourist vehicles. These motors deliver smooth performance for sightseeing shuttles, small buses, and multi-passenger carts operating across varied terrains.
Their ability to support moderate speeds, frequent stops, and continuous daily cycles makes them attractive for parks, resorts, and urban tourist circuits. The segment also benefits from improved motor efficiency, better thermal management, and longer operating life. As the demand for reliable electric transport in tourism rises, mid-power motors will remain the preferred choice for versatile and affordable vehicle platforms.
North America is expected to witness the highest growth due to strong environmental regulations, rising adoption of sustainable tourism practices, and rapid electrification of public and private fleets. National parks, entertainment venues, and major tourist cities such as Orlando, Las Vegas, and Vancouver increasingly use electric tourist vehicles to reduce carbon emissions and enhance visitor experience.
Government incentives, expanding charging infrastructure, and major investments from EV manufacturers further accelerate market penetration. For instance, in October 2025, Stellantis announced a historic USD 13 billion investment to expand its U.S. operations over four years, marking its largest commitment in a century. The plan supported five new vehicle launches, production of a new four-cylinder engine, and over 5,000 new jobs across Illinois, Ohio, Michigan, and Indiana. This major investment strengthened North America’s EV manufacturing ecosystem, positively impacting the Electric Tourist Vehicle Market by boosting local EV production, technology availability, and supportive supply chain capacity.
The region’s growing preference for eco-friendly travel, along with high spending power of tourists and operators, is driving widespread adoption. Additionally, technological advancements and strong R&D ecosystems support continuous upgrades in electric tourist mobility solutions.

To Learn More About This Report - Request a Free Sample Copy
The competitive landscape is intensifying as established electric vehicle manufacturers, niche tourism vehicle companies, and emerging start-ups expand their portfolios to cater to the growing demand. Companies compete on battery efficiency, vehicle durability, passenger capacity, and terrain adaptability. Partnerships between OEMs and tourism operators are increasing, while rapid technological advancements—such as smart fleet management systems and enhanced safety features—are raising the bar for innovation. Price competitiveness and customization capabilities remain key differentiators in securing global market share.
The major players for this market are:
Recent Development
Q1. What are the main growth-driving factors for this market?
The primary driver is the increasing global focus on eco-tourism and sustainability, as destinations aim to reduce carbon emissions and noise pollution. Growth is also fueled by the low operational cost of electric vehicles compared to gasoline models, offering quick ROI for fleet operators. Furthermore, government incentives and regulations in many countries favor the adoption of zero-emission public and sightseeing transport.
Q2. What are the main restraining factors for this market?
A key constraint is the limited range and long charging times of battery-powered tourist vehicles, which can hinder continuous operation during peak hours. The market also struggles with the high initial purchase price of electric models compared to their traditional gasoline counterparts. Additionally, the lack of standardized charging infrastructure across various tourist locations complicates inter-site travel and operational flexibility.
Q3. Which segment is expected to witness high growth?
The Sightseeing Bus and Shuttle Segment is projected to witness the highest growth. This is driven by the commitment of major urban areas and large amusement parks to transition their transport fleets to zero-emission technology. These high-capacity vehicles provide a clear public image benefit for sustainable tourism and benefit significantly from the cost savings achieved by replacing large diesel engines with efficient electric powertrains.
Q4. Who are the top major players for this market?
The market features established specialty vehicle manufacturers and emerging electric vehicle companies. Top major players include Club Car (Ingersoll Rand), Polaris Industries Inc. (GEM), BYD Company Ltd., and Textron Specialized Vehicles. Competition centers on developing high-capacity battery systems for extended range, offering versatile, customizable designs for various applications (e.g., luggage carriers, specialized tours), and establishing reliable after-sales service networks.
Q5. Which country is the largest player?
The United States is the largest country player by value and market maturity. This dominance is due to the massive infrastructure of golf courses, resorts, and theme parks that heavily utilize electric fleets. The strong presence of major manufacturers and a high consumer acceptance rate for electric recreational vehicles ensure the U.S. remains the primary hub for both consumption and technological advancement in this sector.
Data Library Research are conducted by industry experts who offer insight on industry structure, market segmentations technology assessment and competitive landscape (CL), and penetration, as well as on emerging trends. Their analysis is based on primary interviews (~ 80%) and secondary research (~ 20%) as well as years of professional expertise in their respective industries. Adding to this, by analysing historical trends and current market positions, our analysts predict where the market will be headed for the next five years. Furthermore, the varying trends of segment & categories geographically presented are also studied and the estimated based on the primary & secondary research.
In this particular report from the supply side Data Library Research has conducted primary surveys (interviews) with the key level executives (VP, CEO’s, Marketing Director, Business Development Manager and SOFT) of the companies that active & prominent as well as the midsized organization
FIGURE 1: DLR RESEARH PROCESS
Extensive primary research was conducted to gain a deeper insight of the market and industry performance. The analysis is based on both primary and secondary research as well as years of professional expertise in the respective industries.
In addition to analysing current and historical trends, our analysts predict where the market is headed over the next five years.
It varies by segment for these categories geographically presented in the list of market tables. Speaking about this particular report we have conducted primary surveys (interviews) with the key level executives (VP, CEO’s, Marketing Director, Business Development Manager and many more) of the major players active in the market.
Secondary ResearchSecondary research was mainly used to collect and identify information useful for the extensive, technical, market-oriented, and Friend’s study of the Global Extra Neutral Alcohol. It was also used to obtain key information about major players, market classification and segmentation according to the industry trends, geographical markets, and developments related to the market and technology perspectives. For this study, analysts have gathered information from various credible sources, such as annual reports, sec filings, journals, white papers, SOFT presentations, and company web sites.
Market Size EstimationBoth, top-down and bottom-up approaches were used to estimate and validate the size of the Global market and to estimate the size of various other dependent submarkets in the overall Extra Neutral Alcohol. The key players in the market were identified through secondary research and their market contributions in the respective geographies were determined through primary and secondary research.
Forecast Model