Electron Laser Quantum Computers Market Overview and Analysis

The Global Electron Laser Quantum Computers Market is currently valued at USD 1.7 billion in 2025 and is forecast to achieve USD 5.24 billion by 2032, registering a 15.25% CAGR from 2025-2032.

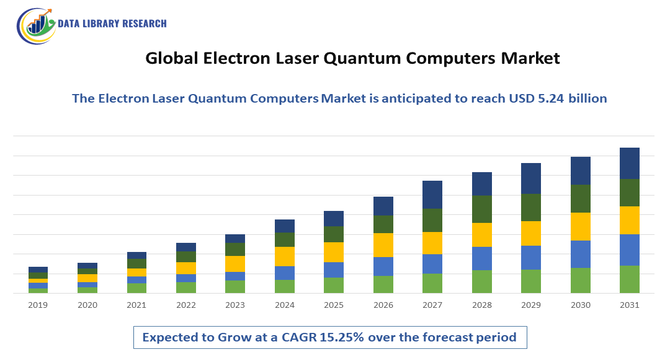
The Global Electron Laser Quantum Computers Market refers to the worldwide business sector focused on developing and selling quantum computers that use electrons manipulated by lasers to encode and process information. These machines exploit electron-laser interactions to create qubits, offering potentially faster and more scalable computation than classical computers. The market includes research, hardware manufacturing, and applications in fields like pharmaceuticals, cryptography, and materials science.

Growth of the Global Electron Laser Quantum Computers Market is driven by rising demand for ultra-fast data processing, increasing investments in quantum research, and the need for stronger cybersecurity solutions. Advancements in electron-laser manipulation technologies and scalable qubit architectures support wider adoption. Industries such as pharmaceuticals, finance, aerospace, and materials science are accelerating demand for high-precision simulations. Government funding, corporate R&D initiatives, and growing commercial interest further propel market expansion.

Electron Laser Quantum Computers Market Latest Trends

The global electron-laser quantum computers market is evolving quickly as industries look for faster, more scalable quantum systems. A major trend is the integration of quantum processing with AI to accelerate modeling, simulation, and analytics. Companies are pushing toward more stable, energy-efficient qubit designs that reduce cooling requirements and enable broader commercial use. Collaboration between research institutes and private firms is growing, helping transition prototypes into practical products. Demand is also rising from sectors like healthcare, finance, aerospace, and materials research, all seeking high-precision computational advantages.

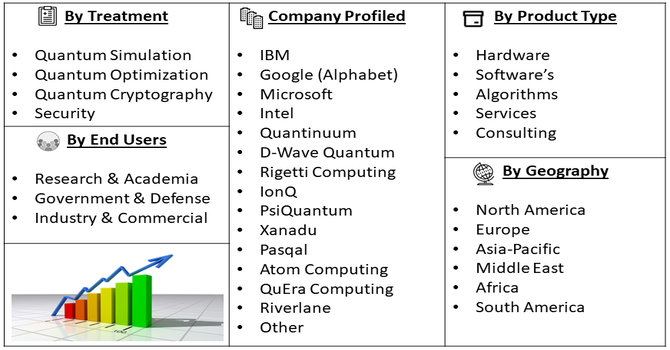
Segmentation: The Global Electron Laser Quantum Computers Market is segmented by Component (Hardware, Software’s & Algorithms, and Services & Consulting), Qubit Technology (Trapped Ion Qubits, and Electron Spin Qubits (in Silicon)), Application (Quantum Simulation, Quantum Optimization and Quantum Cryptography and Security), End User (Research & Academia, Government & Defense and Industry & Commercial), and Geography (North America, Europe, Asia-Pacific, Middle East and Africa, and South America). The report provides the value (in USD million) for the above segments.

Market Drivers:

  • Advancements in Quantum Hardware and Electron-Laser Integration

The Global Electron Laser Quantum Computers Market was driven by continuous technological breakthroughs in electron-laser manipulation and qubit design. These advancements allowed researchers and companies to develop faster, more reliable quantum processors capable of handling complex computations previously impossible with classical computers. Integration of electron-based qubits with precise laser control improved stability, reduced error rates, and enabled real-time qubit management. This enhanced performance accelerated adoption across industries like pharmaceuticals, finance, aerospace, and materials science, where high-speed simulations and optimization were critical.

  • Rising Demand for High-Precision Applications

Another major market driver was the growing requirement for ultra-fast, high-precision computing in sectors such as drug discovery, chemical simulations, cryptography, and logistics optimization. Electron-laser quantum computers offered unparalleled computational power to solve large-scale problems, reducing time and cost compared to traditional methods.

Additionally, the development of integrated photonic-electronic chips and miniaturized quantum modules enabled easier deployment, supporting wider adoption. For instance, in 2021, 3D Systems expanded its Denver, Colorado presence to support its growing healthcare solutions business and enhance industrial application development for its Application Innovation Group. This strategic investment in high-precision additive manufacturing indirectly impacted the Global Electron Laser Quantum Computers Market by enabling production of highly reliable, precise components. The move accelerated innovation in quantum devices, supporting high-precision applications like quantum sensors, photonic chips, and integrated quantum hardware, reinforcing market growth and technological advancement. This combination of technological capability and sector-specific demand consistently drove growth, positioning the electron-laser quantum computing market as a key emerging segment of the global quantum technology industry.

Market Restraints

  • High Costs and Technical Complexity

The market faced significant restraints due to the extremely high costs associated with developing, manufacturing, and maintaining electron-laser quantum computers. Fabrication of advanced qubit systems and precision laser control required specialized materials, ultra-clean environments, and sophisticated cryogenic or photonic stabilization equipment. Moreover, the technical complexity of integrating electron-laser interactions, controlling qubit coherence, and minimizing error rates limited accessibility to well-funded corporations, governments, and top-tier research institutions. This barrier slowed widespread adoption, as smaller organizations could not easily afford or operate such systems.

Socio Economic Impact on Electron Laser Quantum Computers Market

Electron-laser quantum computers have the potential to significantly influence global socioeconomic structures. They can speed up drug discovery, optimize energy systems, and strengthen cybersecurity, leading to cost savings and improved public welfare. Nations investing in quantum infrastructure stand to gain strategic advantages, creating new high-skill jobs and stimulating innovation ecosystems. Industries adopting quantum solutions may achieve higher productivity and operational efficiency, giving them competitive advantages. However, disparities in access to quantum technologies could widen the digital divide, making equitable adoption a key concern. Thus, the technology promises economic growth, workforce evolution, and long-term societal transformation.

Segmental Analysis:

  • Software’s & Algorithms segment is expected to witness highest growth over the forecast period

The Software & Algorithms segment of the Global Electron Laser Quantum Computers Market is expected to witness the highest growth over the forecast period due to increasing demand for optimized quantum programming solutions and error-correction techniques. As quantum hardware advances, the need for sophisticated algorithms that can efficiently manage qubits, simulate quantum processes, and solve complex computational problems has surged. Companies and research institutions are investing heavily in developing user-friendly software platforms that simplify quantum operations. Additionally, cloud-based quantum computing services are driving accessibility, enabling more organizations to leverage quantum capabilities. This focus on software development is accelerating adoption and expanding market opportunities globally.

  • Trapped Ion Qubits segment is expected to witness highest growth over the forecast period

The Trapped Ion Qubits segment is expected to experience the highest growth as it offers high coherence times, exceptional gate fidelity, and reliable qubit control, making it suitable for scalable quantum computing. Advances in ion-trapping technology and laser manipulation techniques have made these systems more stable and reproducible. Research institutions and companies are increasingly adopting trapped ion architectures for precision quantum simulations, cryptography, and optimization tasks. The ability to integrate multiple qubits with minimal error has enhanced commercial interest. Rising investments in trapped ion research, coupled with growing recognition of their potential for complex computations, are driving the segment’s rapid growth over the forecast period.

  • Quantum Simulation segment is expected to witness highest growth over the forecast period

The Quantum Simulation segment is projected to witness the highest growth due to its critical role in solving complex chemical, physical, and material science problems that are infeasible for classical computers. Industries such as pharmaceuticals, energy, and aerospace are increasingly relying on quantum simulators to model molecular interactions, optimize materials, and predict reaction outcomes. The demand for high-accuracy simulations to accelerate research and reduce development costs is fueling adoption. Coupled with advancements in electron-laser quantum hardware, quantum simulation software and platforms are becoming more efficient and scalable. Growing collaboration between academia, government, and industry is further driving the segment’s expansion.

  • Research & Academia segment is expected to witness highest growth over the forecast period

The Research & Academia segment is expected to experience the highest growth as universities, government labs, and private research institutions intensify efforts in quantum computing innovation. This sector drives foundational discoveries in qubit design, electron-laser integration, and algorithm development, forming the backbone of commercial quantum computing solutions. Increased funding, grants, and public-private partnerships have expanded research capabilities and infrastructure. Educational initiatives are also producing a skilled workforce of quantum engineers and scientists, enhancing global expertise. The segment’s growth is further supported by collaborative projects, open-access quantum computing platforms, and experimental studies that accelerate innovation, positioning research and academia as a primary driver of the overall market.

  • North America region is expected to witness highest growth over the forecast period

North America is expected to witness the highest growth in the Global Electron Laser Quantum Computers Market due to strong government support, substantial R&D investments, and the presence of leading technology companies. The U.S. and Canada have established robust innovation ecosystems with advanced quantum research centers, universities, and startups actively developing electron-laser quantum technologies. @@@@ Favorable policies, venture capital funding, and collaborations between industry and academia have accelerated commercialization of quantum hardware and software solutions. For instance, in 2025, Scientists at Northwestern University, Boston University, and UC Berkeley integrated a photonic quantum system into a traditional electronic chip for the first time. The one-millimeter silicon chip combined quantum light-generating components with built-in electronic control to stabilize photon streams, enabling reliable quantum communication, sensing, and processing. This achievement boosted North America’s quantum-computing market by demonstrating scalable, manufacturable quantum hardware, attracting investment, and accelerating regional commercialization of photonic quantum technologies.

Additionally, North America’s focus on national security, high-performance computing, and advanced manufacturing applications is driving adoption. For instance, in November 2025, Fabric8Labs, a pioneer in Electrochemical Additive Manufacturing (ECAM), secured USD 50 million in funding to expand its U.S. advanced manufacturing facilities, increasing capacity to produce tens of millions of components annually. The expansion enhanced North America’s quantum-computing market by enabling scalable production of high-precision electronic components essential for quantum hardware, supporting faster prototyping, high-volume manufacturing, and advancing regional development of quantum systems for AI, HPC, and advanced communications. Thus, these factors position the region as a market leader and growth hotspot over the forecast period.

Electron Laser Quantum Computers Market Competitive Landscape:

Competition in the electron-laser quantum computers market is intensifying as established technology companies and emerging quantum startups race to lead commercialization. Large firms leverage extensive R&D capabilities, manufacturing scale, and cloud platforms to expand their quantum offerings. Smaller specialized companies focus on novel qubit architectures, innovative electron-laser control methods, and niche application areas. Partnerships between corporations, universities, and government agencies are common, accelerating advancements and reducing development risks. Many players are also investing in software ecosystems to support programming, error correction, and user accessibility. This mix of collaboration and rivalry is driving rapid innovation and shaping the future competitive dynamics.

The major players for this market includes:

  • IBM
  • Google (Alphabet)
  • Microsoft
  • Intel
  • Quantinuum
  • D-Wave Quantum
  • Rigetti Computing
  • IonQ
  • PsiQuantum
  • Xanadu
  • Pasqal
  • Atom Computing
  • QuEra Computing
  • Riverlane
  • 1QBit
  • Alice & Bob
  • Quantum Motion
  • Oxford Quantum Circuits (OQC)
  • Anyon Systems
  • Qilimanjaro Quantum Tech

Recent Development

  • In October 2025, indie, an automotive solutions innovator, introduced a new Visible DFB GaN-based laser diode within its Photonics BU lineup. The device delivered ultra-stable, sub-MHz linewidths and supported wavelengths from 375 nm to 535 nm, enabling advanced quantum systems, next-generation LiDAR, precision sensing, and industrial Raman applications. This launch broadened high-precision light source options for the global quantum-computing market, enhancing stability and control required for quantum photonics. It boosted development of more reliable qubit manipulation techniques, supported integrated quantum-optical hardware, and strengthened supply chains for quantum components.


  • In July 2025, Researchers from Boston University, UC Berkeley, and Northwestern achieved the first electronic–photonic–quantum chip by integrating quantum light sources with control electronics using standard 45-nanometer CMOS fabrication. The system stabilized 12 quantum light sources in real time, overcoming thermal drift and device interference. This breakthrough strengthened the global quantum-computing market by proving scalable, manufacturable quantum-photonic hardware, boosting investor confidence, accelerating commercialization, and opening new opportunities in quantum communication, sensing, and computing.


Frequently Asked Questions (FAQ) :

Q1. What are the main growth-driving factors for this market?

The primary driver is the intense global race for quantum supremacy fueled by government and private sector investment. Electron-laser quantum computing holds immense potential for superior scalability and faster processing speeds compared to current quantum technologies like superconducting circuits. The ability to utilize focused electron beams or trapped ions manipulated by lasers promises a path toward creating stable, high-fidelity qubits.

Q2. What are the main restraining factors for this market?

The major constraint is the immense technological complexity and immaturity of the field, which is currently largely theoretical. Building a functional, stable electron-laser quantum computer requires solving fundamental challenges in quantum physics, specifically maintaining qubit coherence (preventing errors) and reliably controlling individual electrons with laser precision.

Q3. Which segment is expected to witness high growth?

The Software and Quantum Algorithms Segment is expected to witness the highest growth, even preceding the full commercialization of the hardware. As the fundamental hardware architecture solidifies, the focus shifts to developing specialized quantum algorithms that can leverage the unique properties of electron-laser qubits. This includes software for quantum simulation, optimization, and quantum machine learning.

Q4. Who are the top major players for this market?

The market is currently dominated by major tech corporations and research-focused entities rather than commercial vendors. Top major players include Google (via its quantum AI labs), IBM, and various national research institutions (like those affiliated with the U.S. Department of Energy and European quantum initiatives).

Q5. Which country is the largest player?

The United States is recognized as the largest global player in this frontier market. This dominance is due to immense and sustained federal funding dedicated to quantum science, strong collaboration between defense agencies and Silicon Valley tech giants (like Google and IBM), and the presence of leading academic research universities. This ecosystem creates the critical mass of capital, talent, and computational infrastructure necessary to conduct the highly theoretical and expensive research required for developing electron-laser and ion-trap quantum architectures.

Electron Laser Quantum Computers MARKET STUDY GLOBAL MARKET ANALYSIS, INSIGHTS AND FORECAST, 2022-2029

    1. Introduction

    • 1.1. Research Scope
    • 1.2. Market Segmentation
    • 1.3. Research Methodology
    • 1.4. Definitions and Assumptions

    2. Executive Summary

      3. Market Dynamics

      • 3.1. Market Drivers
      • 3.2. Market Restraints
      • 3.3. Market Opportunities

      4. Key Insights

      • 4.1. Key Emerging Trends – For Major Countries
      • 4.2. Latest Technological Advancement
      • 4.3. Regulatory Landscape
      • 4.4. Industry SWOT Analysis
      • 4.5. Porters Five Forces Analysis

      5. Global Electron Laser Quantum Computers Market Analysis (USD Billion), Insights and Forecast, 2018-2029

      • 5.1. Key Findings / Summary
      • 5.2. Market Analysis, Insights and Forecast – By Segment 1
        • 5.2.1. Sub-Segment 1
        • 5.2.2. Sub-Segment 2
      • 5.3. Market Analysis, Insights and Forecast – By Segment 2
        • 5.3.1. Sub-Segment 1
        • 5.3.2. Sub-Segment 2
        • 5.3.3. Sub-Segment 3
        • 5.3.4. Others
      • 5.4. Market Analysis, Insights and Forecast – By Segment 3
        • 5.4.1. Sub-Segment 1
        • 5.4.2. Sub-Segment 2
        • 5.4.3. Sub-Segment 3
        • 5.4.4. Others
      • 5.5. Market Analysis, Insights and Forecast – By Region
        • 5.5.1. North America
        • 5.5.2. Latin America
        • 5.5.3. Europe
        • 5.5.4. Asia Pacific
        • 5.5.5. Middle East and Africa

      6. North America Electron Laser Quantum Computers Market Analysis (USD Billion), Insights and Forecast, 2018-2029

      • 6.1. Key Findings / Summary
      • 6.2. Market Analysis, Insights and Forecast – By Segment 1
        • 6.2.1. Sub-Segment 1
        • 6.2.2. Sub-Segment 2
      • 6.3. Market Analysis, Insights and Forecast – By Segment 2
        • 6.3.1. Sub-Segment 1
        • 6.3.2. Sub-Segment 2
        • 6.3.3. Sub-Segment 3
        • 6.3.4. Others
      • 6.4. Market Analysis, Insights and Forecast – By Segment 3
        • 6.4.1. Sub-Segment 1
        • 6.4.2. Sub-Segment 2
        • 6.4.3. Sub-Segment 3
        • 6.4.4. Others
      • 6.5. Market Analysis, Insights and Forecast – By Country
        • 6.5.1. U.S.
        • 6.5.2. Canada

      7. Latin America Electron Laser Quantum Computers Market Analysis (USD Billion), Insights and Forecast, 2018-2029

      • 7.1. Key Findings / Summary
      • 7.2. Market Analysis, Insights and Forecast – By Segment 1
        • 7.2.1. Sub-Segment 1
        • 7.2.2. Sub-Segment 2
      • 7.3. Market Analysis, Insights and Forecast – By Segment 2
        • 7.3.1. Sub-Segment 1
        • 7.3.2. Sub-Segment 2
        • 7.3.3. Sub-Segment 3
        • 7.3.4. Others
      • 7.4. Market Analysis, Insights and Forecast – By Segment 3
        • 7.4.1. Sub-Segment 1
        • 7.4.2. Sub-Segment 2
        • 7.4.3. Sub-Segment 3
        • 7.4.4. Others
      • 7.5. Insights and Forecast – By Country
        • 7.5.1. Brazil
        • 7.5.2. Mexico
        • 7.5.3. Rest of Latin America

      8. Europe Electron Laser Quantum Computers Market Analysis (USD Billion), Insights and Forecast, 2018-2029

      • 8.1. Key Findings / Summary
      • 8.2. Market Analysis, Insights and Forecast – By Segment 1
        • 8.2.1. Sub-Segment 1
        • 8.2.2. Sub-Segment 2
      • 8.3. Market Analysis, Insights and Forecast – By Segment 2
        • 8.3.1. Sub-Segment 1
        • 8.3.2. Sub-Segment 2
        • 8.3.3. Sub-Segment 3
        • 8.3.4. Others
      • 8.4. Market Analysis, Insights and Forecast – By Segment 3
        • 8.4.1. Sub-Segment 1
        • 8.4.2. Sub-Segment 2
        • 8.4.3. Sub-Segment 3
        • 8.4.4. Others
      • 8.5. Market Analysis, Insights and Forecast – By Country
        • 8.5.1. UK
        • 8.5.2. Germany
        • 8.5.3. France
        • 8.5.4. Italy
        • 8.5.5. Spain
        • 8.5.6. Russia
        • 8.5.7. Rest of Europe

      9. Asia Pacific Electron Laser Quantum Computers Market Analysis (USD Billion), Insights and Forecast, 2018-2029

      • 9.1. Key Findings / Summary
      • 9.2. Market Analysis, Insights and Forecast – By Segment 1
        • 9.2.1. Sub-Segment 1
        • 9.2.2. Sub-Segment 2
      • 9.3. Market Analysis, Insights and Forecast – By Segment 2
        • 9.3.1. Sub-Segment 1
        • 9.3.2. Sub-Segment 2
        • 9.3.3. Sub-Segment 3
        • 9.3.4. Others
      • 9.4. Market Analysis, Insights and Forecast – By Segment 3
        • 9.4.1. Sub-Segment 1
        • 9.4.2. Sub-Segment 2
        • 9.4.3. Sub-Segment 3
        • 9.4.4. Others
      • 9.5. Market Analysis, Insights and Forecast – By Country
        • 9.5.1. China
        • 9.5.2. India
        • 9.5.3. Japan
        • 9.5.4. Australia
        • 9.5.5. South East Asia
        • 9.5.6. Rest of Asia Pacific

      10. Middle East & Africa Electron Laser Quantum Computers Market Analysis (USD Billion), Insights and Forecast, 2018-2029

      • 10.1. Key Findings / Summary
      • 10.2. Market Analysis, Insights and Forecast – By Segment 1
        • 10.2.1. Sub-Segment 1
        • 10.2.2. Sub-Segment 2
      • 10.3. Market Analysis, Insights and Forecast – By Segment 2
        • 10.3.1. Sub-Segment 1
        • 10.3.2. Sub-Segment 2
        • 10.3.3. Sub-Segment 3
        • 10.3.4. Others
      • 10.4. Market Analysis, Insights and Forecast – By Segment 3
        • 10.4.1. Sub-Segment 1
        • 10.4.2. Sub-Segment 2
        • 10.4.3. Sub-Segment 3
        • 10.4.4. Others
      • 10.5. Market Analysis, Insights and Forecast – By Country
        • 10.5.1. GCC
        • 10.5.2. South Africa
        • 10.5.3. Rest of Middle East & Africa

      11. Competitive Analysis

      • 11.1. Company Market Share Analysis, 2018
      • 11.2. Key Industry Developments
      • 11.3. Company Profile
        • 11.3.1. Company 1
          • 11.3.1.1. Business Overview
          • 11.3.1.2. Segment 1 & Service Offering
          • 11.3.1.3. Overall Revenue
          • 11.3.1.4. Geographic Presence
          • 11.3.1.5. Recent Development
        *Similar details will be provided for the following companies
        • 11.3.2. Company 2
        • 11.3.3. Company 3
        • 11.3.4. Company 4
        • 11.3.5. Company 5
        • 11.3.6. Company 6
        • 11.3.7. Company 7
        • 11.3.8. Company 8
        • 11.3.9. Company 9
        • 11.3.10. Company 10
        • 11.3.11. Company 11
        • 11.3.12. Company 12
      List of Figures

      Figure 1: Global Electron Laser Quantum Computers Market Revenue Breakdown (USD Billion, %) by Region, 2022 & 2029
      Figure 2: Global Electron Laser Quantum Computers Market Value Share (%), By Segment 1, 2022 & 2029
      Figure 3: Global Electron Laser Quantum Computers Market Forecast (USD Billion), by Sub-Segment 1, 2018-2029
      Figure 4: Global Electron Laser Quantum Computers Market Forecast (USD Billion), by Sub-Segment 2, 2018-2029
      Figure 5: Global Electron Laser Quantum Computers Market Value Share (%), By Segment 2, 2022 & 2029
      Figure 6: Global Electron Laser Quantum Computers Market Forecast (USD Billion), by Sub-Segment 1, 2018-2029
      Figure 7: Global Electron Laser Quantum Computers Market Forecast (USD Billion), by Sub-Segment 2, 2018-2029
      Figure 8: Global Electron Laser Quantum Computers Market Forecast (USD Billion), by Sub-Segment 3, 2018-2029
      Figure 9: Global Electron Laser Quantum Computers Market Forecast (USD Billion), by Others, 2018-2029
      Figure 10: Global Electron Laser Quantum Computers Market Value Share (%), By Segment 3, 2022 & 2029
      Figure 11: Global Electron Laser Quantum Computers Market Forecast (USD Billion), by Sub-Segment 1, 2018-2029
      Figure 12: Global Electron Laser Quantum Computers Market Forecast (USD Billion), by Sub-Segment 2, 2018-2029
      Figure 13: Global Electron Laser Quantum Computers Market Forecast (USD Billion), by Sub-Segment 3, 2018-2029
      Figure 14: Global Electron Laser Quantum Computers Market Forecast (USD Billion), by Others, 2018-2029
      Figure 15: Global Electron Laser Quantum Computers Market Value (USD Billion), by Region, 2022 & 2029
      Figure 16: North America Electron Laser Quantum Computers Market Value Share (%), By Segment 1, 2022 & 2029
      Figure 17: North America Electron Laser Quantum Computers Market Forecast (USD Billion), by Sub-Segment 1, 2018-2029
      Figure 18: North America Electron Laser Quantum Computers Market Forecast (USD Billion), by Sub-Segment 2, 2018-2029
      Figure 19: North America Electron Laser Quantum Computers Market Value Share (%), By Segment 2, 2022 & 2029
      Figure 20: North America Electron Laser Quantum Computers Market Forecast (USD Billion), by Sub-Segment 1, 2018-2029
      Figure 21: North America Electron Laser Quantum Computers Market Forecast (USD Billion), by Sub-Segment 2, 2018-2029
      Figure 22: North America Electron Laser Quantum Computers Market Forecast (USD Billion), by Sub-Segment 3, 2018-2029
      Figure 23: North America Electron Laser Quantum Computers Market Forecast (USD Billion), by Others, 2018-2029
      Figure 24: North America Electron Laser Quantum Computers Market Value Share (%), By Segment 3, 2022 & 2029
      Figure 25: North America Electron Laser Quantum Computers Market Forecast (USD Billion), by Sub-Segment 1, 2018-2029
      Figure 26: North America Electron Laser Quantum Computers Market Forecast (USD Billion), by Sub-Segment 2, 2018-2029
      Figure 27: North America Electron Laser Quantum Computers Market Forecast (USD Billion), by Sub-Segment 3, 2018-2029
      Figure 28: North America Electron Laser Quantum Computers Market Forecast (USD Billion), by Others, 2018-2029
      Figure 29: North America Electron Laser Quantum Computers Market Forecast (USD Billion), by U.S., 2018-2029
      Figure 30: North America Electron Laser Quantum Computers Market Forecast (USD Billion), by Canada, 2018-2029
      Figure 31: Latin America Electron Laser Quantum Computers Market Value Share (%), By Segment 1, 2022 & 2029
      Figure 32: Latin America Electron Laser Quantum Computers Market Forecast (USD Billion), by Sub-Segment 1, 2018-2029
      Figure 33: Latin America Electron Laser Quantum Computers Market Forecast (USD Billion), by Sub-Segment 2, 2018-2029
      Figure 34: Latin America Electron Laser Quantum Computers Market Value Share (%), By Segment 2, 2022 & 2029
      Figure 35: Latin America Electron Laser Quantum Computers Market Forecast (USD Billion), by Sub-Segment 1, 2018-2029
      Figure 36: Latin America Electron Laser Quantum Computers Market Forecast (USD Billion), by Sub-Segment 2, 2018-2029
      Figure 37: Latin America Electron Laser Quantum Computers Market Forecast (USD Billion), by Sub-Segment 3, 2018-2029
      Figure 38: Latin America Electron Laser Quantum Computers Market Forecast (USD Billion), by Others, 2018-2029
      Figure 39: Latin America Electron Laser Quantum Computers Market Value Share (%), By Segment 3, 2022 & 2029
      Figure 40: Latin America Electron Laser Quantum Computers Market Forecast (USD Billion), by Sub-Segment 1, 2018-2029
      Figure 41: Latin America Electron Laser Quantum Computers Market Forecast (USD Billion), by Sub-Segment 2, 2018-2029
      Figure 42: Latin America Electron Laser Quantum Computers Market Forecast (USD Billion), by Sub-Segment 3, 2018-2029
      Figure 43: Latin America Electron Laser Quantum Computers Market Forecast (USD Billion), by Others, 2018-2029
      Figure 44: Latin America Electron Laser Quantum Computers Market Forecast (USD Billion), by Brazil, 2018-2029
      Figure 45: Latin America Electron Laser Quantum Computers Market Forecast (USD Billion), by Mexico, 2018-2029
      Figure 46: Latin America Electron Laser Quantum Computers Market Forecast (USD Billion), by Rest of Latin America, 2018-2029
      Figure 47: Europe Electron Laser Quantum Computers Market Value Share (%), By Segment 1, 2022 & 2029
      Figure 48: Europe Electron Laser Quantum Computers Market Forecast (USD Billion), by Sub-Segment 1, 2018-2029
      Figure 49: Europe Electron Laser Quantum Computers Market Forecast (USD Billion), by Sub-Segment 2, 2018-2029
      Figure 50: Europe Electron Laser Quantum Computers Market Value Share (%), By Segment 2, 2022 & 2029
      Figure 51: Europe Electron Laser Quantum Computers Market Forecast (USD Billion), by Sub-Segment 1, 2018-2029
      Figure 52: Europe Electron Laser Quantum Computers Market Forecast (USD Billion), by Sub-Segment 2, 2018-2029
      Figure 53: Europe Electron Laser Quantum Computers Market Forecast (USD Billion), by Sub-Segment 3, 2018-2029
      Figure 54: Europe Electron Laser Quantum Computers Market Forecast (USD Billion), by Others, 2018-2029
      Figure 55: Europe Electron Laser Quantum Computers Market Value Share (%), By Segment 3, 2022 & 2029
      Figure 56: Europe Electron Laser Quantum Computers Market Forecast (USD Billion), by Sub-Segment 1, 2018-2029
      Figure 57: Europe Electron Laser Quantum Computers Market Forecast (USD Billion), by Sub-Segment 2, 2018-2029
      Figure 58: Europe Electron Laser Quantum Computers Market Forecast (USD Billion), by Sub-Segment 3, 2018-2029
      Figure 59: Europe Electron Laser Quantum Computers Market Forecast (USD Billion), by Others, 2018-2029
      Figure 60: Europe Electron Laser Quantum Computers Market Forecast (USD Billion), by U.K., 2018-2029
      Figure 61: Europe Electron Laser Quantum Computers Market Forecast (USD Billion), by Germany, 2018-2029
      Figure 62: Europe Electron Laser Quantum Computers Market Forecast (USD Billion), by France, 2018-2029
      Figure 63: Europe Electron Laser Quantum Computers Market Forecast (USD Billion), by Italy, 2018-2029
      Figure 64: Europe Electron Laser Quantum Computers Market Forecast (USD Billion), by Spain, 2018-2029
      Figure 65: Europe Electron Laser Quantum Computers Market Forecast (USD Billion), by Russia, 2018-2029
      Figure 66: Europe Electron Laser Quantum Computers Market Forecast (USD Billion), by Rest of Europe, 2018-2029
      Figure 67: Asia Pacific Electron Laser Quantum Computers Market Value Share (%), By Segment 1, 2022 & 2029
      Figure 68: Asia Pacific Electron Laser Quantum Computers Market Forecast (USD Billion), by Sub-Segment 1, 2018-2029
      Figure 69: Asia Pacific Electron Laser Quantum Computers Market Forecast (USD Billion), by Sub-Segment 2, 2018-2029
      Figure 70: Asia Pacific Electron Laser Quantum Computers Market Value Share (%), By Segment 2, 2022 & 2029
      Figure 71: Asia Pacific Electron Laser Quantum Computers Market Forecast (USD Billion), by Sub-Segment 1, 2018-2029
      Figure 72: Asia Pacific Electron Laser Quantum Computers Market Forecast (USD Billion), by Sub-Segment 2, 2018-2029
      Figure 73: Asia Pacific Electron Laser Quantum Computers Market Forecast (USD Billion), by Sub-Segment 3, 2018-2029
      Figure 74: Asia Pacific Electron Laser Quantum Computers Market Forecast (USD Billion), by Others, 2018-2029
      Figure 75: Asia Pacific Electron Laser Quantum Computers Market Value Share (%), By Segment 3, 2022 & 2029
      Figure 76: Asia Pacific Electron Laser Quantum Computers Market Forecast (USD Billion), by Sub-Segment 1, 2018-2029
      Figure 77: Asia Pacific Electron Laser Quantum Computers Market Forecast (USD Billion), by Sub-Segment 2, 2018-2029
      Figure 78: Asia Pacific Electron Laser Quantum Computers Market Forecast (USD Billion), by Sub-Segment 3, 2018-2029
      Figure 79: Asia Pacific Electron Laser Quantum Computers Market Forecast (USD Billion), by Others, 2018-2029
      Figure 80: Asia Pacific Electron Laser Quantum Computers Market Forecast (USD Billion), by China, 2018-2029
      Figure 81: Asia Pacific Electron Laser Quantum Computers Market Forecast (USD Billion), by India, 2018-2029
      Figure 82: Asia Pacific Electron Laser Quantum Computers Market Forecast (USD Billion), by Japan, 2018-2029
      Figure 83: Asia Pacific Electron Laser Quantum Computers Market Forecast (USD Billion), by Australia, 2018-2029
      Figure 84: Asia Pacific Electron Laser Quantum Computers Market Forecast (USD Billion), by Southeast Asia, 2018-2029
      Figure 85: Asia Pacific Electron Laser Quantum Computers Market Forecast (USD Billion), by Rest of Asia Pacific, 2018-2029
      Figure 86: Middle East & Africa Electron Laser Quantum Computers Market Value Share (%), By Segment 1, 2022 & 2029
      Figure 87: Middle East & Africa Electron Laser Quantum Computers Market Forecast (USD Billion), by Sub-Segment 1, 2018-2029
      Figure 88: Middle East & Africa Electron Laser Quantum Computers Market Forecast (USD Billion), by Sub-Segment 2, 2018-2029
      Figure 89: Middle East & Africa Electron Laser Quantum Computers Market Value Share (%), By Segment 2, 2022 & 2029
      Figure 90: Middle East & Africa Electron Laser Quantum Computers Market Forecast (USD Billion), by Sub-Segment 1, 2018-2029
      Figure 91: Middle East & Africa Electron Laser Quantum Computers Market Forecast (USD Billion), by Sub-Segment 2, 2018-2029
      Figure 92: Middle East & Africa Electron Laser Quantum Computers Market Forecast (USD Billion), by Sub-Segment 3, 2018-2029
      Figure 93: Middle East & Africa Electron Laser Quantum Computers Market Forecast (USD Billion), by Others, 2018-2029
      Figure 94: Middle East & Africa Electron Laser Quantum Computers Market Value Share (%), By Segment 3, 2022 & 2029
      Figure 95: Middle East & Africa Electron Laser Quantum Computers Market Forecast (USD Billion), by Sub-Segment 1, 2018-2029
      Figure 96: Middle East & Africa Electron Laser Quantum Computers Market Forecast (USD Billion), by Sub-Segment 2, 2018-2029
      Figure 97: Middle East & Africa Electron Laser Quantum Computers Market Forecast (USD Billion), by Sub-Segment 3, 2018-2029
      Figure 98: Middle East & Africa Electron Laser Quantum Computers Market Forecast (USD Billion), by Others, 2018-2029
      Figure 99: Middle East & Africa Electron Laser Quantum Computers Market Forecast (USD Billion), by GCC, 2018-2029
      Figure 100: Middle East & Africa Electron Laser Quantum Computers Market Forecast (USD Billion), by South Africa, 2018-2029
      Figure 101: Middle East & Africa Electron Laser Quantum Computers Market Forecast (USD Billion), by Rest of Middle East & Africa, 2018-2029 
      List of Tables
      Table 1: Global Electron Laser Quantum Computers Market Revenue (USD Billion) Forecast, by Segment 1, 2018-2029
      Table 2: Global Electron Laser Quantum Computers Market Revenue (USD Billion) Forecast, by Segment 2, 2018-2029
      Table 3: Global Electron Laser Quantum Computers Market Revenue (USD Billion) Forecast, by Segment 3, 2018-2029
      Table 4: Global Electron Laser Quantum Computers Market Revenue (USD Billion) Forecast, by Region, 2018-2029
      Table 5: North America Electron Laser Quantum Computers Market Revenue (USD Billion) Forecast, by Segment 1, 2018-2029
      Table 6: North America Electron Laser Quantum Computers Market Revenue (USD Billion) Forecast, by Segment 2, 2018-2029
      Table 7: North America Electron Laser Quantum Computers Market Revenue (USD Billion) Forecast, by Segment 3, 2018-2029
      Table 8: North America Electron Laser Quantum Computers Market Revenue (USD Billion) Forecast, by Country, 2018-2029
      Table 9: Europe Electron Laser Quantum Computers Market Revenue (USD Billion) Forecast, by Segment 1, 2018-2029
      Table 10: Europe Electron Laser Quantum Computers Market Revenue (USD Billion) Forecast, by Segment 2, 2018-2029
      Table 11: Europe Electron Laser Quantum Computers Market Revenue (USD Billion) Forecast, by Segment 3, 2018-2029
      Table 12: Europe Electron Laser Quantum Computers Market Revenue (USD Billion) Forecast, by Country, 2018-2029
      Table 13: Latin America Electron Laser Quantum Computers Market Revenue (USD Billion) Forecast, by Segment 1, 2018-2029
      Table 14: Latin America Electron Laser Quantum Computers Market Revenue (USD Billion) Forecast, by Segment 2, 2018-2029
      Table 15: Latin America Electron Laser Quantum Computers Market Revenue (USD Billion) Forecast, by Segment 3, 2018-2029
      Table 16: Latin America Electron Laser Quantum Computers Market Revenue (USD Billion) Forecast, by Country, 2018-2029
      Table 17: Asia Pacific Electron Laser Quantum Computers Market Revenue (USD Billion) Forecast, by Segment 1, 2018-2029
      Table 18: Asia Pacific Electron Laser Quantum Computers Market Revenue (USD Billion) Forecast, by Segment 2, 2018-2029
      Table 19: Asia Pacific Electron Laser Quantum Computers Market Revenue (USD Billion) Forecast, by Segment 3, 2018-2029
      Table 20: Asia Pacific Electron Laser Quantum Computers Market Revenue (USD Billion) Forecast, by Country, 2018-2029
      Table 21: Middle East & Africa Electron Laser Quantum Computers Market Revenue (USD Billion) Forecast, by Segment 1, 2018-2029
      Table 22: Middle East & Africa Electron Laser Quantum Computers Market Revenue (USD Billion) Forecast, by Segment 2, 2018-2029
      Table 23: Middle East & Africa Electron Laser Quantum Computers Market Revenue (USD Billion) Forecast, by Segment 3, 2018-2029
      Table 24: Middle East & Africa Electron Laser Quantum Computers Market Revenue (USD Billion) Forecast, by Country, 2018-2029
      Research Process

      Data Library Research are conducted by industry experts who offer insight on industry structure, market segmentations technology assessment and competitive landscape (CL), and penetration, as well as on emerging trends. Their analysis is based on primary interviews (~ 80%) and secondary research (~ 20%) as well as years of professional expertise in their respective industries. Adding to this, by analysing historical trends and current market positions, our analysts predict where the market will be headed for the next five years. Furthermore, the varying trends of segment & categories geographically presented are also studied and the estimated based on the primary & secondary research.

      In this particular report from the supply side Data Library Research has conducted primary surveys (interviews) with the key level executives (VP, CEO’s, Marketing Director, Business Development Manager and SOFT) of the companies that active & prominent as well as the midsized organization

      FIGURE 1: DLR RESEARH PROCESS

      research-methodology1

      Primary Research

      Extensive primary research was conducted to gain a deeper insight of the market and industry performance. The analysis is based on both primary and secondary research as well as years of professional expertise in the respective industries.

      In addition to analysing current and historical trends, our analysts predict where the market is headed over the next five years.

      It varies by segment for these categories geographically presented in the list of market tables. Speaking about this particular report we have conducted primary surveys (interviews) with the key level executives (VP, CEO’s, Marketing Director, Business Development Manager and many more) of the major players active in the market.

      Secondary Research

      Secondary research was mainly used to collect and identify information useful for the extensive, technical, market-oriented, and Friend’s study of the Global Extra Neutral Alcohol. It was also used to obtain key information about major players, market classification and segmentation according to the industry trends, geographical markets, and developments related to the market and technology perspectives. For this study, analysts have gathered information from various credible sources, such as annual reports, sec filings, journals, white papers, SOFT presentations, and company web sites.

      Market Size Estimation

      Both, top-down and bottom-up approaches were used to estimate and validate the size of the Global market and to estimate the size of various other dependent submarkets in the overall Extra Neutral Alcohol. The key players in the market were identified through secondary research and their market contributions in the respective geographies were determined through primary and secondary research.

      Forecast Model

      research-methodology2