Green Laser Therapy System Market Overview and Analysis
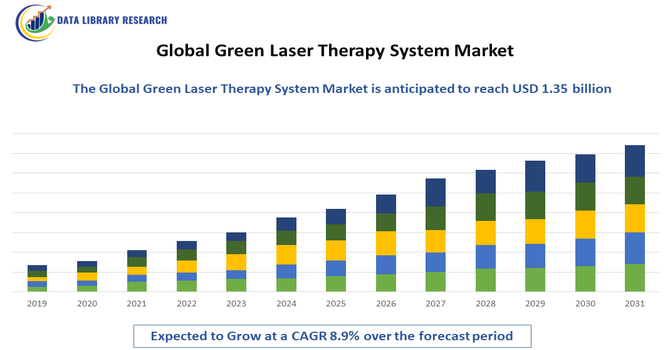
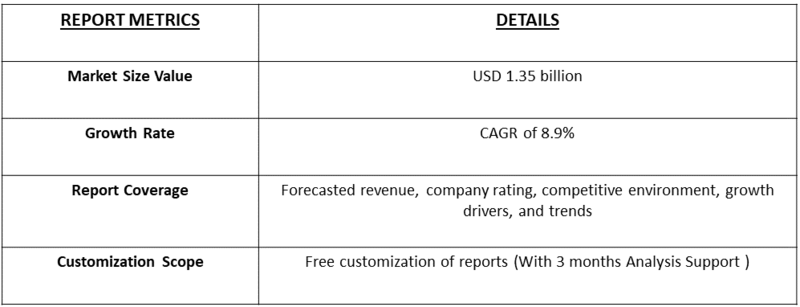
- The Global Green Laser Therapy System Market was valued at approximately USD 665 million in 2025 and is projected to reach USD 1.35 billion by 2032. This growth is driven by increasing demand for minimally invasive treatments, particularly in urology and dermatology, with a robust Compound Annual Growth Rate (CAGR) of 8.9% during the forecast period (2025–2032).
Get Complete Analysis Of The Report - Download Updated Free Sample PDF
The Global Green Laser Therapy System Market is experiencing steady growth, driven primarily by the rising adoption of minimally invasive treatment options across dermatology, ophthalmology, oncology, and vascular therapy. Green laser systems are increasingly favored for their superior precision, reduced thermal damage, and enhanced efficacy in procedures such as skin rejuvenation, pigment correction, retinal photocoagulation, and targeted tumor ablation.
Green Laser Therapy System Market Latest Trends
The Global Green Laser Therapy System Market is witnessing strong technological refinement and clinical expansion, with manufacturers increasingly integrating advanced features such as precision-controlled beam modulation, enhanced cooling mechanisms, and AI-assisted treatment interfaces to improve safety and customization. There is a growing shift toward portable, multi-application green laser platforms that support dermatology, ophthalmology, oncology, and vascular procedures in both hospital and outpatient settings, making adoption more accessible for smaller clinics. Rising demand for minimally invasive aesthetic and therapeutic treatments—particularly for pigment correction, vascular lesions, and retinal disorders—is further accelerating system upgrades.
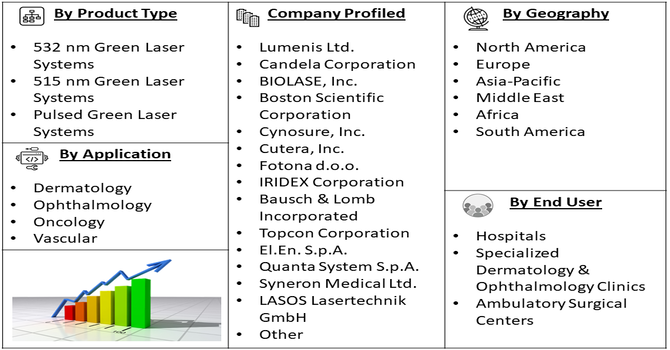
Segmentation: Global Green Laser Therapy System Market is segmented By Laser Type (532 nm Green Laser Systems, 515 nm Green Laser Systems, Pulsed Green Laser Systems), Application (Dermatology, Ophthalmology, Oncology, Vascular), End User (Hospitals, Specialized Dermatology & Ophthalmology Clinics, Ambulatory Surgical Centers), and Geography (North America, Europe, Asia-Pacific, Middle East and Africa, and South America). The report provides the value (in USD million) for the above segments.
For Detailed Market Segmentation - Get a Free Sample PDF
Market Drivers:
- Growing Demand for Minimally Invasive and Precision-Based Treatments
Green laser therapy systems are increasingly adopted due to their ability to deliver highly precise, minimally invasive treatments with reduced thermal damage to surrounding tissues. In dermatology, green lasers effectively target vascular and pigmented lesions with minimal downtime, making them popular among patients seeking cosmetic enhancement without surgical intervention. In ophthalmology, green lasers remain a gold-standard tool for retinal photocoagulation, diabetic retinopathy management, and glaucoma procedures due to their accuracy and controlled penetration. The strong global shift toward procedures that offer faster recovery, fewer side effects, and improved clinical outcomes is significantly driving demand for green laser systems across hospitals, clinics, and aesthetic centers.
- Expanding Applications Across Dermatology, Ophthalmology, Oncology, and Vascular Therapy
Another key growth driver is the expanding clinical applicability of green laser technology. Dermatologists increasingly use green lasers for treating vascular conditions, rosacea, port-wine stains, melasma, and pigmentation disorders. In oncology, green lasers are gaining traction in photodynamic therapy and targeted tumor ablation because of their optimal absorption properties in chromophores. Vascular surgeons utilize them for vein treatments and hemostasis during minimally invasive procedures. This multi-specialty relevance broadens the potential user base and encourages healthcare providers to invest in versatile, advanced green laser systems. As research advances and regulatory approvals increase across additional therapeutic areas, adoption is expected to rise even further, fueling sustained market growth.
Market Restraints:
- High Equipment Cost and Limited Affordability in Emerging Markets
Green laser therapy systems are technologically advanced devices that require precision engineering, high-quality optical components, and robust cooling mechanisms. As a result, they carry a high upfront cost, often ranging from several thousand to tens of thousands of dollars depending on power output and clinical features. Additionally, regular maintenance, consumables, and service contracts add to the overall cost of ownership. In many developing regions, healthcare budgets are constrained, and smaller clinics or independent practitioners may struggle to justify the investment. This cost barrier limits adoption, especially in lower-income countries where demand for advanced laser-based treatments exists but purchasing power remains limited.
Socioeconomic Impact on Green Laser Therapy System Market
The socioeconomic impact of the Global Green Laser Therapy System market is increasingly significant, as rising adoption in ophthalmology and dermatology enhances healthcare outcomes while reducing long-term treatment costs. Expanding access to minimally invasive procedures supports improved patient productivity and lowers burdens on healthcare systems. Growing industry investment stimulates job creation in medical device manufacturing, research, and clinical services, particularly in emerging economies. Additionally, technological innovation encourages competitive markets and greater affordability over time. However, unequal access to advanced medical technologies may widen health disparities, underscoring the need for equitable distribution and supportive regulatory policies to maximize societal benefits.
Segmental Analysis:
- 532 nm Green Laser Systems segment is expected to witness highest growth over the forecast period
The 532 nm green laser systems segment dominates due to its precise absorption by hemoglobin and melanin, making it highly effective for treating vascular lesions, pigmented skin disorders, and ocular procedures like retinal photocoagulation. Its ability to deliver controlled energy with minimal collateral tissue damage drives surgeon preference, contributing significantly to overall market growth.
- Dermatology segment is expected to witness highest growth over the forecast period
Dermatology is a leading application segment, driven by the rising prevalence of cosmetic and medical skin concerns such as vascular lesions, rosacea, port-wine stains, and pigmentation disorders. Patients increasingly prefer minimally invasive procedures with low downtime, boosting the adoption of green laser systems in hospitals, specialized clinics, and aesthetic centers.
- Hospitals segment is expected to witness highest growth over the forecast period
Hospitals remain the primary end users of green laser systems due to their advanced infrastructure, availability of trained surgeons, and higher procedure volumes. Hospitals can accommodate complex multi-specialty applications, including dermatology, ophthalmology, oncology, and vascular treatments, ensuring consistent utilization of green laser devices.
- North America segment is expected to witness highest growth over the forecast period
North America accounts for the largest market share owing to advanced healthcare infrastructure, high patient awareness, and early adoption of cutting-edge laser technologies. The presence of leading manufacturers, favorable reimbursement policies, and strong clinical research activity further supports the region’s market dominance. For instance, In January 2025, Norlase, announced it had received Health Canada licensing for the ECHO Green Pattern Laser photocoagulator, the first portable pattern-scanning system using MEMS technology. The integrated laser-scanner device attached to compatible slit lamps, offering unprecedented efficiency. Canada, like many countries, faced significant vision-care staffing shortages, and CEO Oliver Hvidt noted this underscored the need for innovations that had provided ophthalmologists with greater efficiency and reliability.
The region also benefits from the concentration of major medical device manufacturers, robust clinical research networks, and favorable reimbursement frameworks that encourage both providers and patients to utilize innovative therapies. Together, these factors reinforce North America’s market leadership and drive sustained technological advancement within the green laser therapy landscape.
To Learn More About This Report - Request a Free Sample Copy
Green Laser Therapy System Market Competitive Landscape:
The competitive landscape of the global green laser therapy system market is marked by intense rivalry among established medical device manufacturers and specialized laser system providers, all striving to lead via innovation, breadth of product portfolios, and geographic distribution. Market leaders differentiate by investing heavily in R&D, securing regulatory approvals across regions, and offering integrated solutions that combine laser hardware, software, and after sales support, thereby raising the barrier to entry for smaller players. Recent years have seen consolidation through mergers and acquisitions, strategic partnerships, and expansion into emerging markets — moves driven by the need to broaden clinical applications (dermatology, ophthalmology, vascular, oncology) and serve a growing base of hospitals, aesthetic clinics and ambulatory centers.
The major players for this market are:
- Lumenis Ltd.
- Candela Corporation
- BIOLASE, Inc.
- Boston Scientific Corporation
- Cynosure, Inc.
- Cutera, Inc.
- Fotona d.o.o.
- IRIDEX Corporation
- Bausch & Lomb Incorporated
- Topcon Corporation
- El.En. S.p.A.
- Quanta System S.p.A.
- Syneron Medical Ltd.
- LASOS Lasertechnik GmbH
- Jenoptik AG
- Biolitec AG
- AngioDynamics, Inc.
- WONTECH Co., Ltd.
- Medelux
Recent Developments
- In November 2025, TurnOnGreen, Inc., announced that its subsidiary Digital Power Corporation received a new purchase order from a U.S. medical device company that develops digitally pulsed dental laser systems used in FDA-cleared regenerative periodontal treatments.
- In January 2025, ZEISS Medical Technology announced that the MEL® 90 excimer laser received FDA approval for myopia, hyperopia, and mixed astigmatism, enabling comprehensive refractive treatment capabilities. Fully integrated into the Corneal Refractive Workflow, it offers U.S. surgeons a faster, more efficient surgical experience and complements the VISUMAX® 800 with SMILE® pro. This advancement strengthens technological confidence in ophthalmic laser systems overall, indirectly supporting growth and innovation within the Global Green Laser Therapy System market.
Frequently Asked Questions (FAQ) :
Q1. What are the main growth-driving factors for this market?
The market is primarily driven by the increasing global demand for minimally invasive surgical and aesthetic procedures. Patients prefer green laser systems for treatments like BPH (benign prostatic hyperplasia) due to reduced recovery times and improved clinical outcomes compared to traditional surgery. Technological advancements in laser precision also fuel adoption.
Q2. What are the main restraining factors for this market?
A significant restraint is the high initial cost associated with purchasing, installing, and maintaining advanced green laser therapy equipment. This substantial financial barrier can limit the adoption of these systems, particularly in smaller clinics or healthcare facilities in developing regions with constrained budgets.
Q3. Which segment is expected to witness high growth?
The Dermatology and Aesthetics segment is projected to show high growth. Green lasers are increasingly popular for cosmetic applications such as skin resurfacing, lesion removal, and permanent hair removal due to their precision and effectiveness. Rising consumer disposable income further boosts this non-invasive sector.
Q4. Who are the top major players for this market?
The top major players in the broader medical laser and therapy systems market include Lumenis (Boston Scientific), IPG Photonics Corporation, and Cutera, Inc. These companies invest heavily in R&D to enhance green laser technology, focusing on creating more compact, efficient, and versatile clinical systems.
Q5. Which country is the largest player?
North America holds the largest revenue share in the market, primarily due to the United States. This is driven by high awareness of laser therapy benefits, extensive healthcare expenditure, advanced technological adoption, and a strong concentration of both key market players and aesthetic clinics.
List of Figures
Figure 1: Global Green Laser Therapy System Market Revenue Breakdown (USD Billion, %) by Region, 2022 & 2029
Figure 2: Global Green Laser Therapy System Market Value Share (%), By Segment 1, 2022 & 2029
Figure 3: Global Green Laser Therapy System Market Forecast (USD Billion), by Sub-Segment 1, 2018-2029
Figure 4: Global Green Laser Therapy System Market Forecast (USD Billion), by Sub-Segment 2, 2018-2029
Figure 5: Global Green Laser Therapy System Market Value Share (%), By Segment 2, 2022 & 2029
Figure 6: Global Green Laser Therapy System Market Forecast (USD Billion), by Sub-Segment 1, 2018-2029
Figure 7: Global Green Laser Therapy System Market Forecast (USD Billion), by Sub-Segment 2, 2018-2029
Figure 8: Global Green Laser Therapy System Market Forecast (USD Billion), by Sub-Segment 3, 2018-2029
Figure 9: Global Green Laser Therapy System Market Forecast (USD Billion), by Others, 2018-2029
Figure 10: Global Green Laser Therapy System Market Value Share (%), By Segment 3, 2022 & 2029
Figure 11: Global Green Laser Therapy System Market Forecast (USD Billion), by Sub-Segment 1, 2018-2029
Figure 12: Global Green Laser Therapy System Market Forecast (USD Billion), by Sub-Segment 2, 2018-2029
Figure 13: Global Green Laser Therapy System Market Forecast (USD Billion), by Sub-Segment 3, 2018-2029
Figure 14: Global Green Laser Therapy System Market Forecast (USD Billion), by Others, 2018-2029
Figure 15: Global Green Laser Therapy System Market Value (USD Billion), by Region, 2022 & 2029
Figure 16: North America Green Laser Therapy System Market Value Share (%), By Segment 1, 2022 & 2029
Figure 17: North America Green Laser Therapy System Market Forecast (USD Billion), by Sub-Segment 1, 2018-2029
Figure 18: North America Green Laser Therapy System Market Forecast (USD Billion), by Sub-Segment 2, 2018-2029
Figure 19: North America Green Laser Therapy System Market Value Share (%), By Segment 2, 2022 & 2029
Figure 20: North America Green Laser Therapy System Market Forecast (USD Billion), by Sub-Segment 1, 2018-2029
Figure 21: North America Green Laser Therapy System Market Forecast (USD Billion), by Sub-Segment 2, 2018-2029
Figure 22: North America Green Laser Therapy System Market Forecast (USD Billion), by Sub-Segment 3, 2018-2029
Figure 23: North America Green Laser Therapy System Market Forecast (USD Billion), by Others, 2018-2029
Figure 24: North America Green Laser Therapy System Market Value Share (%), By Segment 3, 2022 & 2029
Figure 25: North America Green Laser Therapy System Market Forecast (USD Billion), by Sub-Segment 1, 2018-2029
Figure 26: North America Green Laser Therapy System Market Forecast (USD Billion), by Sub-Segment 2, 2018-2029
Figure 27: North America Green Laser Therapy System Market Forecast (USD Billion), by Sub-Segment 3, 2018-2029
Figure 28: North America Green Laser Therapy System Market Forecast (USD Billion), by Others, 2018-2029
Figure 29: North America Green Laser Therapy System Market Forecast (USD Billion), by U.S., 2018-2029
Figure 30: North America Green Laser Therapy System Market Forecast (USD Billion), by Canada, 2018-2029
Figure 31: Latin America Green Laser Therapy System Market Value Share (%), By Segment 1, 2022 & 2029
Figure 32: Latin America Green Laser Therapy System Market Forecast (USD Billion), by Sub-Segment 1, 2018-2029
Figure 33: Latin America Green Laser Therapy System Market Forecast (USD Billion), by Sub-Segment 2, 2018-2029
Figure 34: Latin America Green Laser Therapy System Market Value Share (%), By Segment 2, 2022 & 2029
Figure 35: Latin America Green Laser Therapy System Market Forecast (USD Billion), by Sub-Segment 1, 2018-2029
Figure 36: Latin America Green Laser Therapy System Market Forecast (USD Billion), by Sub-Segment 2, 2018-2029
Figure 37: Latin America Green Laser Therapy System Market Forecast (USD Billion), by Sub-Segment 3, 2018-2029
Figure 38: Latin America Green Laser Therapy System Market Forecast (USD Billion), by Others, 2018-2029
Figure 39: Latin America Green Laser Therapy System Market Value Share (%), By Segment 3, 2022 & 2029
Figure 40: Latin America Green Laser Therapy System Market Forecast (USD Billion), by Sub-Segment 1, 2018-2029
Figure 41: Latin America Green Laser Therapy System Market Forecast (USD Billion), by Sub-Segment 2, 2018-2029
Figure 42: Latin America Green Laser Therapy System Market Forecast (USD Billion), by Sub-Segment 3, 2018-2029
Figure 43: Latin America Green Laser Therapy System Market Forecast (USD Billion), by Others, 2018-2029
Figure 44: Latin America Green Laser Therapy System Market Forecast (USD Billion), by Brazil, 2018-2029
Figure 45: Latin America Green Laser Therapy System Market Forecast (USD Billion), by Mexico, 2018-2029
Figure 46: Latin America Green Laser Therapy System Market Forecast (USD Billion), by Rest of Latin America, 2018-2029
Figure 47: Europe Green Laser Therapy System Market Value Share (%), By Segment 1, 2022 & 2029
Figure 48: Europe Green Laser Therapy System Market Forecast (USD Billion), by Sub-Segment 1, 2018-2029
Figure 49: Europe Green Laser Therapy System Market Forecast (USD Billion), by Sub-Segment 2, 2018-2029
Figure 50: Europe Green Laser Therapy System Market Value Share (%), By Segment 2, 2022 & 2029
Figure 51: Europe Green Laser Therapy System Market Forecast (USD Billion), by Sub-Segment 1, 2018-2029
Figure 52: Europe Green Laser Therapy System Market Forecast (USD Billion), by Sub-Segment 2, 2018-2029
Figure 53: Europe Green Laser Therapy System Market Forecast (USD Billion), by Sub-Segment 3, 2018-2029
Figure 54: Europe Green Laser Therapy System Market Forecast (USD Billion), by Others, 2018-2029
Figure 55: Europe Green Laser Therapy System Market Value Share (%), By Segment 3, 2022 & 2029
Figure 56: Europe Green Laser Therapy System Market Forecast (USD Billion), by Sub-Segment 1, 2018-2029
Figure 57: Europe Green Laser Therapy System Market Forecast (USD Billion), by Sub-Segment 2, 2018-2029
Figure 58: Europe Green Laser Therapy System Market Forecast (USD Billion), by Sub-Segment 3, 2018-2029
Figure 59: Europe Green Laser Therapy System Market Forecast (USD Billion), by Others, 2018-2029
Figure 60: Europe Green Laser Therapy System Market Forecast (USD Billion), by U.K., 2018-2029
Figure 61: Europe Green Laser Therapy System Market Forecast (USD Billion), by Germany, 2018-2029
Figure 62: Europe Green Laser Therapy System Market Forecast (USD Billion), by France, 2018-2029
Figure 63: Europe Green Laser Therapy System Market Forecast (USD Billion), by Italy, 2018-2029
Figure 64: Europe Green Laser Therapy System Market Forecast (USD Billion), by Spain, 2018-2029
Figure 65: Europe Green Laser Therapy System Market Forecast (USD Billion), by Russia, 2018-2029
Figure 66: Europe Green Laser Therapy System Market Forecast (USD Billion), by Rest of Europe, 2018-2029
Figure 67: Asia Pacific Green Laser Therapy System Market Value Share (%), By Segment 1, 2022 & 2029
Figure 68: Asia Pacific Green Laser Therapy System Market Forecast (USD Billion), by Sub-Segment 1, 2018-2029
Figure 69: Asia Pacific Green Laser Therapy System Market Forecast (USD Billion), by Sub-Segment 2, 2018-2029
Figure 70: Asia Pacific Green Laser Therapy System Market Value Share (%), By Segment 2, 2022 & 2029
Figure 71: Asia Pacific Green Laser Therapy System Market Forecast (USD Billion), by Sub-Segment 1, 2018-2029
Figure 72: Asia Pacific Green Laser Therapy System Market Forecast (USD Billion), by Sub-Segment 2, 2018-2029
Figure 73: Asia Pacific Green Laser Therapy System Market Forecast (USD Billion), by Sub-Segment 3, 2018-2029
Figure 74: Asia Pacific Green Laser Therapy System Market Forecast (USD Billion), by Others, 2018-2029
Figure 75: Asia Pacific Green Laser Therapy System Market Value Share (%), By Segment 3, 2022 & 2029
Figure 76: Asia Pacific Green Laser Therapy System Market Forecast (USD Billion), by Sub-Segment 1, 2018-2029
Figure 77: Asia Pacific Green Laser Therapy System Market Forecast (USD Billion), by Sub-Segment 2, 2018-2029
Figure 78: Asia Pacific Green Laser Therapy System Market Forecast (USD Billion), by Sub-Segment 3, 2018-2029
Figure 79: Asia Pacific Green Laser Therapy System Market Forecast (USD Billion), by Others, 2018-2029
Figure 80: Asia Pacific Green Laser Therapy System Market Forecast (USD Billion), by China, 2018-2029
Figure 81: Asia Pacific Green Laser Therapy System Market Forecast (USD Billion), by India, 2018-2029
Figure 82: Asia Pacific Green Laser Therapy System Market Forecast (USD Billion), by Japan, 2018-2029
Figure 83: Asia Pacific Green Laser Therapy System Market Forecast (USD Billion), by Australia, 2018-2029
Figure 84: Asia Pacific Green Laser Therapy System Market Forecast (USD Billion), by Southeast Asia, 2018-2029
Figure 85: Asia Pacific Green Laser Therapy System Market Forecast (USD Billion), by Rest of Asia Pacific, 2018-2029
Figure 86: Middle East & Africa Green Laser Therapy System Market Value Share (%), By Segment 1, 2022 & 2029
Figure 87: Middle East & Africa Green Laser Therapy System Market Forecast (USD Billion), by Sub-Segment 1, 2018-2029
Figure 88: Middle East & Africa Green Laser Therapy System Market Forecast (USD Billion), by Sub-Segment 2, 2018-2029
Figure 89: Middle East & Africa Green Laser Therapy System Market Value Share (%), By Segment 2, 2022 & 2029
Figure 90: Middle East & Africa Green Laser Therapy System Market Forecast (USD Billion), by Sub-Segment 1, 2018-2029
Figure 91: Middle East & Africa Green Laser Therapy System Market Forecast (USD Billion), by Sub-Segment 2, 2018-2029
Figure 92: Middle East & Africa Green Laser Therapy System Market Forecast (USD Billion), by Sub-Segment 3, 2018-2029
Figure 93: Middle East & Africa Green Laser Therapy System Market Forecast (USD Billion), by Others, 2018-2029
Figure 94: Middle East & Africa Green Laser Therapy System Market Value Share (%), By Segment 3, 2022 & 2029
Figure 95: Middle East & Africa Green Laser Therapy System Market Forecast (USD Billion), by Sub-Segment 1, 2018-2029
Figure 96: Middle East & Africa Green Laser Therapy System Market Forecast (USD Billion), by Sub-Segment 2, 2018-2029
Figure 97: Middle East & Africa Green Laser Therapy System Market Forecast (USD Billion), by Sub-Segment 3, 2018-2029
Figure 98: Middle East & Africa Green Laser Therapy System Market Forecast (USD Billion), by Others, 2018-2029
Figure 99: Middle East & Africa Green Laser Therapy System Market Forecast (USD Billion), by GCC, 2018-2029
Figure 100: Middle East & Africa Green Laser Therapy System Market Forecast (USD Billion), by South Africa, 2018-2029
Figure 101: Middle East & Africa Green Laser Therapy System Market Forecast (USD Billion), by Rest of Middle East & Africa, 2018-2029
List of Tables
Table 1: Global Green Laser Therapy System Market Revenue (USD Billion) Forecast, by Segment 1, 2018-2029
Table 2: Global Green Laser Therapy System Market Revenue (USD Billion) Forecast, by Segment 2, 2018-2029
Table 3: Global Green Laser Therapy System Market Revenue (USD Billion) Forecast, by Segment 3, 2018-2029
Table 4: Global Green Laser Therapy System Market Revenue (USD Billion) Forecast, by Region, 2018-2029
Table 5: North America Green Laser Therapy System Market Revenue (USD Billion) Forecast, by Segment 1, 2018-2029
Table 6: North America Green Laser Therapy System Market Revenue (USD Billion) Forecast, by Segment 2, 2018-2029
Table 7: North America Green Laser Therapy System Market Revenue (USD Billion) Forecast, by Segment 3, 2018-2029
Table 8: North America Green Laser Therapy System Market Revenue (USD Billion) Forecast, by Country, 2018-2029
Table 9: Europe Green Laser Therapy System Market Revenue (USD Billion) Forecast, by Segment 1, 2018-2029
Table 10: Europe Green Laser Therapy System Market Revenue (USD Billion) Forecast, by Segment 2, 2018-2029
Table 11: Europe Green Laser Therapy System Market Revenue (USD Billion) Forecast, by Segment 3, 2018-2029
Table 12: Europe Green Laser Therapy System Market Revenue (USD Billion) Forecast, by Country, 2018-2029
Table 13: Latin America Green Laser Therapy System Market Revenue (USD Billion) Forecast, by Segment 1, 2018-2029
Table 14: Latin America Green Laser Therapy System Market Revenue (USD Billion) Forecast, by Segment 2, 2018-2029
Table 15: Latin America Green Laser Therapy System Market Revenue (USD Billion) Forecast, by Segment 3, 2018-2029
Table 16: Latin America Green Laser Therapy System Market Revenue (USD Billion) Forecast, by Country, 2018-2029
Table 17: Asia Pacific Green Laser Therapy System Market Revenue (USD Billion) Forecast, by Segment 1, 2018-2029
Table 18: Asia Pacific Green Laser Therapy System Market Revenue (USD Billion) Forecast, by Segment 2, 2018-2029
Table 19: Asia Pacific Green Laser Therapy System Market Revenue (USD Billion) Forecast, by Segment 3, 2018-2029
Table 20: Asia Pacific Green Laser Therapy System Market Revenue (USD Billion) Forecast, by Country, 2018-2029
Table 21: Middle East & Africa Green Laser Therapy System Market Revenue (USD Billion) Forecast, by Segment 1, 2018-2029
Table 22: Middle East & Africa Green Laser Therapy System Market Revenue (USD Billion) Forecast, by Segment 2, 2018-2029
Table 23: Middle East & Africa Green Laser Therapy System Market Revenue (USD Billion) Forecast, by Segment 3, 2018-2029
Table 24: Middle East & Africa Green Laser Therapy System Market Revenue (USD Billion) Forecast, by Country, 2018-2029
Research Process
Data Library Research are conducted by industry experts who offer insight on
industry structure, market segmentations technology assessment and competitive landscape (CL), and penetration, as well as on emerging trends. Their analysis is based on primary interviews (~ 80%) and secondary research (~ 20%) as well as years of professional expertise in their respective industries. Adding to this, by analysing historical trends and current market positions, our analysts predict where the market will be headed for the next five years. Furthermore, the varying trends of segment & categories geographically presented are also studied and the estimated based on the primary & secondary research.
In this particular report from the supply side Data Library Research has conducted primary surveys (interviews) with the key level executives (VP, CEO’s, Marketing Director, Business Development Manager
and SOFT) of the companies that active & prominent as well as the midsized organization
FIGURE 1: DLR RESEARH PROCESS
![research-methodology1]()
Primary Research
Extensive primary research was conducted to gain a deeper insight of the market and industry performance. The analysis is based on both primary and secondary research as well as years of professional expertise in the respective industries.
In addition to analysing current and historical trends, our analysts predict where the market is headed over the next five years.
It varies by segment for these categories geographically presented in the list of market tables. Speaking about this particular report we have conducted primary surveys (interviews) with the key level executives (VP, CEO’s, Marketing Director, Business Development Manager and many more) of the major players active in the market.
Secondary Research
Secondary research was mainly used to collect and identify information useful for the extensive, technical, market-oriented, and Friend’s study of the Global Extra Neutral Alcohol. It was also used to obtain key information about major players, market classification and segmentation according to the industry trends, geographical markets, and developments related to the market and technology perspectives. For this study, analysts have gathered information from various credible sources, such as annual reports, sec filings, journals, white papers, SOFT presentations, and company web sites.
Market Size Estimation
Both, top-down and bottom-up approaches were used to estimate and validate the size of the Global market and to estimate the size of various other dependent submarkets in the overall Extra Neutral Alcohol. The key players in the market were identified through secondary research and their market contributions in the respective geographies were determined through primary and secondary research.
Forecast Model
![research-methodology2]()