Non Contact Metrology System Market Overview and Analysis

  • The Global Non-Contact Metrology System Market size was estimated at USD 852.3 million in 2024 and is projected to reach USD 1259.8 million by 2030.

Non Contact Metrology System Market

Get Complete Analysis Of The Report - Download Updated Free Sample PDF

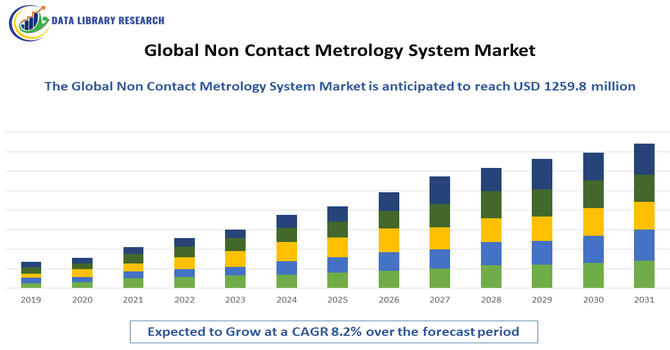
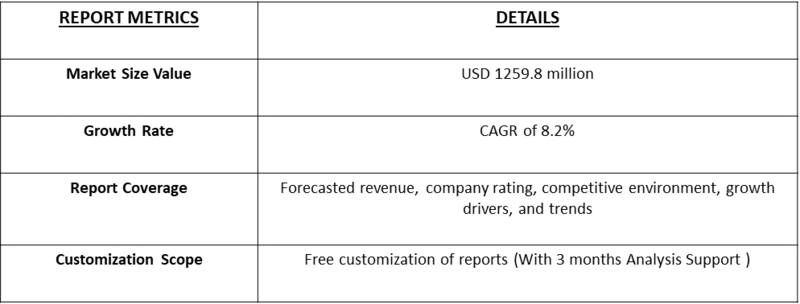
The Global Non-Contact Metrology System Market refers to the worldwide industry focused on systems and technologies that measure physical dimensions, geometries, and surface properties without physically touching the object. These systems use optical, laser, white light, or structured-light techniques to provide high-precision measurements for quality control, inspection, and reverse engineering. The market is driven by increasing demand from automotive, aerospace, electronics, medical devices, and industrial manufacturing sectors for accurate, fast, and non-destructive measurement solutions.

Non Contact Metrology System Market Latest Trends

The global non-contact metrology system market is growing rapidly due to increasing demand for faster, more precise, and non-destructive measurement solutions. Industries like automotive, aerospace, electronics, and medical devices are adopting optical, laser, and 3D scanning systems to improve quality control and productivity. Smart factories and automation are driving integration of non-contact metrology into manufacturing lines. Portable and compact systems are also gaining popularity for on-site measurements.

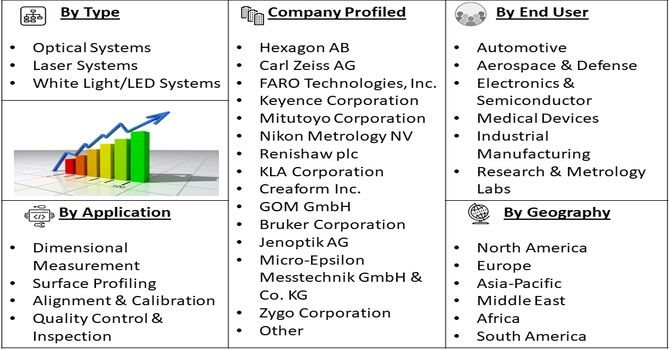
Segmentation: The Global Non-Contact Metrology System Market is segmented by Type (Optical Systems, Laser Systems and White Light/LED Systems), Technology (Portable Systems, Stationary/Fixed Systems and Automated Systems), Application (Dimensional Measurement, Surface Profiling, Alignment & Calibration and Quality Control & Inspection), End-Use Industry (Automotive, Aerospace & Defense, Electronics & Semiconductor, Medical Devices, Industrial Manufacturing, and Research & Metrology Labs), and Geography (North America, Europe, Asia-Pacific, Middle East and Africa, and South America). The report provides the value (in USD million) for the above segments.

Non Contact Metrology System Market segment

For Detailed Market Segmentation - Get a Free Sample PDF
 

Market Drivers:

  • Increasing Demand for Precision and Quality Control

The rising demand for precision and quality control across industries is a major driver of the global non-contact metrology system market. Automotive, aerospace, electronics, and medical device sectors require extremely accurate measurements to ensure product reliability, safety, and compliance with strict standards. Non-contact systems allow high-resolution, non-destructive measurement of complex surfaces and components, reducing errors and material waste. As products become smaller, more complex, and technologically advanced, the need for precise measurement solutions has intensified. Companies are investing in these systems to improve production efficiency, maintain high-quality standards, and minimize costly defects, fueling market growth globally.

  • Adoption of Automation and Smart Manufacturing

The increasing adoption of automation and Industry 4.0 practices is driving growth in the non-contact metrology system market. Modern manufacturing environments require high-speed, accurate, and repeatable measurements, which non-contact systems provide without disrupting production lines. Integration with robotic systems, smart factories, and data analytics platforms allows real-time quality monitoring, predictive maintenance, and process optimization. Automated non-contact metrology reduces human intervention, enhances productivity, and ensures consistent product quality. As industries worldwide prioritize efficiency and precision, demand for these systems continues to rise. The trend toward digitalization and smart manufacturing directly supports the expansion of the non-contact metrology market.

Market Restraints:

  • High Cost and Technical Complexity

High cost and technical complexity are key restraints limiting the adoption of non-contact metrology systems. Advanced laser, optical, and 3D scanning technologies involve significant initial investment, making them less accessible to small and medium-sized enterprises. Operation and maintenance often require specialized skills, software knowledge, and trained personnel, increasing overall operational costs. Additionally, calibration and integration into existing production lines can be challenging, slowing adoption in price-sensitive markets. Limited awareness of the technology and infrastructure requirements in developing regions further restrict growth. These factors can delay purchase decisions, encouraging some companies to rely on conventional contact-based metrology or lower-cost alternatives.

Socioeconomic Impact on Non Contact Metrology System Market

Non-contact metrology systems positively impact society and the economy by improving manufacturing quality, reducing waste, and enhancing product safety. Faster and more accurate measurements reduce production errors, saving costs and resources. The technology encourages the development of high-tech jobs, requiring skilled operators and engineers, which boosts workforce expertise. By enabling precise production of electronics, automotive parts, medical devices, and aerospace components, these systems support industrial growth and innovation. They also facilitate export competitiveness for countries adopting advanced manufacturing. Thus, non-contact metrology promotes efficiency, sustainability, and technological advancement, contributing to economic growth and industrial modernization globally.

Segmental Analysis:

  • Laser Systems segment is expected to witness highest growth over the forecast period

The laser systems segment is expected to witness the highest growth over the forecast period due to its superior precision, speed, and ability to measure complex geometries. Industries such as automotive, aerospace, and electronics require highly accurate non-contact measurements, which laser-based systems provide through triangulation, interferometry, and scanning techniques. These systems offer high-resolution data, real-time measurements, and minimal risk of damage to delicate components. Advancements in laser technology, including improved sensors and integration with software for automated inspection, are further driving adoption. As manufacturing demands tighter tolerances and faster production cycles, laser systems are becoming increasingly essential.

  • Portable Systems segment is expected to witness highest growth over the forecast period

The portable systems segment is expected to witness the highest growth over the forecast period due to the rising need for on-site, flexible, and easy-to-use measurement solutions. Portable non-contact metrology devices allow engineers and inspectors to measure large structures, assemblies, and hard-to-reach areas without relocating parts. They are particularly useful in aerospace, construction, and automotive industries, where mobility and quick setup are critical. Advances in lightweight designs, handheld scanners, and battery-powered devices enhance usability. The convenience, efficiency, and cost-effectiveness of portable systems make them highly attractive for field inspections, maintenance, and quality control, driving strong market growth.

  • Dimensional Measurement segment is expected to witness highest growth over the forecast period

The dimensional measurement segment is expected to witness the highest growth over the forecast period as precise measurement of component dimensions becomes increasingly critical across industries. Non-contact systems can quickly and accurately measure lengths, widths, heights, and geometrical tolerances without touching or damaging delicate parts. Sectors such as automotive, electronics, and aerospace rely heavily on dimensional accuracy for assembly, safety, and performance. The adoption of 3D scanning, laser triangulation, and advanced software allows rapid data capture and analysis. Increasing product complexity and the demand for zero-defect manufacturing are accelerating the adoption of non-contact dimensional measurement solutions globally.

  • Electronics & Semiconductor, segment is expected to witness highest growth over the forecast period

The electronics and semiconductor segment is expected to witness the highest growth over the forecast period due to the critical need for high-precision measurements in chip and device manufacturing. Non-contact metrology systems are ideal for measuring small, fragile components, wafer surfaces, and microstructures without causing damage. Rapid miniaturization, advanced packaging, and complex circuit layouts demand highly accurate inspection to ensure quality and yield. Integration with automated production lines and data analysis tools allows real-time monitoring and process control. The growing demand for consumer electronics, high-performance computing, and 5G technologies further accelerates the adoption of non-contact metrology in this sector.

  • North America Region is expected to witness highest growth over the forecast period

North America is expected to witness the highest growth in the global non-contact metrology system market over the forecast period, driven by strong industrialization, technological innovation, and high adoption of advanced manufacturing.

The region hosts leading automotive, aerospace, electronics, and semiconductor industries that require precise measurement and inspection tools. Investments in smart manufacturing, automation, and quality control systems are accelerating the adoption of non-contact metrology. For instance, in January 2026, Laser Photonics Corporation secured a USD 500,000 order from a U.S. power utility for three CleanTech laser cleaning systems, replacing traditional media blasting methods. This adoption highlighted the growing reliance on precise, efficient, and non-contact laser technologies in industrial operations, positively impacting North America’s non-contact metrology system market by driving demand for high-precision, environmentally friendly laser measurement and inspection solutions.

Additionally, a supportive regulatory environment and high R&D expenditure promote the development of advanced metrology solutions. North America’s emphasis on productivity, efficiency, and innovation positions it as a key growth hub for this market.

Non Contact Metrology System Market table

To Learn More About This Report - Request a Free Sample Copy

Non Contact Metrology System Market Competitive Landscape

The global non-contact metrology system market is highly competitive, with key players focusing on technological innovation, product accuracy, and customer service. Major companies include Hexagon AB, Nikon Metrology, Keyence Corporation, Mitutoyo, Zeiss Group, Faro Technologies, Cognex Corporation, and Renishaw. Competition revolves around developing systems with higher precision, faster processing, 3D scanning capabilities, and integration with automated production lines. Companies are also expanding geographically and collaborating with industrial clients to offer tailored solutions. Price competitiveness, after-sales service, and software enhancements play a critical role in gaining market share. Continuous R&D ensures new technologies and applications drive the market forward.

The major players for above market are:

  • Hexagon AB
  • Carl Zeiss AG
  • FARO Technologies, Inc.
  • Keyence Corporation
  • Mitutoyo Corporation
  • Nikon Metrology NV
  • Renishaw plc
  • KLA Corporation
  • Creaform Inc.
  • GOM GmbH
  • Bruker Corporation
  • Jenoptik AG
  • Micro-Epsilon Messtechnik GmbH & Co. KG
  • Zygo Corporation
  • Leica Geosystems AG
  • Ophir Optronics Solutions Ltd.
  • LMI Technologies Inc.
  • InnovMetric Software Inc.
  • Perceptron, Inc.
  • Automated Precision Inc. (API)

Recent Development

  • In January 2026, Lotus Laser Systems exhibited its latest laser technology at the PPAI convention in Las Vegas. The showcase featured two flagship machines: the Meta-C UV, delivering flawless engraving on glass and plastic, and the Meta-XY, enabling ultra-precise, fully automated mass production with a 27” x 20” work area.


  • In January 2026, Rheinmetall and MBDA planned a joint venture in Germany for naval laser activities, building on their cooperation since 2019. The venture focused on developing advanced laser systems for defense applications. This advancement indirectly influenced the global non-contact metrology system market by driving demand for high-precision laser measurement, testing, and calibration technologies used in developing and validating these sophisticated laser weapons.


Frequently Asked Questions (FAQ) :

Q1. What are the main growth-driving factors for this market?

The surge in Industry 4.0 and smart manufacturing drives demand for rapid, high-precision inspection. Industries like aerospace and automotive prioritize non-contact systems to prevent damage to delicate surfaces. Furthermore, the rising complexity of miniature electronics requires the high-speed data acquisition that laser and optical scanners provide over traditional contact methods.

Q2. What are the main restraining factors for this market?

The high initial investment for laser scanners and 3D sensors poses a significant challenge for small-to-medium enterprises. Additionally, non-contact systems can struggle with transparent, highly reflective, or deep-cavity surfaces, often requiring expensive software or coatings. A lack of standardized global protocols for different optical technologies further complicates widespread industrial adoption.

Q3. Which segment is expected to witness high growth?

The Laser Systems segment is poised for rapid growth due to its versatility in reverse engineering and quality control. These systems offer unparalleled speed in capturing complex geometries across the automotive and medical sectors. As portable laser trackers become more affordable and accurate, their integration into automated assembly lines increases.

Q4. Who are the top major players for this market?

The market is led by global metrology giants including Hexagon AB, ZEISS Group, and Keyence Corporation. Other influential players include Nikon Metrology, Mitutoyo Corporation, FARO Technologies, and GOM GmbH. These companies dominate through continuous innovation in sensor fusion, high-speed optical processing, and integrated software solutions for real-time data analysis.

Q5. Which country is the largest player?

The United States currently holds the position of the largest market player. This leadership is fueled by early adoption in the defense and aerospace sectors, alongside massive R&D investments in automation. The presence of major technology providers and a robust manufacturing base focused on high-value, complex components sustains its market-leading status.

Non Contact Metrology System MARKET STUDY GLOBAL MARKET ANALYSIS, INSIGHTS AND FORECAST, 2022-2029

    1. Introduction

    • 1.1. Research Scope
    • 1.2. Market Segmentation
    • 1.3. Research Methodology
    • 1.4. Definitions and Assumptions

    2. Executive Summary

      3. Market Dynamics

      • 3.1. Market Drivers
      • 3.2. Market Restraints
      • 3.3. Market Opportunities

      4. Key Insights

      • 4.1. Key Emerging Trends – For Major Countries
      • 4.2. Latest Technological Advancement
      • 4.3. Regulatory Landscape
      • 4.4. Industry SWOT Analysis
      • 4.5. Porters Five Forces Analysis

      5. Global Non Contact Metrology System Market Analysis (USD Billion), Insights and Forecast, 2018-2029

      • 5.1. Key Findings / Summary
      • 5.2. Market Analysis, Insights and Forecast – By Segment 1
        • 5.2.1. Sub-Segment 1
        • 5.2.2. Sub-Segment 2
      • 5.3. Market Analysis, Insights and Forecast – By Segment 2
        • 5.3.1. Sub-Segment 1
        • 5.3.2. Sub-Segment 2
        • 5.3.3. Sub-Segment 3
        • 5.3.4. Others
      • 5.4. Market Analysis, Insights and Forecast – By Segment 3
        • 5.4.1. Sub-Segment 1
        • 5.4.2. Sub-Segment 2
        • 5.4.3. Sub-Segment 3
        • 5.4.4. Others
      • 5.5. Market Analysis, Insights and Forecast – By Region
        • 5.5.1. North America
        • 5.5.2. Latin America
        • 5.5.3. Europe
        • 5.5.4. Asia Pacific
        • 5.5.5. Middle East and Africa

      6. North America Non Contact Metrology System Market Analysis (USD Billion), Insights and Forecast, 2018-2029

      • 6.1. Key Findings / Summary
      • 6.2. Market Analysis, Insights and Forecast – By Segment 1
        • 6.2.1. Sub-Segment 1
        • 6.2.2. Sub-Segment 2
      • 6.3. Market Analysis, Insights and Forecast – By Segment 2
        • 6.3.1. Sub-Segment 1
        • 6.3.2. Sub-Segment 2
        • 6.3.3. Sub-Segment 3
        • 6.3.4. Others
      • 6.4. Market Analysis, Insights and Forecast – By Segment 3
        • 6.4.1. Sub-Segment 1
        • 6.4.2. Sub-Segment 2
        • 6.4.3. Sub-Segment 3
        • 6.4.4. Others
      • 6.5. Market Analysis, Insights and Forecast – By Country
        • 6.5.1. U.S.
        • 6.5.2. Canada

      7. Latin America Non Contact Metrology System Market Analysis (USD Billion), Insights and Forecast, 2018-2029

      • 7.1. Key Findings / Summary
      • 7.2. Market Analysis, Insights and Forecast – By Segment 1
        • 7.2.1. Sub-Segment 1
        • 7.2.2. Sub-Segment 2
      • 7.3. Market Analysis, Insights and Forecast – By Segment 2
        • 7.3.1. Sub-Segment 1
        • 7.3.2. Sub-Segment 2
        • 7.3.3. Sub-Segment 3
        • 7.3.4. Others
      • 7.4. Market Analysis, Insights and Forecast – By Segment 3
        • 7.4.1. Sub-Segment 1
        • 7.4.2. Sub-Segment 2
        • 7.4.3. Sub-Segment 3
        • 7.4.4. Others
      • 7.5. Insights and Forecast – By Country
        • 7.5.1. Brazil
        • 7.5.2. Mexico
        • 7.5.3. Rest of Latin America

      8. Europe Non Contact Metrology System Market Analysis (USD Billion), Insights and Forecast, 2018-2029

      • 8.1. Key Findings / Summary
      • 8.2. Market Analysis, Insights and Forecast – By Segment 1
        • 8.2.1. Sub-Segment 1
        • 8.2.2. Sub-Segment 2
      • 8.3. Market Analysis, Insights and Forecast – By Segment 2
        • 8.3.1. Sub-Segment 1
        • 8.3.2. Sub-Segment 2
        • 8.3.3. Sub-Segment 3
        • 8.3.4. Others
      • 8.4. Market Analysis, Insights and Forecast – By Segment 3
        • 8.4.1. Sub-Segment 1
        • 8.4.2. Sub-Segment 2
        • 8.4.3. Sub-Segment 3
        • 8.4.4. Others
      • 8.5. Market Analysis, Insights and Forecast – By Country
        • 8.5.1. UK
        • 8.5.2. Germany
        • 8.5.3. France
        • 8.5.4. Italy
        • 8.5.5. Spain
        • 8.5.6. Russia
        • 8.5.7. Rest of Europe

      9. Asia Pacific Non Contact Metrology System Market Analysis (USD Billion), Insights and Forecast, 2018-2029

      • 9.1. Key Findings / Summary
      • 9.2. Market Analysis, Insights and Forecast – By Segment 1
        • 9.2.1. Sub-Segment 1
        • 9.2.2. Sub-Segment 2
      • 9.3. Market Analysis, Insights and Forecast – By Segment 2
        • 9.3.1. Sub-Segment 1
        • 9.3.2. Sub-Segment 2
        • 9.3.3. Sub-Segment 3
        • 9.3.4. Others
      • 9.4. Market Analysis, Insights and Forecast – By Segment 3
        • 9.4.1. Sub-Segment 1
        • 9.4.2. Sub-Segment 2
        • 9.4.3. Sub-Segment 3
        • 9.4.4. Others
      • 9.5. Market Analysis, Insights and Forecast – By Country
        • 9.5.1. China
        • 9.5.2. India
        • 9.5.3. Japan
        • 9.5.4. Australia
        • 9.5.5. South East Asia
        • 9.5.6. Rest of Asia Pacific

      10. Middle East & Africa Non Contact Metrology System Market Analysis (USD Billion), Insights and Forecast, 2018-2029

      • 10.1. Key Findings / Summary
      • 10.2. Market Analysis, Insights and Forecast – By Segment 1
        • 10.2.1. Sub-Segment 1
        • 10.2.2. Sub-Segment 2
      • 10.3. Market Analysis, Insights and Forecast – By Segment 2
        • 10.3.1. Sub-Segment 1
        • 10.3.2. Sub-Segment 2
        • 10.3.3. Sub-Segment 3
        • 10.3.4. Others
      • 10.4. Market Analysis, Insights and Forecast – By Segment 3
        • 10.4.1. Sub-Segment 1
        • 10.4.2. Sub-Segment 2
        • 10.4.3. Sub-Segment 3
        • 10.4.4. Others
      • 10.5. Market Analysis, Insights and Forecast – By Country
        • 10.5.1. GCC
        • 10.5.2. South Africa
        • 10.5.3. Rest of Middle East & Africa

      11. Competitive Analysis

      • 11.1. Company Market Share Analysis, 2018
      • 11.2. Key Industry Developments
      • 11.3. Company Profile
        • 11.3.1. Company 1
          • 11.3.1.1. Business Overview
          • 11.3.1.2. Segment 1 & Service Offering
          • 11.3.1.3. Overall Revenue
          • 11.3.1.4. Geographic Presence
          • 11.3.1.5. Recent Development
        *Similar details will be provided for the following companies
        • 11.3.2. Company 2
        • 11.3.3. Company 3
        • 11.3.4. Company 4
        • 11.3.5. Company 5
        • 11.3.6. Company 6
        • 11.3.7. Company 7
        • 11.3.8. Company 8
        • 11.3.9. Company 9
        • 11.3.10. Company 10
        • 11.3.11. Company 11
        • 11.3.12. Company 12
      List of Figures

      Figure 1: Global Non Contact Metrology System Market Revenue Breakdown (USD Billion, %) by Region, 2022 & 2029
      Figure 2: Global Non Contact Metrology System Market Value Share (%), By Segment 1, 2022 & 2029
      Figure 3: Global Non Contact Metrology System Market Forecast (USD Billion), by Sub-Segment 1, 2018-2029
      Figure 4: Global Non Contact Metrology System Market Forecast (USD Billion), by Sub-Segment 2, 2018-2029
      Figure 5: Global Non Contact Metrology System Market Value Share (%), By Segment 2, 2022 & 2029
      Figure 6: Global Non Contact Metrology System Market Forecast (USD Billion), by Sub-Segment 1, 2018-2029
      Figure 7: Global Non Contact Metrology System Market Forecast (USD Billion), by Sub-Segment 2, 2018-2029
      Figure 8: Global Non Contact Metrology System Market Forecast (USD Billion), by Sub-Segment 3, 2018-2029
      Figure 9: Global Non Contact Metrology System Market Forecast (USD Billion), by Others, 2018-2029
      Figure 10: Global Non Contact Metrology System Market Value Share (%), By Segment 3, 2022 & 2029
      Figure 11: Global Non Contact Metrology System Market Forecast (USD Billion), by Sub-Segment 1, 2018-2029
      Figure 12: Global Non Contact Metrology System Market Forecast (USD Billion), by Sub-Segment 2, 2018-2029
      Figure 13: Global Non Contact Metrology System Market Forecast (USD Billion), by Sub-Segment 3, 2018-2029
      Figure 14: Global Non Contact Metrology System Market Forecast (USD Billion), by Others, 2018-2029
      Figure 15: Global Non Contact Metrology System Market Value (USD Billion), by Region, 2022 & 2029
      Figure 16: North America Non Contact Metrology System Market Value Share (%), By Segment 1, 2022 & 2029
      Figure 17: North America Non Contact Metrology System Market Forecast (USD Billion), by Sub-Segment 1, 2018-2029
      Figure 18: North America Non Contact Metrology System Market Forecast (USD Billion), by Sub-Segment 2, 2018-2029
      Figure 19: North America Non Contact Metrology System Market Value Share (%), By Segment 2, 2022 & 2029
      Figure 20: North America Non Contact Metrology System Market Forecast (USD Billion), by Sub-Segment 1, 2018-2029
      Figure 21: North America Non Contact Metrology System Market Forecast (USD Billion), by Sub-Segment 2, 2018-2029
      Figure 22: North America Non Contact Metrology System Market Forecast (USD Billion), by Sub-Segment 3, 2018-2029
      Figure 23: North America Non Contact Metrology System Market Forecast (USD Billion), by Others, 2018-2029
      Figure 24: North America Non Contact Metrology System Market Value Share (%), By Segment 3, 2022 & 2029
      Figure 25: North America Non Contact Metrology System Market Forecast (USD Billion), by Sub-Segment 1, 2018-2029
      Figure 26: North America Non Contact Metrology System Market Forecast (USD Billion), by Sub-Segment 2, 2018-2029
      Figure 27: North America Non Contact Metrology System Market Forecast (USD Billion), by Sub-Segment 3, 2018-2029
      Figure 28: North America Non Contact Metrology System Market Forecast (USD Billion), by Others, 2018-2029
      Figure 29: North America Non Contact Metrology System Market Forecast (USD Billion), by U.S., 2018-2029
      Figure 30: North America Non Contact Metrology System Market Forecast (USD Billion), by Canada, 2018-2029
      Figure 31: Latin America Non Contact Metrology System Market Value Share (%), By Segment 1, 2022 & 2029
      Figure 32: Latin America Non Contact Metrology System Market Forecast (USD Billion), by Sub-Segment 1, 2018-2029
      Figure 33: Latin America Non Contact Metrology System Market Forecast (USD Billion), by Sub-Segment 2, 2018-2029
      Figure 34: Latin America Non Contact Metrology System Market Value Share (%), By Segment 2, 2022 & 2029
      Figure 35: Latin America Non Contact Metrology System Market Forecast (USD Billion), by Sub-Segment 1, 2018-2029
      Figure 36: Latin America Non Contact Metrology System Market Forecast (USD Billion), by Sub-Segment 2, 2018-2029
      Figure 37: Latin America Non Contact Metrology System Market Forecast (USD Billion), by Sub-Segment 3, 2018-2029
      Figure 38: Latin America Non Contact Metrology System Market Forecast (USD Billion), by Others, 2018-2029
      Figure 39: Latin America Non Contact Metrology System Market Value Share (%), By Segment 3, 2022 & 2029
      Figure 40: Latin America Non Contact Metrology System Market Forecast (USD Billion), by Sub-Segment 1, 2018-2029
      Figure 41: Latin America Non Contact Metrology System Market Forecast (USD Billion), by Sub-Segment 2, 2018-2029
      Figure 42: Latin America Non Contact Metrology System Market Forecast (USD Billion), by Sub-Segment 3, 2018-2029
      Figure 43: Latin America Non Contact Metrology System Market Forecast (USD Billion), by Others, 2018-2029
      Figure 44: Latin America Non Contact Metrology System Market Forecast (USD Billion), by Brazil, 2018-2029
      Figure 45: Latin America Non Contact Metrology System Market Forecast (USD Billion), by Mexico, 2018-2029
      Figure 46: Latin America Non Contact Metrology System Market Forecast (USD Billion), by Rest of Latin America, 2018-2029
      Figure 47: Europe Non Contact Metrology System Market Value Share (%), By Segment 1, 2022 & 2029
      Figure 48: Europe Non Contact Metrology System Market Forecast (USD Billion), by Sub-Segment 1, 2018-2029
      Figure 49: Europe Non Contact Metrology System Market Forecast (USD Billion), by Sub-Segment 2, 2018-2029
      Figure 50: Europe Non Contact Metrology System Market Value Share (%), By Segment 2, 2022 & 2029
      Figure 51: Europe Non Contact Metrology System Market Forecast (USD Billion), by Sub-Segment 1, 2018-2029
      Figure 52: Europe Non Contact Metrology System Market Forecast (USD Billion), by Sub-Segment 2, 2018-2029
      Figure 53: Europe Non Contact Metrology System Market Forecast (USD Billion), by Sub-Segment 3, 2018-2029
      Figure 54: Europe Non Contact Metrology System Market Forecast (USD Billion), by Others, 2018-2029
      Figure 55: Europe Non Contact Metrology System Market Value Share (%), By Segment 3, 2022 & 2029
      Figure 56: Europe Non Contact Metrology System Market Forecast (USD Billion), by Sub-Segment 1, 2018-2029
      Figure 57: Europe Non Contact Metrology System Market Forecast (USD Billion), by Sub-Segment 2, 2018-2029
      Figure 58: Europe Non Contact Metrology System Market Forecast (USD Billion), by Sub-Segment 3, 2018-2029
      Figure 59: Europe Non Contact Metrology System Market Forecast (USD Billion), by Others, 2018-2029
      Figure 60: Europe Non Contact Metrology System Market Forecast (USD Billion), by U.K., 2018-2029
      Figure 61: Europe Non Contact Metrology System Market Forecast (USD Billion), by Germany, 2018-2029
      Figure 62: Europe Non Contact Metrology System Market Forecast (USD Billion), by France, 2018-2029
      Figure 63: Europe Non Contact Metrology System Market Forecast (USD Billion), by Italy, 2018-2029
      Figure 64: Europe Non Contact Metrology System Market Forecast (USD Billion), by Spain, 2018-2029
      Figure 65: Europe Non Contact Metrology System Market Forecast (USD Billion), by Russia, 2018-2029
      Figure 66: Europe Non Contact Metrology System Market Forecast (USD Billion), by Rest of Europe, 2018-2029
      Figure 67: Asia Pacific Non Contact Metrology System Market Value Share (%), By Segment 1, 2022 & 2029
      Figure 68: Asia Pacific Non Contact Metrology System Market Forecast (USD Billion), by Sub-Segment 1, 2018-2029
      Figure 69: Asia Pacific Non Contact Metrology System Market Forecast (USD Billion), by Sub-Segment 2, 2018-2029
      Figure 70: Asia Pacific Non Contact Metrology System Market Value Share (%), By Segment 2, 2022 & 2029
      Figure 71: Asia Pacific Non Contact Metrology System Market Forecast (USD Billion), by Sub-Segment 1, 2018-2029
      Figure 72: Asia Pacific Non Contact Metrology System Market Forecast (USD Billion), by Sub-Segment 2, 2018-2029
      Figure 73: Asia Pacific Non Contact Metrology System Market Forecast (USD Billion), by Sub-Segment 3, 2018-2029
      Figure 74: Asia Pacific Non Contact Metrology System Market Forecast (USD Billion), by Others, 2018-2029
      Figure 75: Asia Pacific Non Contact Metrology System Market Value Share (%), By Segment 3, 2022 & 2029
      Figure 76: Asia Pacific Non Contact Metrology System Market Forecast (USD Billion), by Sub-Segment 1, 2018-2029
      Figure 77: Asia Pacific Non Contact Metrology System Market Forecast (USD Billion), by Sub-Segment 2, 2018-2029
      Figure 78: Asia Pacific Non Contact Metrology System Market Forecast (USD Billion), by Sub-Segment 3, 2018-2029
      Figure 79: Asia Pacific Non Contact Metrology System Market Forecast (USD Billion), by Others, 2018-2029
      Figure 80: Asia Pacific Non Contact Metrology System Market Forecast (USD Billion), by China, 2018-2029
      Figure 81: Asia Pacific Non Contact Metrology System Market Forecast (USD Billion), by India, 2018-2029
      Figure 82: Asia Pacific Non Contact Metrology System Market Forecast (USD Billion), by Japan, 2018-2029
      Figure 83: Asia Pacific Non Contact Metrology System Market Forecast (USD Billion), by Australia, 2018-2029
      Figure 84: Asia Pacific Non Contact Metrology System Market Forecast (USD Billion), by Southeast Asia, 2018-2029
      Figure 85: Asia Pacific Non Contact Metrology System Market Forecast (USD Billion), by Rest of Asia Pacific, 2018-2029
      Figure 86: Middle East & Africa Non Contact Metrology System Market Value Share (%), By Segment 1, 2022 & 2029
      Figure 87: Middle East & Africa Non Contact Metrology System Market Forecast (USD Billion), by Sub-Segment 1, 2018-2029
      Figure 88: Middle East & Africa Non Contact Metrology System Market Forecast (USD Billion), by Sub-Segment 2, 2018-2029
      Figure 89: Middle East & Africa Non Contact Metrology System Market Value Share (%), By Segment 2, 2022 & 2029
      Figure 90: Middle East & Africa Non Contact Metrology System Market Forecast (USD Billion), by Sub-Segment 1, 2018-2029
      Figure 91: Middle East & Africa Non Contact Metrology System Market Forecast (USD Billion), by Sub-Segment 2, 2018-2029
      Figure 92: Middle East & Africa Non Contact Metrology System Market Forecast (USD Billion), by Sub-Segment 3, 2018-2029
      Figure 93: Middle East & Africa Non Contact Metrology System Market Forecast (USD Billion), by Others, 2018-2029
      Figure 94: Middle East & Africa Non Contact Metrology System Market Value Share (%), By Segment 3, 2022 & 2029
      Figure 95: Middle East & Africa Non Contact Metrology System Market Forecast (USD Billion), by Sub-Segment 1, 2018-2029
      Figure 96: Middle East & Africa Non Contact Metrology System Market Forecast (USD Billion), by Sub-Segment 2, 2018-2029
      Figure 97: Middle East & Africa Non Contact Metrology System Market Forecast (USD Billion), by Sub-Segment 3, 2018-2029
      Figure 98: Middle East & Africa Non Contact Metrology System Market Forecast (USD Billion), by Others, 2018-2029
      Figure 99: Middle East & Africa Non Contact Metrology System Market Forecast (USD Billion), by GCC, 2018-2029
      Figure 100: Middle East & Africa Non Contact Metrology System Market Forecast (USD Billion), by South Africa, 2018-2029
      Figure 101: Middle East & Africa Non Contact Metrology System Market Forecast (USD Billion), by Rest of Middle East & Africa, 2018-2029 
      List of Tables
      Table 1: Global Non Contact Metrology System Market Revenue (USD Billion) Forecast, by Segment 1, 2018-2029
      Table 2: Global Non Contact Metrology System Market Revenue (USD Billion) Forecast, by Segment 2, 2018-2029
      Table 3: Global Non Contact Metrology System Market Revenue (USD Billion) Forecast, by Segment 3, 2018-2029
      Table 4: Global Non Contact Metrology System Market Revenue (USD Billion) Forecast, by Region, 2018-2029
      Table 5: North America Non Contact Metrology System Market Revenue (USD Billion) Forecast, by Segment 1, 2018-2029
      Table 6: North America Non Contact Metrology System Market Revenue (USD Billion) Forecast, by Segment 2, 2018-2029
      Table 7: North America Non Contact Metrology System Market Revenue (USD Billion) Forecast, by Segment 3, 2018-2029
      Table 8: North America Non Contact Metrology System Market Revenue (USD Billion) Forecast, by Country, 2018-2029
      Table 9: Europe Non Contact Metrology System Market Revenue (USD Billion) Forecast, by Segment 1, 2018-2029
      Table 10: Europe Non Contact Metrology System Market Revenue (USD Billion) Forecast, by Segment 2, 2018-2029
      Table 11: Europe Non Contact Metrology System Market Revenue (USD Billion) Forecast, by Segment 3, 2018-2029
      Table 12: Europe Non Contact Metrology System Market Revenue (USD Billion) Forecast, by Country, 2018-2029
      Table 13: Latin America Non Contact Metrology System Market Revenue (USD Billion) Forecast, by Segment 1, 2018-2029
      Table 14: Latin America Non Contact Metrology System Market Revenue (USD Billion) Forecast, by Segment 2, 2018-2029
      Table 15: Latin America Non Contact Metrology System Market Revenue (USD Billion) Forecast, by Segment 3, 2018-2029
      Table 16: Latin America Non Contact Metrology System Market Revenue (USD Billion) Forecast, by Country, 2018-2029
      Table 17: Asia Pacific Non Contact Metrology System Market Revenue (USD Billion) Forecast, by Segment 1, 2018-2029
      Table 18: Asia Pacific Non Contact Metrology System Market Revenue (USD Billion) Forecast, by Segment 2, 2018-2029
      Table 19: Asia Pacific Non Contact Metrology System Market Revenue (USD Billion) Forecast, by Segment 3, 2018-2029
      Table 20: Asia Pacific Non Contact Metrology System Market Revenue (USD Billion) Forecast, by Country, 2018-2029
      Table 21: Middle East & Africa Non Contact Metrology System Market Revenue (USD Billion) Forecast, by Segment 1, 2018-2029
      Table 22: Middle East & Africa Non Contact Metrology System Market Revenue (USD Billion) Forecast, by Segment 2, 2018-2029
      Table 23: Middle East & Africa Non Contact Metrology System Market Revenue (USD Billion) Forecast, by Segment 3, 2018-2029
      Table 24: Middle East & Africa Non Contact Metrology System Market Revenue (USD Billion) Forecast, by Country, 2018-2029
      Research Process

      Data Library Research are conducted by industry experts who offer insight on industry structure, market segmentations technology assessment and competitive landscape (CL), and penetration, as well as on emerging trends. Their analysis is based on primary interviews (~ 80%) and secondary research (~ 20%) as well as years of professional expertise in their respective industries. Adding to this, by analysing historical trends and current market positions, our analysts predict where the market will be headed for the next five years. Furthermore, the varying trends of segment & categories geographically presented are also studied and the estimated based on the primary & secondary research.

      In this particular report from the supply side Data Library Research has conducted primary surveys (interviews) with the key level executives (VP, CEO’s, Marketing Director, Business Development Manager and SOFT) of the companies that active & prominent as well as the midsized organization

      FIGURE 1: DLR RESEARH PROCESS

      research-methodology1

      Primary Research

      Extensive primary research was conducted to gain a deeper insight of the market and industry performance. The analysis is based on both primary and secondary research as well as years of professional expertise in the respective industries.

      In addition to analysing current and historical trends, our analysts predict where the market is headed over the next five years.

      It varies by segment for these categories geographically presented in the list of market tables. Speaking about this particular report we have conducted primary surveys (interviews) with the key level executives (VP, CEO’s, Marketing Director, Business Development Manager and many more) of the major players active in the market.

      Secondary Research

      Secondary research was mainly used to collect and identify information useful for the extensive, technical, market-oriented, and Friend’s study of the Global Extra Neutral Alcohol. It was also used to obtain key information about major players, market classification and segmentation according to the industry trends, geographical markets, and developments related to the market and technology perspectives. For this study, analysts have gathered information from various credible sources, such as annual reports, sec filings, journals, white papers, SOFT presentations, and company web sites.

      Market Size Estimation

      Both, top-down and bottom-up approaches were used to estimate and validate the size of the Global market and to estimate the size of various other dependent submarkets in the overall Extra Neutral Alcohol. The key players in the market were identified through secondary research and their market contributions in the respective geographies were determined through primary and secondary research.

      Forecast Model

      research-methodology2