EV Battery Diagnosis Service Market Overview and Analysis:
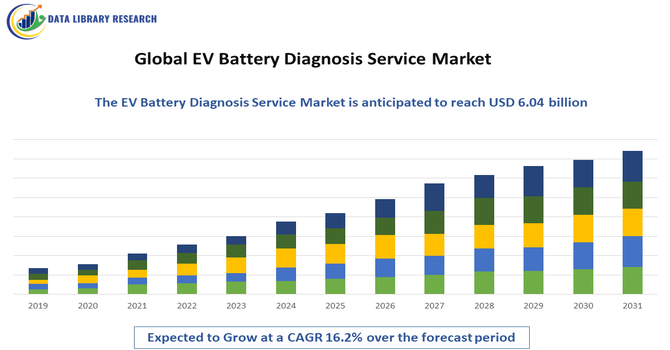
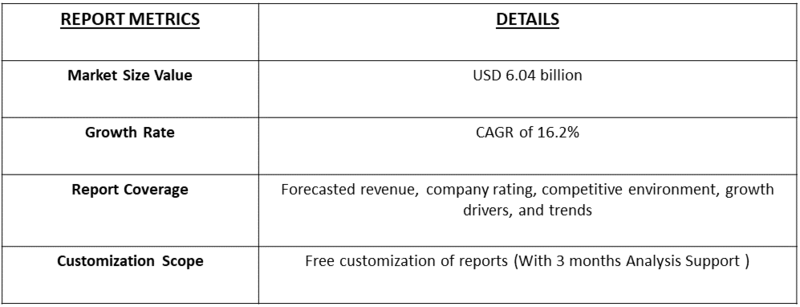
- The Global EV battery diagnostics service market is projected to grow significantly, reaching approximately USD 6.04 billion by 2032 from USD 2.98 billion in 2025, growing with a compound annual growth rate (CAGR) of about 16.2% from 2025-2032.
Get Complete Analysis Of The Report - Download Updated Free Sample PDF
The Global EV Battery Diagnosis Service Market is experiencing steady growth driven primarily by the rapid rise in electric vehicle adoption, which is increasing the need for accurate, data-driven assessment of battery health, performance, and remaining useful life. As EVs age, consumers, fleet operators, and used-vehicle marketplaces require reliable diagnostics to evaluate battery degradation, optimize charging behavior, and plan maintenance or replacements, pushing service demand upward.
Growth is further supported by the expansion of EV fleets, electrification of public transportation, and the booming secondary EV market, all of which depend heavily on transparent battery-health reporting. Additionally, advancements in battery analytics, AI-based predictive diagnostics, and cloud-integrated monitoring platforms are enabling more precise, real-time evaluations, making diagnostic services increasingly essential for OEMs, service centers, and energy-storage stakeholders.
EV Battery Diagnosis Service Market Latest Trends
The Global EV Battery Diagnosis Service Market is being driven by several emerging trends: there’s a significant shift toward AI-powered predictive analytics, where machine learning models analyze historical and real-time battery data to forecast state-of-health (SOH), remaining useful life, and potential faults, enabling proactive maintenance and better battery longevity. Fleet operators and OEMs are increasingly adopting cloud- and telematics-based diagnostic systems that facilitate over-the-air (OTA) updates, remote battery health monitoring, and real-time insights on charge/discharge behavior. Advanced second-life and circular economy practices are also gaining ground.
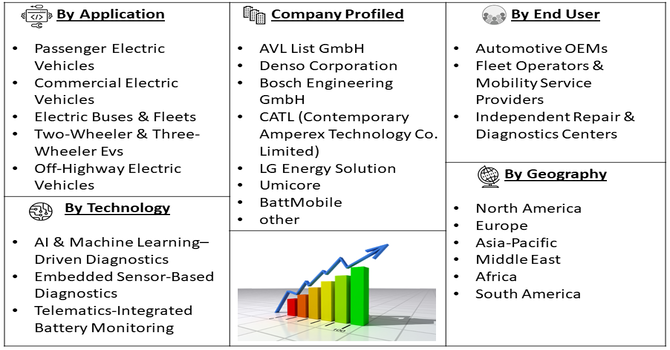
Segmentation: Global EV Battery Diagnosis Service Market is segmented By Service Type (Battery Health Assessment, Thermal Management Diagnostics, Fast-Charging Impact Assessment, Battery Lifecycle & Degradation Analysis, Predictive Maintenance and Prognostics), Diagnostic Technology (AI & Machine Learning–Driven Diagnostics, Embedded Sensor-Based Diagnostics, Telematics-Integrated Battery Monitoring), By Battery Type (Lithium-Ion Batteries, Solid-State Batteries, Nickel-Metal Hydride (NiMH) Batteries, Lithium Iron Phosphate (LFP) Batteries), Application (Passenger Electric Vehicles, Commercial Electric Vehicles, Electric Buses & Fleets, Two-Wheeler & Three-Wheeler EVs, Off-Highway Electric Vehicles), End User (Automotive OEMs, Fleet Operators & Mobility Service Providers, Independent Repair & Diagnostics Centers), and Geography (North America, Europe, Asia-Pacific, Middle East and Africa, and South America). The report provides the value (in USD million) for the above segments.
For Detailed Market Segmentation - Get a Free Sample PDF
Market Drivers:
- Rising EV Adoption and Aging EV Fleet Driving the Demand for Accurate Battery Health Assessment
As the global electric vehicle (EV) population continues to grow rapidly, battery health has become one of the most critical determinants of vehicle performance, resale value, and operational reliability. EV batteries naturally degrade over time due to factors such as charging cycles, temperature variations, and driving conditions. As a result, both individual EV owners and fleet operators increasingly require advanced diagnostic services to assess battery condition, predict remaining useful life (RUL), and manage maintenance proactively. This rising need for accurate health reporting, lifecycle analysis, and degradation forecasting is a major driver fueling the growth of EV battery diagnosis services worldwide.
- Increasing Adoption of AI, Telematics, and Predictive Analytics in Battery Monitoring
Advancements in AI-driven analytics, cloud platforms, and telematics technologies are transforming EV battery diagnostics from simple health checks into intelligent predictive maintenance systems. Modern EVs are now equipped with sophisticated sensors and telematics modules that continuously transmit battery temperature, voltage, charge-discharge cycles, and performance data. As EV manufacturers and service centers increasingly adopt connected and cloud-based diagnostic tools, the demand for advanced predictive battery diagnosis services is expanding rapidly, becoming a key growth driver for the global market.
Market Restraints:
- Lack of Standardized Diagnostic Protocols
The major restraints is the lack of standardized diagnostic protocols, as battery chemistries, management systems, and performance metrics vary significantly across EV models and manufacturers, making it difficult to create unified diagnostic frameworks that ensure accuracy and interoperability. Additionally, high implementation and service costs—particularly for advanced AI-driven diagnostic tools, cloud platforms, and sensor-integrated systems—limit adoption among small repair centers and emerging EV markets.
Segmental Analysis
- Battery Health Assessment segment is expected to witness highest growth over the forecast period
Battery Health Assessment is one of the most demanded service types, as it provides a comprehensive evaluation of battery performance, degradation level, and remaining useful life. With EV batteries accounting for nearly 40% of a vehicle’s cost, users and fleet operators rely heavily on accurate health diagnostics to ensure safety, optimize charging patterns, and maintain vehicle value. The rising second-hand EV market and growing consumer concern over battery longevity make this segment a central driver of market growth.
- AI & Machine Learning–Driven Diagnostics segment is expected to witness highest growth over the forecast period
AI & Machine Learning–Driven Diagnostics are gaining significant traction due to their ability to analyze real-time battery data, detect early anomalies, and predict future failures with high accuracy. These advanced algorithms utilize historical charging/discharging data, thermal behavior, and voltage patterns to generate actionable insights. As OEMs and fleet operators increasingly adopt predictive maintenance to reduce downtime and extend battery life, AI-enabled diagnostics are emerging as the most influential technology segment.
- Lithium-Ion Batteries segment is expected to witness highest growth over the forecast period
Lithium-Ion Batteries dominate the market as they are widely used in modern electric vehicles due to their high energy density, longer lifespan, and faster charging characteristics. Because these batteries undergo complex electrochemical changes over time, frequent diagnostic evaluations are essential to monitor degradation. The global dominance of lithium-ion technology in passenger cars, commercial EVs, and two-wheelers directly drives demand for diagnostic services tailored to this chemistry.
- Passenger Electric Vehicles segment is expected to witness highest growth over the forecast period
Passenger Electric Vehicles represent the largest application segment, driven by rising consumer EV adoption, increased awareness of battery degradation, and the need for transparency during resale. As personal vehicles age, owners increasingly rely on professional diagnostic services to assess battery performance, identify issues early, and optimize ownership costs. The rapid expansion of urban EV usage and government incentives further strengthen this segment’s growth.
- North America region is expected to witness highest growth over the forecast period
North America is expected to witness the highest growth over the forecast period, driven by the rapid expansion of electric vehicle adoption, strong regulatory support for EV infrastructure, and increasing emphasis on battery safety and performance transparency. The region’s growing fleet of passenger and commercial EVs, along with the rise of used EV transactions, is amplifying the need for reliable battery diagnostics to assess degradation and ensure optimal functioning.
Additionally, the presence of advanced technology developers, widespread integration of AI and telematics solutions, and the increasing shift toward predictive maintenance among fleet operators further support North America’s leadership in the EV battery diagnosis service market.
To Learn More About This Report - Request a Free Sample Copy
EV Battery Diagnosis Service Market Competitive Landscape:
The competitive landscape of the Global EV Battery Diagnosis Service Market features a mix of specialized battery analytics firms, telematics providers, automotive OEMs, independent diagnostics companies, and AI-based software startups. These players compete based on accuracy of diagnostics, real-time monitoring capabilities, predictive algorithms, integration with EV management systems, and quality of service.
Key Players:
- AVL List GmbH
- Denso Corporation
- Bosch Engineering GmbH
- CATL (Contemporary Amperex Technology Co. Limited)
- LG Energy Solution
- Umicore
- BattMobile
- Senseonics
- Nuvation Energy
- Neurobat
- Keyou
- Teledyne FLIR
- Fraunhofer Institute (battery diagnostics spin-offs)
- TWAICE GmbH
- Xenon Power Ltd.
- Fourth State Energy
- Vubiq Networks
- Arbin Instruments
- SAE International (EV diagnostics labs and services)
- Veryst Engineering
Recent Development
- In September 2025, Ayvens Carmarket introduced State of Health (SoH) certificates for used battery electric vehicles (BEVs) in Europe, providing detailed information on battery capacity as a percentage of its original capacity. This transparency enabled buyers and dealers to accurately assess battery condition and driving range, building trust in used EVs. The initiative strengthened the EV battery diagnosis service market by highlighting the importance of reliable battery health monitoring for resale valuation and maintenance planning.
- In May 2023, MAHLE and Midtronics, Inc. signed a Memorandum of Understanding to jointly develop service equipment for battery electric vehicles. The collaboration empowered workshops to safely and effectively perform diagnostics and maintenance on Li-ion batteries across all brands and life cycles. MAHLE contributed expertise in refrigerant service, ADAS calibration, and vehicle diagnostics, while Midtronics provided advanced battery monitoring and inspection technologies. This partnership enhanced EV battery diagnosis services, enabling independent workshops to offer comprehensive support and maintenance for electric vehicle batteries.
Frequently Asked Questions (FAQ) :
Q1. What are the main growth-driving factors for this market?
The primary growth driver is the rapid global increase in the adoption of electric vehicles (EVs). As more EVs hit the road, the critical need to ensure battery safety, performance, and longevity grows significantly. High battery replacement costs compel both consumers and fleet operators to seek advanced diagnostic services that can monitor battery health in real-time. Additionally, stricter government regulations mandating continuous battery health monitoring also push market growth.
Q2. What are the main restraining factors for this market?
The market's expansion is primarily slowed by the high capital investment required for advanced diagnostic equipment and establishing specialized testing facilities. This creates entry barriers for smaller companies. Furthermore, the complexity of various new battery chemistries, like solid-state, demands highly skilled technicians who are currently in short supply, creating a knowledge gap in the service sector which hinders rapid scaling of diagnosis services.
Q3. Which segment is expected to witness high growth?
The Diagnostic Software and AI-based Predictive Analytics segments are expected to witness particularly high growth. The trend is moving away from simple physical checks towards smart, real-time monitoring. These advanced systems, often cloud-based, use Artificial Intelligence and Machine Learning to provide early fault detection and predictive maintenance advice, which enhances battery lifespan and reduces overall vehicle ownership cost for users.
Q4. Who are the top major players for this market?
The market features both established battery manufacturers and specialized testing and certification companies. Key players include major battery producers like Contemporary Amperex Technology Co., Limited (CATL), LG Energy Solution, and BYD, who integrate diagnostics into their systems. Leading independent testing and certification firms like TÜV SÜD, Intertek Group, and UL LLC are also major players providing third-party verification services.
Q5. Which country is the largest player?
The Asia-Pacific region holds the largest market share, with China specifically dominating the EV battery diagnosis service market. This leadership is driven by China's massive electric vehicle production volumes and its vast installed base of EVs, which creates enormous demand for continuous diagnostic and maintenance services. The region also benefits from strong governmental support and technological investment in the EV ecosystem.
List of Figures
Figure 1: Global EV Battery Diagnosis Service Market Revenue Breakdown (USD Billion, %) by Region, 2022 & 2029
Figure 2: Global EV Battery Diagnosis Service Market Value Share (%), By Segment 1, 2022 & 2029
Figure 3: Global EV Battery Diagnosis Service Market Forecast (USD Billion), by Sub-Segment 1, 2018-2029
Figure 4: Global EV Battery Diagnosis Service Market Forecast (USD Billion), by Sub-Segment 2, 2018-2029
Figure 5: Global EV Battery Diagnosis Service Market Value Share (%), By Segment 2, 2022 & 2029
Figure 6: Global EV Battery Diagnosis Service Market Forecast (USD Billion), by Sub-Segment 1, 2018-2029
Figure 7: Global EV Battery Diagnosis Service Market Forecast (USD Billion), by Sub-Segment 2, 2018-2029
Figure 8: Global EV Battery Diagnosis Service Market Forecast (USD Billion), by Sub-Segment 3, 2018-2029
Figure 9: Global EV Battery Diagnosis Service Market Forecast (USD Billion), by Others, 2018-2029
Figure 10: Global EV Battery Diagnosis Service Market Value Share (%), By Segment 3, 2022 & 2029
Figure 11: Global EV Battery Diagnosis Service Market Forecast (USD Billion), by Sub-Segment 1, 2018-2029
Figure 12: Global EV Battery Diagnosis Service Market Forecast (USD Billion), by Sub-Segment 2, 2018-2029
Figure 13: Global EV Battery Diagnosis Service Market Forecast (USD Billion), by Sub-Segment 3, 2018-2029
Figure 14: Global EV Battery Diagnosis Service Market Forecast (USD Billion), by Others, 2018-2029
Figure 15: Global EV Battery Diagnosis Service Market Value (USD Billion), by Region, 2022 & 2029
Figure 16: North America EV Battery Diagnosis Service Market Value Share (%), By Segment 1, 2022 & 2029
Figure 17: North America EV Battery Diagnosis Service Market Forecast (USD Billion), by Sub-Segment 1, 2018-2029
Figure 18: North America EV Battery Diagnosis Service Market Forecast (USD Billion), by Sub-Segment 2, 2018-2029
Figure 19: North America EV Battery Diagnosis Service Market Value Share (%), By Segment 2, 2022 & 2029
Figure 20: North America EV Battery Diagnosis Service Market Forecast (USD Billion), by Sub-Segment 1, 2018-2029
Figure 21: North America EV Battery Diagnosis Service Market Forecast (USD Billion), by Sub-Segment 2, 2018-2029
Figure 22: North America EV Battery Diagnosis Service Market Forecast (USD Billion), by Sub-Segment 3, 2018-2029
Figure 23: North America EV Battery Diagnosis Service Market Forecast (USD Billion), by Others, 2018-2029
Figure 24: North America EV Battery Diagnosis Service Market Value Share (%), By Segment 3, 2022 & 2029
Figure 25: North America EV Battery Diagnosis Service Market Forecast (USD Billion), by Sub-Segment 1, 2018-2029
Figure 26: North America EV Battery Diagnosis Service Market Forecast (USD Billion), by Sub-Segment 2, 2018-2029
Figure 27: North America EV Battery Diagnosis Service Market Forecast (USD Billion), by Sub-Segment 3, 2018-2029
Figure 28: North America EV Battery Diagnosis Service Market Forecast (USD Billion), by Others, 2018-2029
Figure 29: North America EV Battery Diagnosis Service Market Forecast (USD Billion), by U.S., 2018-2029
Figure 30: North America EV Battery Diagnosis Service Market Forecast (USD Billion), by Canada, 2018-2029
Figure 31: Latin America EV Battery Diagnosis Service Market Value Share (%), By Segment 1, 2022 & 2029
Figure 32: Latin America EV Battery Diagnosis Service Market Forecast (USD Billion), by Sub-Segment 1, 2018-2029
Figure 33: Latin America EV Battery Diagnosis Service Market Forecast (USD Billion), by Sub-Segment 2, 2018-2029
Figure 34: Latin America EV Battery Diagnosis Service Market Value Share (%), By Segment 2, 2022 & 2029
Figure 35: Latin America EV Battery Diagnosis Service Market Forecast (USD Billion), by Sub-Segment 1, 2018-2029
Figure 36: Latin America EV Battery Diagnosis Service Market Forecast (USD Billion), by Sub-Segment 2, 2018-2029
Figure 37: Latin America EV Battery Diagnosis Service Market Forecast (USD Billion), by Sub-Segment 3, 2018-2029
Figure 38: Latin America EV Battery Diagnosis Service Market Forecast (USD Billion), by Others, 2018-2029
Figure 39: Latin America EV Battery Diagnosis Service Market Value Share (%), By Segment 3, 2022 & 2029
Figure 40: Latin America EV Battery Diagnosis Service Market Forecast (USD Billion), by Sub-Segment 1, 2018-2029
Figure 41: Latin America EV Battery Diagnosis Service Market Forecast (USD Billion), by Sub-Segment 2, 2018-2029
Figure 42: Latin America EV Battery Diagnosis Service Market Forecast (USD Billion), by Sub-Segment 3, 2018-2029
Figure 43: Latin America EV Battery Diagnosis Service Market Forecast (USD Billion), by Others, 2018-2029
Figure 44: Latin America EV Battery Diagnosis Service Market Forecast (USD Billion), by Brazil, 2018-2029
Figure 45: Latin America EV Battery Diagnosis Service Market Forecast (USD Billion), by Mexico, 2018-2029
Figure 46: Latin America EV Battery Diagnosis Service Market Forecast (USD Billion), by Rest of Latin America, 2018-2029
Figure 47: Europe EV Battery Diagnosis Service Market Value Share (%), By Segment 1, 2022 & 2029
Figure 48: Europe EV Battery Diagnosis Service Market Forecast (USD Billion), by Sub-Segment 1, 2018-2029
Figure 49: Europe EV Battery Diagnosis Service Market Forecast (USD Billion), by Sub-Segment 2, 2018-2029
Figure 50: Europe EV Battery Diagnosis Service Market Value Share (%), By Segment 2, 2022 & 2029
Figure 51: Europe EV Battery Diagnosis Service Market Forecast (USD Billion), by Sub-Segment 1, 2018-2029
Figure 52: Europe EV Battery Diagnosis Service Market Forecast (USD Billion), by Sub-Segment 2, 2018-2029
Figure 53: Europe EV Battery Diagnosis Service Market Forecast (USD Billion), by Sub-Segment 3, 2018-2029
Figure 54: Europe EV Battery Diagnosis Service Market Forecast (USD Billion), by Others, 2018-2029
Figure 55: Europe EV Battery Diagnosis Service Market Value Share (%), By Segment 3, 2022 & 2029
Figure 56: Europe EV Battery Diagnosis Service Market Forecast (USD Billion), by Sub-Segment 1, 2018-2029
Figure 57: Europe EV Battery Diagnosis Service Market Forecast (USD Billion), by Sub-Segment 2, 2018-2029
Figure 58: Europe EV Battery Diagnosis Service Market Forecast (USD Billion), by Sub-Segment 3, 2018-2029
Figure 59: Europe EV Battery Diagnosis Service Market Forecast (USD Billion), by Others, 2018-2029
Figure 60: Europe EV Battery Diagnosis Service Market Forecast (USD Billion), by U.K., 2018-2029
Figure 61: Europe EV Battery Diagnosis Service Market Forecast (USD Billion), by Germany, 2018-2029
Figure 62: Europe EV Battery Diagnosis Service Market Forecast (USD Billion), by France, 2018-2029
Figure 63: Europe EV Battery Diagnosis Service Market Forecast (USD Billion), by Italy, 2018-2029
Figure 64: Europe EV Battery Diagnosis Service Market Forecast (USD Billion), by Spain, 2018-2029
Figure 65: Europe EV Battery Diagnosis Service Market Forecast (USD Billion), by Russia, 2018-2029
Figure 66: Europe EV Battery Diagnosis Service Market Forecast (USD Billion), by Rest of Europe, 2018-2029
Figure 67: Asia Pacific EV Battery Diagnosis Service Market Value Share (%), By Segment 1, 2022 & 2029
Figure 68: Asia Pacific EV Battery Diagnosis Service Market Forecast (USD Billion), by Sub-Segment 1, 2018-2029
Figure 69: Asia Pacific EV Battery Diagnosis Service Market Forecast (USD Billion), by Sub-Segment 2, 2018-2029
Figure 70: Asia Pacific EV Battery Diagnosis Service Market Value Share (%), By Segment 2, 2022 & 2029
Figure 71: Asia Pacific EV Battery Diagnosis Service Market Forecast (USD Billion), by Sub-Segment 1, 2018-2029
Figure 72: Asia Pacific EV Battery Diagnosis Service Market Forecast (USD Billion), by Sub-Segment 2, 2018-2029
Figure 73: Asia Pacific EV Battery Diagnosis Service Market Forecast (USD Billion), by Sub-Segment 3, 2018-2029
Figure 74: Asia Pacific EV Battery Diagnosis Service Market Forecast (USD Billion), by Others, 2018-2029
Figure 75: Asia Pacific EV Battery Diagnosis Service Market Value Share (%), By Segment 3, 2022 & 2029
Figure 76: Asia Pacific EV Battery Diagnosis Service Market Forecast (USD Billion), by Sub-Segment 1, 2018-2029
Figure 77: Asia Pacific EV Battery Diagnosis Service Market Forecast (USD Billion), by Sub-Segment 2, 2018-2029
Figure 78: Asia Pacific EV Battery Diagnosis Service Market Forecast (USD Billion), by Sub-Segment 3, 2018-2029
Figure 79: Asia Pacific EV Battery Diagnosis Service Market Forecast (USD Billion), by Others, 2018-2029
Figure 80: Asia Pacific EV Battery Diagnosis Service Market Forecast (USD Billion), by China, 2018-2029
Figure 81: Asia Pacific EV Battery Diagnosis Service Market Forecast (USD Billion), by India, 2018-2029
Figure 82: Asia Pacific EV Battery Diagnosis Service Market Forecast (USD Billion), by Japan, 2018-2029
Figure 83: Asia Pacific EV Battery Diagnosis Service Market Forecast (USD Billion), by Australia, 2018-2029
Figure 84: Asia Pacific EV Battery Diagnosis Service Market Forecast (USD Billion), by Southeast Asia, 2018-2029
Figure 85: Asia Pacific EV Battery Diagnosis Service Market Forecast (USD Billion), by Rest of Asia Pacific, 2018-2029
Figure 86: Middle East & Africa EV Battery Diagnosis Service Market Value Share (%), By Segment 1, 2022 & 2029
Figure 87: Middle East & Africa EV Battery Diagnosis Service Market Forecast (USD Billion), by Sub-Segment 1, 2018-2029
Figure 88: Middle East & Africa EV Battery Diagnosis Service Market Forecast (USD Billion), by Sub-Segment 2, 2018-2029
Figure 89: Middle East & Africa EV Battery Diagnosis Service Market Value Share (%), By Segment 2, 2022 & 2029
Figure 90: Middle East & Africa EV Battery Diagnosis Service Market Forecast (USD Billion), by Sub-Segment 1, 2018-2029
Figure 91: Middle East & Africa EV Battery Diagnosis Service Market Forecast (USD Billion), by Sub-Segment 2, 2018-2029
Figure 92: Middle East & Africa EV Battery Diagnosis Service Market Forecast (USD Billion), by Sub-Segment 3, 2018-2029
Figure 93: Middle East & Africa EV Battery Diagnosis Service Market Forecast (USD Billion), by Others, 2018-2029
Figure 94: Middle East & Africa EV Battery Diagnosis Service Market Value Share (%), By Segment 3, 2022 & 2029
Figure 95: Middle East & Africa EV Battery Diagnosis Service Market Forecast (USD Billion), by Sub-Segment 1, 2018-2029
Figure 96: Middle East & Africa EV Battery Diagnosis Service Market Forecast (USD Billion), by Sub-Segment 2, 2018-2029
Figure 97: Middle East & Africa EV Battery Diagnosis Service Market Forecast (USD Billion), by Sub-Segment 3, 2018-2029
Figure 98: Middle East & Africa EV Battery Diagnosis Service Market Forecast (USD Billion), by Others, 2018-2029
Figure 99: Middle East & Africa EV Battery Diagnosis Service Market Forecast (USD Billion), by GCC, 2018-2029
Figure 100: Middle East & Africa EV Battery Diagnosis Service Market Forecast (USD Billion), by South Africa, 2018-2029
Figure 101: Middle East & Africa EV Battery Diagnosis Service Market Forecast (USD Billion), by Rest of Middle East & Africa, 2018-2029
List of Tables
Table 1: Global EV Battery Diagnosis Service Market Revenue (USD Billion) Forecast, by Segment 1, 2018-2029
Table 2: Global EV Battery Diagnosis Service Market Revenue (USD Billion) Forecast, by Segment 2, 2018-2029
Table 3: Global EV Battery Diagnosis Service Market Revenue (USD Billion) Forecast, by Segment 3, 2018-2029
Table 4: Global EV Battery Diagnosis Service Market Revenue (USD Billion) Forecast, by Region, 2018-2029
Table 5: North America EV Battery Diagnosis Service Market Revenue (USD Billion) Forecast, by Segment 1, 2018-2029
Table 6: North America EV Battery Diagnosis Service Market Revenue (USD Billion) Forecast, by Segment 2, 2018-2029
Table 7: North America EV Battery Diagnosis Service Market Revenue (USD Billion) Forecast, by Segment 3, 2018-2029
Table 8: North America EV Battery Diagnosis Service Market Revenue (USD Billion) Forecast, by Country, 2018-2029
Table 9: Europe EV Battery Diagnosis Service Market Revenue (USD Billion) Forecast, by Segment 1, 2018-2029
Table 10: Europe EV Battery Diagnosis Service Market Revenue (USD Billion) Forecast, by Segment 2, 2018-2029
Table 11: Europe EV Battery Diagnosis Service Market Revenue (USD Billion) Forecast, by Segment 3, 2018-2029
Table 12: Europe EV Battery Diagnosis Service Market Revenue (USD Billion) Forecast, by Country, 2018-2029
Table 13: Latin America EV Battery Diagnosis Service Market Revenue (USD Billion) Forecast, by Segment 1, 2018-2029
Table 14: Latin America EV Battery Diagnosis Service Market Revenue (USD Billion) Forecast, by Segment 2, 2018-2029
Table 15: Latin America EV Battery Diagnosis Service Market Revenue (USD Billion) Forecast, by Segment 3, 2018-2029
Table 16: Latin America EV Battery Diagnosis Service Market Revenue (USD Billion) Forecast, by Country, 2018-2029
Table 17: Asia Pacific EV Battery Diagnosis Service Market Revenue (USD Billion) Forecast, by Segment 1, 2018-2029
Table 18: Asia Pacific EV Battery Diagnosis Service Market Revenue (USD Billion) Forecast, by Segment 2, 2018-2029
Table 19: Asia Pacific EV Battery Diagnosis Service Market Revenue (USD Billion) Forecast, by Segment 3, 2018-2029
Table 20: Asia Pacific EV Battery Diagnosis Service Market Revenue (USD Billion) Forecast, by Country, 2018-2029
Table 21: Middle East & Africa EV Battery Diagnosis Service Market Revenue (USD Billion) Forecast, by Segment 1, 2018-2029
Table 22: Middle East & Africa EV Battery Diagnosis Service Market Revenue (USD Billion) Forecast, by Segment 2, 2018-2029
Table 23: Middle East & Africa EV Battery Diagnosis Service Market Revenue (USD Billion) Forecast, by Segment 3, 2018-2029
Table 24: Middle East & Africa EV Battery Diagnosis Service Market Revenue (USD Billion) Forecast, by Country, 2018-2029
Research Process
Data Library Research are conducted by industry experts who offer insight on
industry structure, market segmentations technology assessment and competitive landscape (CL), and penetration, as well as on emerging trends. Their analysis is based on primary interviews (~ 80%) and secondary research (~ 20%) as well as years of professional expertise in their respective industries. Adding to this, by analysing historical trends and current market positions, our analysts predict where the market will be headed for the next five years. Furthermore, the varying trends of segment & categories geographically presented are also studied and the estimated based on the primary & secondary research.
In this particular report from the supply side Data Library Research has conducted primary surveys (interviews) with the key level executives (VP, CEO’s, Marketing Director, Business Development Manager
and SOFT) of the companies that active & prominent as well as the midsized organization
FIGURE 1: DLR RESEARH PROCESS
![research-methodology1]()
Primary Research
Extensive primary research was conducted to gain a deeper insight of the market and industry performance. The analysis is based on both primary and secondary research as well as years of professional expertise in the respective industries.
In addition to analysing current and historical trends, our analysts predict where the market is headed over the next five years.
It varies by segment for these categories geographically presented in the list of market tables. Speaking about this particular report we have conducted primary surveys (interviews) with the key level executives (VP, CEO’s, Marketing Director, Business Development Manager and many more) of the major players active in the market.
Secondary Research
Secondary research was mainly used to collect and identify information useful for the extensive, technical, market-oriented, and Friend’s study of the Global Extra Neutral Alcohol. It was also used to obtain key information about major players, market classification and segmentation according to the industry trends, geographical markets, and developments related to the market and technology perspectives. For this study, analysts have gathered information from various credible sources, such as annual reports, sec filings, journals, white papers, SOFT presentations, and company web sites.
Market Size Estimation
Both, top-down and bottom-up approaches were used to estimate and validate the size of the Global market and to estimate the size of various other dependent submarkets in the overall Extra Neutral Alcohol. The key players in the market were identified through secondary research and their market contributions in the respective geographies were determined through primary and secondary research.
Forecast Model
![research-methodology2]()