Face Recognition Lockers Market Overview and Analysis:

The Global Face Recognition Lockers Market size is evaluated at USD 6.38 billion in 2025 and is predicted to hit around USD 13.10 billion by 2032, growing at a CAGR of 11.12% from 2025-2032.

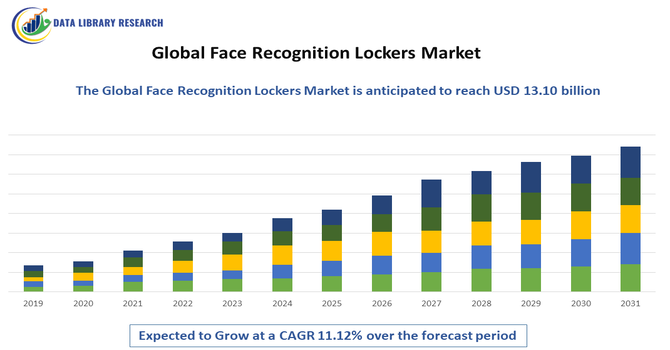
The global face recognition lockers market is experiencing robust growth as organizations and individuals increasingly demand secure, contactless, and convenient storage solutions across multiple sectors, including retail, healthcare, gyms, logistics and hospitality. Rising security concerns, growth in e commerce and parcel delivery, and a broader trend toward smart, biometric enabled physical infrastructure have significantly boosted adoption of lockers that use facial recognition for access control. Technological advances especially in AI, machine learning, and 3D or infrared recognition systems have improved accuracy, speed, and reliability of authentication, making face recognition lockers more viable and attractive.

Face Recognition Lockers Market Latest Trends

The latest trends in the global face recognition lockers market reflect rapid technological innovation and changing user expectations — pushing the market toward smarter, more secure, and more integrated locker solutions. Another emerging pattern is cloud and IoT enabled management of locker fleets: lockers are increasingly connected to remote platforms for monitoring, usage analytics, access control, and maintenance. This allows operators (e.g. logistics firms, apartment complexes, offices) to manage many lockers across locations efficiently and gives users real time notifications, remote unlocking options, and smoother user experience.

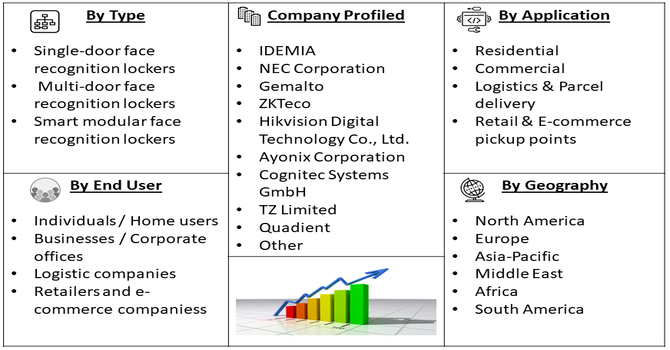
Segmentation: Global Face Recognition Lockers Market is segmented By Type (Single-door face recognition lockers, Multi-door face recognition lockers, Smart modular face recognition lockers), Application (Residential, Commercial, Logistics & Parcel delivery, Retail & E-commerce pickup points), End User (Individuals / Home users, Businesses / Corporate offices, Logistic companies, Retailers and e-commerce companies), Technology (2D facial recognition systems, 3D facial recognition systems, Infrared / Thermal facial recognition systems), and Geography (North America, Europe, Asia-Pacific, Middle East and Africa, and South America). The report provides the value (in USD million) for the above segments.

Market Drivers:

  • Rising Demand for Contactless and Secure Storage Solutions

The primary driver for the face recognition lockers market is the growing need for secure, contactless access in residential, commercial, and public spaces. With increasing security concerns, theft prevention, and the need to protect sensitive items, facial recognition provides a reliable, non-transferable authentication method compared to traditional key, PIN, or card-based systems. For instance, in July 2025, Stadiums’ expanded use of facial authentication demonstrated high-capacity, secure access management, driving adoption of face recognition lockers and positively influencing the growth and innovation of the global face recognition lockers market.

In sectors like logistics and e-commerce, face recognition lockers enable secure parcel deliveries without human contact, ensuring both operational efficiency and safety. This rising emphasis on convenience, security, and hygiene is significantly driving adoption across multiple industries.

  • Integration of Advanced Technologies and Smart Management Systems

Another key driver is the incorporation of advanced AI, machine learning, and IoT-enabled technologies in face recognition lockers. Modern lockers can now accurately identify users under varying lighting conditions, recognize multiple users, and detect spoofing attempts, improving reliability and user confidence.

Additionally, integration with cloud platforms and smart building management systems allows operators to monitor locker usage remotely, track inventory, generate analytics, and provide real-time notifications to users. This automation and data-driven management reduce operational costs, enhance user experience, and make lockers scalable for large facilities, further boosting market growth. The trend toward smart infrastructure and Industry 4.0 adoption strongly supports increased deployment of intelligent face recognition lockers worldwide.

Market Restraints

  • High Initial Costs of Advanced Biometric Lockers

The high initial costs of advanced biometric lockers, particularly those with AI-enabled 3D facial recognition and IoT connectivity, make them less accessible for small businesses and residential users. Privacy and data security concerns also pose a significant challenge, as facial data is highly sensitive and subject to strict regulations such as GDPR, requiring secure storage, encryption, and compliance protocols. Technical limitations, such as decreased recognition accuracy under poor lighting conditions, obstructions, or rapid environmental changes, can impact reliability and user confidence.

Socio Economic Impact on Face Recognition Lockers Market

The global face recognition lockers market is significantly influenced by socioeconomic factors, as rising urbanization, increasing disposable incomes, and growing awareness of security and privacy drive adoption across commercial, residential, and institutional sectors. In developed economies, higher technological literacy and investment in smart infrastructure accelerate market growth, while in emerging regions, government initiatives promoting digital security and modernization of public facilities enhance demand. Additionally, societal concerns around safety, coupled with shifting workplace and educational norms, further stimulate adoption. Economic disparities, however, may limit penetration in low-income areas, highlighting the market’s sensitivity to both income levels and social awareness.

Segmental Analysis:

  • Smart Modular Face Recognition Lockers segment is expected to witness highest growth over the forecast period

Smart modular face recognition lockers are emerging as a leading type due to their flexibility, scalability, and adaptability across various environments. Unlike traditional single- or multi-door lockers, modular systems can be customized in size, configuration, and number of compartments, allowing businesses and institutions to efficiently manage space and user requirements. They are increasingly adopted in logistics hubs, offices, gyms, and residential complexes where varying locker sizes and smart access features are required, enhancing operational efficiency and user convenience.

  • Logistics & Parcel Delivery segment is expected to witness highest growth over the forecast period

The logistics and parcel delivery sector is one of the fastest-growing applications for face recognition lockers. With the boom in e-commerce and increasing demand for last-mile delivery solutions, secure lockers enable contactless parcel collection and drop-off. Facial recognition ensures that only the intended recipient can access the package, reducing theft and misdelivery risks. This application is particularly critical in urban areas, residential complexes, and corporate campuses where multiple parcels are delivered daily.

  • Businesses / Corporate Offices segment is expected to witness highest growth over the forecast period

Corporate offices represent a major end-user segment as businesses increasingly adopt face recognition lockers to secure personal belongings, sensitive documents, and IT equipment. These lockers improve workplace security while providing employees with convenient, contactless access. Integration with office management systems allows administrators to monitor usage, manage multiple users, and streamline facility operations, supporting broader corporate digitalization initiatives.

  • 3D Facial Recognition Systems segment is expected to witness highest growth over the forecast period

3D facial recognition systems are gaining traction over 2D systems due to higher accuracy, reliability, and enhanced security. Unlike 2D recognition, 3D systems capture depth and contours of a face, making them less susceptible to lighting variations, facial expressions, or spoofing attempts with photographs. This makes them ideal for high-security applications in logistics, corporate offices, and public facilities where accuracy and fraud prevention are critical.

  • North America segment is expected to witness highest growth over the forecast period

North America is a dominant regional market for face recognition lockers due to advanced technology adoption, strong security awareness, and widespread use of smart infrastructure in residential and commercial sectors.

The region has a high concentration of e-commerce operations, corporate offices, and tech-forward residential complexes, which drives demand for smart, AI-enabled locker systems. Supportive regulations, investment in smart building technologies, and robust R&D activities further strengthen market growth in this region. For instance, in May 2023, Parks Associates’ whitepaper highlighted growing consumer interest in AI-driven face recognition for smart home security, emphasizing convenience and enhanced safety. While 86% valued AI features in purchase decisions, 26% expressed data privacy concerns. These insights influenced the US face recognition lockers market by driving innovation, increasing adoption in residential and commercial sectors, and prompting solutions addressing privacy and security challenges.

Similarly, in 2020, Rite Aid’s deployment of facial recognition systems across 200 U.S. stores marked one of the largest retail rollouts, showcasing the technology’s scalability and operational potential. Its use in diverse urban neighborhoods highlighted both market expansion opportunities and privacy concerns, influencing the U.S. face recognition lockers market by accelerating adoption while prompting discussions on ethical use and regulatory compliance.

Face Recognition Lockers Market Competitive Landscape:

The competitive terrain in the global face recognition lockers market is crowded and evolving rapidly, shaped by a mixture of long standing security and access control firms, smart locker specialists, and emerging technology providers. Key players compete primarily on the basis of facial recognition accuracy and robustness (2D, 3D, thermal, AI/ML), product range (single-door, multi door, modular lockers, parcel lockers), integration capabilities (IoT/cloud, building/security infrastructure, package management systems), and service footprint (global vs regional). Strategic partnerships, alliances, and M&A are commonplace as companies aim to combine hardware, biometric software, cloud services, and locker management platforms into unified solutions — blurring lines between security systems, smart logistics, and access control offerings.

Key Players:

  • IDEMIA
  • NEC Corporation
  • Gemalto
  • ZKTeco
  • Hikvision Digital Technology Co., Ltd.
  • Ayonix Corporation
  • Cognitec Systems GmbH
  • FaceFirst, Inc.
  • Luxer One
  • Cleveron AS
  • TZ Limited
  • Quadient
  • Pitney Bowes Inc.
  • Zebra Technologies Corporation
  • HID Global
  • Suprema Inc.
  • Gunnebo AB
  • Dormakaba Holding AG
  • Smiota Inc.
  • SentryBay Ltd.

Recent Development

  • In October 2023, Innovatrics and Nedap integrated face biometrics into the AEOS Locker Management system, transforming access control by removing the need for keys, fobs, or PINs. This innovation boosted efficiency and security in locker management, driving adoption in corporate, educational, and public sectors, and positively influencing the growth and technological advancement of the global face recognition lockers market.


  • In November 2021, The launch of face recognition technology for pensioners by Dr. Jitendra Singh demonstrated the practical application of biometric systems for secure, convenient access. By simplifying identity verification for millions, this initiative highlighted the reliability and societal acceptance of facial recognition, indirectly boosting confidence and adoption in related sectors, including the global face recognition lockers market, and promoting wider deployment of such technologies.


Frequently Asked Questions (FAQ) :

Q1. What are the main growth-driving factors for this market?

The market is primarily driven by the rising demand for enhanced security and the push for contactless, convenient access solutions. The need for hygienic, touchless interactions, accelerated by recent global health concerns, boosts adoption in public spaces like gyms, airports, and offices. Also, the expansion of smart city initiatives requiring integrated access control fuels demand.

Q2. What are the main restraining factors for this market?

The main hurdles are the high initial investment cost required to implement these advanced locker systems, which often includes complex hardware and software integration. Significant public concerns regarding data privacy and the security of stored biometric information, along with evolving government regulations on data usage, also slow down market growth.

Q3. Which segment is expected to witness high growth?

The airport and transportation application segment is anticipated to witness the highest growth. Airports require seamless, high-security, and rapid access management for passengers and staff. Face recognition lockers offer the perfect contactless solution to enhance efficiency during processes like baggage drop-off and staff access control across facilities.

Q4. Who are the top major players for this market?

The market includes key players who specialize in biometric technology and access control systems. Major global players often include large technology corporations like NEC Corporation, Thales, and IDEMIA, who leverage their expertise in facial recognition software and comprehensive smart city solutions to dominate the hardware and integrated locker system space.

Q5. Which country is the largest player?

The United States, within the North American region, currently holds the largest market share. This dominance is due to high technological adoption rates, established smart infrastructure, significant investments in advanced security systems across commercial and government sectors, and strong emphasis on high-level identity verification technologies.

Face Recognition Lockers MARKET STUDY GLOBAL MARKET ANALYSIS, INSIGHTS AND FORECAST, 2022-2029

    1. Introduction

    • 1.1. Research Scope
    • 1.2. Market Segmentation
    • 1.3. Research Methodology
    • 1.4. Definitions and Assumptions

    2. Executive Summary

      3. Market Dynamics

      • 3.1. Market Drivers
      • 3.2. Market Restraints
      • 3.3. Market Opportunities

      4. Key Insights

      • 4.1. Key Emerging Trends – For Major Countries
      • 4.2. Latest Technological Advancement
      • 4.3. Regulatory Landscape
      • 4.4. Industry SWOT Analysis
      • 4.5. Porters Five Forces Analysis

      5. Global Face Recognition Lockers Market Analysis (USD Billion), Insights and Forecast, 2018-2029

      • 5.1. Key Findings / Summary
      • 5.2. Market Analysis, Insights and Forecast – By Segment 1
        • 5.2.1. Sub-Segment 1
        • 5.2.2. Sub-Segment 2
      • 5.3. Market Analysis, Insights and Forecast – By Segment 2
        • 5.3.1. Sub-Segment 1
        • 5.3.2. Sub-Segment 2
        • 5.3.3. Sub-Segment 3
        • 5.3.4. Others
      • 5.4. Market Analysis, Insights and Forecast – By Segment 3
        • 5.4.1. Sub-Segment 1
        • 5.4.2. Sub-Segment 2
        • 5.4.3. Sub-Segment 3
        • 5.4.4. Others
      • 5.5. Market Analysis, Insights and Forecast – By Region
        • 5.5.1. North America
        • 5.5.2. Latin America
        • 5.5.3. Europe
        • 5.5.4. Asia Pacific
        • 5.5.5. Middle East and Africa

      6. North America Face Recognition Lockers Market Analysis (USD Billion), Insights and Forecast, 2018-2029

      • 6.1. Key Findings / Summary
      • 6.2. Market Analysis, Insights and Forecast – By Segment 1
        • 6.2.1. Sub-Segment 1
        • 6.2.2. Sub-Segment 2
      • 6.3. Market Analysis, Insights and Forecast – By Segment 2
        • 6.3.1. Sub-Segment 1
        • 6.3.2. Sub-Segment 2
        • 6.3.3. Sub-Segment 3
        • 6.3.4. Others
      • 6.4. Market Analysis, Insights and Forecast – By Segment 3
        • 6.4.1. Sub-Segment 1
        • 6.4.2. Sub-Segment 2
        • 6.4.3. Sub-Segment 3
        • 6.4.4. Others
      • 6.5. Market Analysis, Insights and Forecast – By Country
        • 6.5.1. U.S.
        • 6.5.2. Canada

      7. Latin America Face Recognition Lockers Market Analysis (USD Billion), Insights and Forecast, 2018-2029

      • 7.1. Key Findings / Summary
      • 7.2. Market Analysis, Insights and Forecast – By Segment 1
        • 7.2.1. Sub-Segment 1
        • 7.2.2. Sub-Segment 2
      • 7.3. Market Analysis, Insights and Forecast – By Segment 2
        • 7.3.1. Sub-Segment 1
        • 7.3.2. Sub-Segment 2
        • 7.3.3. Sub-Segment 3
        • 7.3.4. Others
      • 7.4. Market Analysis, Insights and Forecast – By Segment 3
        • 7.4.1. Sub-Segment 1
        • 7.4.2. Sub-Segment 2
        • 7.4.3. Sub-Segment 3
        • 7.4.4. Others
      • 7.5. Insights and Forecast – By Country
        • 7.5.1. Brazil
        • 7.5.2. Mexico
        • 7.5.3. Rest of Latin America

      8. Europe Face Recognition Lockers Market Analysis (USD Billion), Insights and Forecast, 2018-2029

      • 8.1. Key Findings / Summary
      • 8.2. Market Analysis, Insights and Forecast – By Segment 1
        • 8.2.1. Sub-Segment 1
        • 8.2.2. Sub-Segment 2
      • 8.3. Market Analysis, Insights and Forecast – By Segment 2
        • 8.3.1. Sub-Segment 1
        • 8.3.2. Sub-Segment 2
        • 8.3.3. Sub-Segment 3
        • 8.3.4. Others
      • 8.4. Market Analysis, Insights and Forecast – By Segment 3
        • 8.4.1. Sub-Segment 1
        • 8.4.2. Sub-Segment 2
        • 8.4.3. Sub-Segment 3
        • 8.4.4. Others
      • 8.5. Market Analysis, Insights and Forecast – By Country
        • 8.5.1. UK
        • 8.5.2. Germany
        • 8.5.3. France
        • 8.5.4. Italy
        • 8.5.5. Spain
        • 8.5.6. Russia
        • 8.5.7. Rest of Europe

      9. Asia Pacific Face Recognition Lockers Market Analysis (USD Billion), Insights and Forecast, 2018-2029

      • 9.1. Key Findings / Summary
      • 9.2. Market Analysis, Insights and Forecast – By Segment 1
        • 9.2.1. Sub-Segment 1
        • 9.2.2. Sub-Segment 2
      • 9.3. Market Analysis, Insights and Forecast – By Segment 2
        • 9.3.1. Sub-Segment 1
        • 9.3.2. Sub-Segment 2
        • 9.3.3. Sub-Segment 3
        • 9.3.4. Others
      • 9.4. Market Analysis, Insights and Forecast – By Segment 3
        • 9.4.1. Sub-Segment 1
        • 9.4.2. Sub-Segment 2
        • 9.4.3. Sub-Segment 3
        • 9.4.4. Others
      • 9.5. Market Analysis, Insights and Forecast – By Country
        • 9.5.1. China
        • 9.5.2. India
        • 9.5.3. Japan
        • 9.5.4. Australia
        • 9.5.5. South East Asia
        • 9.5.6. Rest of Asia Pacific

      10. Middle East & Africa Face Recognition Lockers Market Analysis (USD Billion), Insights and Forecast, 2018-2029

      • 10.1. Key Findings / Summary
      • 10.2. Market Analysis, Insights and Forecast – By Segment 1
        • 10.2.1. Sub-Segment 1
        • 10.2.2. Sub-Segment 2
      • 10.3. Market Analysis, Insights and Forecast – By Segment 2
        • 10.3.1. Sub-Segment 1
        • 10.3.2. Sub-Segment 2
        • 10.3.3. Sub-Segment 3
        • 10.3.4. Others
      • 10.4. Market Analysis, Insights and Forecast – By Segment 3
        • 10.4.1. Sub-Segment 1
        • 10.4.2. Sub-Segment 2
        • 10.4.3. Sub-Segment 3
        • 10.4.4. Others
      • 10.5. Market Analysis, Insights and Forecast – By Country
        • 10.5.1. GCC
        • 10.5.2. South Africa
        • 10.5.3. Rest of Middle East & Africa

      11. Competitive Analysis

      • 11.1. Company Market Share Analysis, 2018
      • 11.2. Key Industry Developments
      • 11.3. Company Profile
        • 11.3.1. Company 1
          • 11.3.1.1. Business Overview
          • 11.3.1.2. Segment 1 & Service Offering
          • 11.3.1.3. Overall Revenue
          • 11.3.1.4. Geographic Presence
          • 11.3.1.5. Recent Development
        *Similar details will be provided for the following companies
        • 11.3.2. Company 2
        • 11.3.3. Company 3
        • 11.3.4. Company 4
        • 11.3.5. Company 5
        • 11.3.6. Company 6
        • 11.3.7. Company 7
        • 11.3.8. Company 8
        • 11.3.9. Company 9
        • 11.3.10. Company 10
        • 11.3.11. Company 11
        • 11.3.12. Company 12
      List of Figures

      Figure 1: Global Face Recognition Lockers Market Revenue Breakdown (USD Billion, %) by Region, 2022 & 2029
      Figure 2: Global Face Recognition Lockers Market Value Share (%), By Segment 1, 2022 & 2029
      Figure 3: Global Face Recognition Lockers Market Forecast (USD Billion), by Sub-Segment 1, 2018-2029
      Figure 4: Global Face Recognition Lockers Market Forecast (USD Billion), by Sub-Segment 2, 2018-2029
      Figure 5: Global Face Recognition Lockers Market Value Share (%), By Segment 2, 2022 & 2029
      Figure 6: Global Face Recognition Lockers Market Forecast (USD Billion), by Sub-Segment 1, 2018-2029
      Figure 7: Global Face Recognition Lockers Market Forecast (USD Billion), by Sub-Segment 2, 2018-2029
      Figure 8: Global Face Recognition Lockers Market Forecast (USD Billion), by Sub-Segment 3, 2018-2029
      Figure 9: Global Face Recognition Lockers Market Forecast (USD Billion), by Others, 2018-2029
      Figure 10: Global Face Recognition Lockers Market Value Share (%), By Segment 3, 2022 & 2029
      Figure 11: Global Face Recognition Lockers Market Forecast (USD Billion), by Sub-Segment 1, 2018-2029
      Figure 12: Global Face Recognition Lockers Market Forecast (USD Billion), by Sub-Segment 2, 2018-2029
      Figure 13: Global Face Recognition Lockers Market Forecast (USD Billion), by Sub-Segment 3, 2018-2029
      Figure 14: Global Face Recognition Lockers Market Forecast (USD Billion), by Others, 2018-2029
      Figure 15: Global Face Recognition Lockers Market Value (USD Billion), by Region, 2022 & 2029
      Figure 16: North America Face Recognition Lockers Market Value Share (%), By Segment 1, 2022 & 2029
      Figure 17: North America Face Recognition Lockers Market Forecast (USD Billion), by Sub-Segment 1, 2018-2029
      Figure 18: North America Face Recognition Lockers Market Forecast (USD Billion), by Sub-Segment 2, 2018-2029
      Figure 19: North America Face Recognition Lockers Market Value Share (%), By Segment 2, 2022 & 2029
      Figure 20: North America Face Recognition Lockers Market Forecast (USD Billion), by Sub-Segment 1, 2018-2029
      Figure 21: North America Face Recognition Lockers Market Forecast (USD Billion), by Sub-Segment 2, 2018-2029
      Figure 22: North America Face Recognition Lockers Market Forecast (USD Billion), by Sub-Segment 3, 2018-2029
      Figure 23: North America Face Recognition Lockers Market Forecast (USD Billion), by Others, 2018-2029
      Figure 24: North America Face Recognition Lockers Market Value Share (%), By Segment 3, 2022 & 2029
      Figure 25: North America Face Recognition Lockers Market Forecast (USD Billion), by Sub-Segment 1, 2018-2029
      Figure 26: North America Face Recognition Lockers Market Forecast (USD Billion), by Sub-Segment 2, 2018-2029
      Figure 27: North America Face Recognition Lockers Market Forecast (USD Billion), by Sub-Segment 3, 2018-2029
      Figure 28: North America Face Recognition Lockers Market Forecast (USD Billion), by Others, 2018-2029
      Figure 29: North America Face Recognition Lockers Market Forecast (USD Billion), by U.S., 2018-2029
      Figure 30: North America Face Recognition Lockers Market Forecast (USD Billion), by Canada, 2018-2029
      Figure 31: Latin America Face Recognition Lockers Market Value Share (%), By Segment 1, 2022 & 2029
      Figure 32: Latin America Face Recognition Lockers Market Forecast (USD Billion), by Sub-Segment 1, 2018-2029
      Figure 33: Latin America Face Recognition Lockers Market Forecast (USD Billion), by Sub-Segment 2, 2018-2029
      Figure 34: Latin America Face Recognition Lockers Market Value Share (%), By Segment 2, 2022 & 2029
      Figure 35: Latin America Face Recognition Lockers Market Forecast (USD Billion), by Sub-Segment 1, 2018-2029
      Figure 36: Latin America Face Recognition Lockers Market Forecast (USD Billion), by Sub-Segment 2, 2018-2029
      Figure 37: Latin America Face Recognition Lockers Market Forecast (USD Billion), by Sub-Segment 3, 2018-2029
      Figure 38: Latin America Face Recognition Lockers Market Forecast (USD Billion), by Others, 2018-2029
      Figure 39: Latin America Face Recognition Lockers Market Value Share (%), By Segment 3, 2022 & 2029
      Figure 40: Latin America Face Recognition Lockers Market Forecast (USD Billion), by Sub-Segment 1, 2018-2029
      Figure 41: Latin America Face Recognition Lockers Market Forecast (USD Billion), by Sub-Segment 2, 2018-2029
      Figure 42: Latin America Face Recognition Lockers Market Forecast (USD Billion), by Sub-Segment 3, 2018-2029
      Figure 43: Latin America Face Recognition Lockers Market Forecast (USD Billion), by Others, 2018-2029
      Figure 44: Latin America Face Recognition Lockers Market Forecast (USD Billion), by Brazil, 2018-2029
      Figure 45: Latin America Face Recognition Lockers Market Forecast (USD Billion), by Mexico, 2018-2029
      Figure 46: Latin America Face Recognition Lockers Market Forecast (USD Billion), by Rest of Latin America, 2018-2029
      Figure 47: Europe Face Recognition Lockers Market Value Share (%), By Segment 1, 2022 & 2029
      Figure 48: Europe Face Recognition Lockers Market Forecast (USD Billion), by Sub-Segment 1, 2018-2029
      Figure 49: Europe Face Recognition Lockers Market Forecast (USD Billion), by Sub-Segment 2, 2018-2029
      Figure 50: Europe Face Recognition Lockers Market Value Share (%), By Segment 2, 2022 & 2029
      Figure 51: Europe Face Recognition Lockers Market Forecast (USD Billion), by Sub-Segment 1, 2018-2029
      Figure 52: Europe Face Recognition Lockers Market Forecast (USD Billion), by Sub-Segment 2, 2018-2029
      Figure 53: Europe Face Recognition Lockers Market Forecast (USD Billion), by Sub-Segment 3, 2018-2029
      Figure 54: Europe Face Recognition Lockers Market Forecast (USD Billion), by Others, 2018-2029
      Figure 55: Europe Face Recognition Lockers Market Value Share (%), By Segment 3, 2022 & 2029
      Figure 56: Europe Face Recognition Lockers Market Forecast (USD Billion), by Sub-Segment 1, 2018-2029
      Figure 57: Europe Face Recognition Lockers Market Forecast (USD Billion), by Sub-Segment 2, 2018-2029
      Figure 58: Europe Face Recognition Lockers Market Forecast (USD Billion), by Sub-Segment 3, 2018-2029
      Figure 59: Europe Face Recognition Lockers Market Forecast (USD Billion), by Others, 2018-2029
      Figure 60: Europe Face Recognition Lockers Market Forecast (USD Billion), by U.K., 2018-2029
      Figure 61: Europe Face Recognition Lockers Market Forecast (USD Billion), by Germany, 2018-2029
      Figure 62: Europe Face Recognition Lockers Market Forecast (USD Billion), by France, 2018-2029
      Figure 63: Europe Face Recognition Lockers Market Forecast (USD Billion), by Italy, 2018-2029
      Figure 64: Europe Face Recognition Lockers Market Forecast (USD Billion), by Spain, 2018-2029
      Figure 65: Europe Face Recognition Lockers Market Forecast (USD Billion), by Russia, 2018-2029
      Figure 66: Europe Face Recognition Lockers Market Forecast (USD Billion), by Rest of Europe, 2018-2029
      Figure 67: Asia Pacific Face Recognition Lockers Market Value Share (%), By Segment 1, 2022 & 2029
      Figure 68: Asia Pacific Face Recognition Lockers Market Forecast (USD Billion), by Sub-Segment 1, 2018-2029
      Figure 69: Asia Pacific Face Recognition Lockers Market Forecast (USD Billion), by Sub-Segment 2, 2018-2029
      Figure 70: Asia Pacific Face Recognition Lockers Market Value Share (%), By Segment 2, 2022 & 2029
      Figure 71: Asia Pacific Face Recognition Lockers Market Forecast (USD Billion), by Sub-Segment 1, 2018-2029
      Figure 72: Asia Pacific Face Recognition Lockers Market Forecast (USD Billion), by Sub-Segment 2, 2018-2029
      Figure 73: Asia Pacific Face Recognition Lockers Market Forecast (USD Billion), by Sub-Segment 3, 2018-2029
      Figure 74: Asia Pacific Face Recognition Lockers Market Forecast (USD Billion), by Others, 2018-2029
      Figure 75: Asia Pacific Face Recognition Lockers Market Value Share (%), By Segment 3, 2022 & 2029
      Figure 76: Asia Pacific Face Recognition Lockers Market Forecast (USD Billion), by Sub-Segment 1, 2018-2029
      Figure 77: Asia Pacific Face Recognition Lockers Market Forecast (USD Billion), by Sub-Segment 2, 2018-2029
      Figure 78: Asia Pacific Face Recognition Lockers Market Forecast (USD Billion), by Sub-Segment 3, 2018-2029
      Figure 79: Asia Pacific Face Recognition Lockers Market Forecast (USD Billion), by Others, 2018-2029
      Figure 80: Asia Pacific Face Recognition Lockers Market Forecast (USD Billion), by China, 2018-2029
      Figure 81: Asia Pacific Face Recognition Lockers Market Forecast (USD Billion), by India, 2018-2029
      Figure 82: Asia Pacific Face Recognition Lockers Market Forecast (USD Billion), by Japan, 2018-2029
      Figure 83: Asia Pacific Face Recognition Lockers Market Forecast (USD Billion), by Australia, 2018-2029
      Figure 84: Asia Pacific Face Recognition Lockers Market Forecast (USD Billion), by Southeast Asia, 2018-2029
      Figure 85: Asia Pacific Face Recognition Lockers Market Forecast (USD Billion), by Rest of Asia Pacific, 2018-2029
      Figure 86: Middle East & Africa Face Recognition Lockers Market Value Share (%), By Segment 1, 2022 & 2029
      Figure 87: Middle East & Africa Face Recognition Lockers Market Forecast (USD Billion), by Sub-Segment 1, 2018-2029
      Figure 88: Middle East & Africa Face Recognition Lockers Market Forecast (USD Billion), by Sub-Segment 2, 2018-2029
      Figure 89: Middle East & Africa Face Recognition Lockers Market Value Share (%), By Segment 2, 2022 & 2029
      Figure 90: Middle East & Africa Face Recognition Lockers Market Forecast (USD Billion), by Sub-Segment 1, 2018-2029
      Figure 91: Middle East & Africa Face Recognition Lockers Market Forecast (USD Billion), by Sub-Segment 2, 2018-2029
      Figure 92: Middle East & Africa Face Recognition Lockers Market Forecast (USD Billion), by Sub-Segment 3, 2018-2029
      Figure 93: Middle East & Africa Face Recognition Lockers Market Forecast (USD Billion), by Others, 2018-2029
      Figure 94: Middle East & Africa Face Recognition Lockers Market Value Share (%), By Segment 3, 2022 & 2029
      Figure 95: Middle East & Africa Face Recognition Lockers Market Forecast (USD Billion), by Sub-Segment 1, 2018-2029
      Figure 96: Middle East & Africa Face Recognition Lockers Market Forecast (USD Billion), by Sub-Segment 2, 2018-2029
      Figure 97: Middle East & Africa Face Recognition Lockers Market Forecast (USD Billion), by Sub-Segment 3, 2018-2029
      Figure 98: Middle East & Africa Face Recognition Lockers Market Forecast (USD Billion), by Others, 2018-2029
      Figure 99: Middle East & Africa Face Recognition Lockers Market Forecast (USD Billion), by GCC, 2018-2029
      Figure 100: Middle East & Africa Face Recognition Lockers Market Forecast (USD Billion), by South Africa, 2018-2029
      Figure 101: Middle East & Africa Face Recognition Lockers Market Forecast (USD Billion), by Rest of Middle East & Africa, 2018-2029 
      List of Tables
      Table 1: Global Face Recognition Lockers Market Revenue (USD Billion) Forecast, by Segment 1, 2018-2029
      Table 2: Global Face Recognition Lockers Market Revenue (USD Billion) Forecast, by Segment 2, 2018-2029
      Table 3: Global Face Recognition Lockers Market Revenue (USD Billion) Forecast, by Segment 3, 2018-2029
      Table 4: Global Face Recognition Lockers Market Revenue (USD Billion) Forecast, by Region, 2018-2029
      Table 5: North America Face Recognition Lockers Market Revenue (USD Billion) Forecast, by Segment 1, 2018-2029
      Table 6: North America Face Recognition Lockers Market Revenue (USD Billion) Forecast, by Segment 2, 2018-2029
      Table 7: North America Face Recognition Lockers Market Revenue (USD Billion) Forecast, by Segment 3, 2018-2029
      Table 8: North America Face Recognition Lockers Market Revenue (USD Billion) Forecast, by Country, 2018-2029
      Table 9: Europe Face Recognition Lockers Market Revenue (USD Billion) Forecast, by Segment 1, 2018-2029
      Table 10: Europe Face Recognition Lockers Market Revenue (USD Billion) Forecast, by Segment 2, 2018-2029
      Table 11: Europe Face Recognition Lockers Market Revenue (USD Billion) Forecast, by Segment 3, 2018-2029
      Table 12: Europe Face Recognition Lockers Market Revenue (USD Billion) Forecast, by Country, 2018-2029
      Table 13: Latin America Face Recognition Lockers Market Revenue (USD Billion) Forecast, by Segment 1, 2018-2029
      Table 14: Latin America Face Recognition Lockers Market Revenue (USD Billion) Forecast, by Segment 2, 2018-2029
      Table 15: Latin America Face Recognition Lockers Market Revenue (USD Billion) Forecast, by Segment 3, 2018-2029
      Table 16: Latin America Face Recognition Lockers Market Revenue (USD Billion) Forecast, by Country, 2018-2029
      Table 17: Asia Pacific Face Recognition Lockers Market Revenue (USD Billion) Forecast, by Segment 1, 2018-2029
      Table 18: Asia Pacific Face Recognition Lockers Market Revenue (USD Billion) Forecast, by Segment 2, 2018-2029
      Table 19: Asia Pacific Face Recognition Lockers Market Revenue (USD Billion) Forecast, by Segment 3, 2018-2029
      Table 20: Asia Pacific Face Recognition Lockers Market Revenue (USD Billion) Forecast, by Country, 2018-2029
      Table 21: Middle East & Africa Face Recognition Lockers Market Revenue (USD Billion) Forecast, by Segment 1, 2018-2029
      Table 22: Middle East & Africa Face Recognition Lockers Market Revenue (USD Billion) Forecast, by Segment 2, 2018-2029
      Table 23: Middle East & Africa Face Recognition Lockers Market Revenue (USD Billion) Forecast, by Segment 3, 2018-2029
      Table 24: Middle East & Africa Face Recognition Lockers Market Revenue (USD Billion) Forecast, by Country, 2018-2029
      Research Process

      Data Library Research are conducted by industry experts who offer insight on industry structure, market segmentations technology assessment and competitive landscape (CL), and penetration, as well as on emerging trends. Their analysis is based on primary interviews (~ 80%) and secondary research (~ 20%) as well as years of professional expertise in their respective industries. Adding to this, by analysing historical trends and current market positions, our analysts predict where the market will be headed for the next five years. Furthermore, the varying trends of segment & categories geographically presented are also studied and the estimated based on the primary & secondary research.

      In this particular report from the supply side Data Library Research has conducted primary surveys (interviews) with the key level executives (VP, CEO’s, Marketing Director, Business Development Manager and SOFT) of the companies that active & prominent as well as the midsized organization

      FIGURE 1: DLR RESEARH PROCESS

      research-methodology1

      Primary Research

      Extensive primary research was conducted to gain a deeper insight of the market and industry performance. The analysis is based on both primary and secondary research as well as years of professional expertise in the respective industries.

      In addition to analysing current and historical trends, our analysts predict where the market is headed over the next five years.

      It varies by segment for these categories geographically presented in the list of market tables. Speaking about this particular report we have conducted primary surveys (interviews) with the key level executives (VP, CEO’s, Marketing Director, Business Development Manager and many more) of the major players active in the market.

      Secondary Research

      Secondary research was mainly used to collect and identify information useful for the extensive, technical, market-oriented, and Friend’s study of the Global Extra Neutral Alcohol. It was also used to obtain key information about major players, market classification and segmentation according to the industry trends, geographical markets, and developments related to the market and technology perspectives. For this study, analysts have gathered information from various credible sources, such as annual reports, sec filings, journals, white papers, SOFT presentations, and company web sites.

      Market Size Estimation

      Both, top-down and bottom-up approaches were used to estimate and validate the size of the Global market and to estimate the size of various other dependent submarkets in the overall Extra Neutral Alcohol. The key players in the market were identified through secondary research and their market contributions in the respective geographies were determined through primary and secondary research.

      Forecast Model

      research-methodology2

      Happy to Assist You

      If you have a question?

      info@datalibraryresearch.com

      IND : +91 955 279 0357

      Browse Related Reports